Abstract
Objective:
To determine whether MRI evaluation of thalamic volume differentiates MS from other disorders that cause MRI white matter abnormalities.
Methods:
There were 40 study participants: 10 participants with MS without additional comorbidities for white matter abnormalities (MS − c); 10 participants with MS with additional comorbidities for white matter abnormalities (MS + c); 10 participants with migraine, MRI white matter abnormalities, and no additional comorbidities for white matter abnormalities (Mig − c); and 10 participants previously incorrectly diagnosed with MS (Misdx). T1-magnetization-prepared rapid gradient-echo and T2-weighted three-dimensional fluid attenuation inversion recovery sequences were acquired on a Phillips Achieva d-Stream 3T MRI, and scans were randomly ordered and de-identified for a blinded reviewer who performed MRI segmentation using LesionTOADS.
Results:
Mean normalized thalamic volume differed among the 4 cohorts (analysis of variance, p = 0.005) and was smaller in the 20 MS participants compared with the 20 non-MS participants (p < 0.001), smaller in MS − c compared with Mig − c (p = 0.03), and smaller in MS + c compared with Misdx (p = 0.006). The sensitivity and specificity were both 0.75 for diagnosis of MS with a thalamic volume <0.0077.
Conclusions:
MRI volumetric evaluation of the thalamus, but not other deep gray-matter structures, differentiated MS from other diseases that cause white matter abnormalities and are often mistaken for MS. Evaluation for thalamic atrophy may improve accuracy for diagnosis of MS as an adjunct to additional radiologic criteria. Thalamic volumetric assessment by MRI in larger cohorts of patients undergoing evaluation for MS is needed, along with the development of automated and easily applied volumetric assessment tools for future clinical application.
Classification of evidence:
This study provides Class III evidence that MRI evaluation of thalamic volume differentiates MS from other diseases that cause white matter abnormalities.
The diagnosis of MS relies on an interpretation of clinical and radiographic data.1 The absence of a highly specific biomarker for MS in the setting of a considerable number of diseases and syndromes that can mimic its clinical and radiographic appearance2,3 makes accurate diagnosis challenging. Misdiagnosis of MS remains a problem with significant consequences for patients and health care systems.4–6 Patients incorrectly diagnosed with MS are exposed to unnecessary risks associated with disease modifying therapy (DMT) for MS, as well as resulting morbidities.6 Novel imaging techniques that facilitate differentiation of MS from other disorders may improve diagnostic accuracy. Thalamic atrophy has been identified early in the disease course of MS, including in pediatric MS,7 presymptomatic MS or “radiologically isolated syndrome,”8 and clinically isolated syndrome.9–11 Thus, MRI assessment of thalamic volume is a suitable candidate for evaluation as an imaging biomarker to distinguish MS from other disorders. Although atrophy of multiple gray-matter structures has been demonstrated in MS, in several recent studies, assessment of thalamic volume seemed to best differentiate MS from neuromyelitis spectrum disorder.12,13 This study aimed to determine whether MRI-based volumetric assessment of the thalamus can differentiate MS from migraine and other diseases that cause MRI white matter abnormalities and may mimic MS.
METHODS
The primary research question is to determine whether MRI evaluation of thalamic volume differentiated MS from other disorders that cause MRI white matter abnormalities. The methodology for this pilot study would provide Class III evidence for this research question.
Forty participants, comprising 4 cohorts, participated in the study. These included (1) 10 participants with a diagnosis of MS by 2010 criteria1 who also had no history of a comorbidity that may also cause MRI white matter abnormalities (MS − c); (2) 10 participants with a diagnosis of MS by 2010 criteria1 with at least 1 additional comorbidity known to cause MRI white matter abnormalities (MS + c); (3) 10 participants with a diagnosis of migraine and a history of an MRI with at least 2 white matter abnormalities in any location but with no history of additional comorbidities known to cause white matter abnormalities (Mig − c); and (4) 10 participants who had been determined to have been previously incorrectly diagnosed with MS, did not meet 2010 criteria,1 and in whom a variety of diagnoses had been identified to explain clinical and radiographic abnormalities mistaken for MS (Misdx). Diagnoses in the MS − c and MS + c cohorts had been established after evaluation by a neurologist with MS subspecialty training. Diagnoses in the Mig − c cohort had been established after evaluation by a neurologist. Diagnoses in the Misdx cohort were determined by a single neurologist with MS subspecialty training at the University of Vermont during the course of a new patient evaluation, after a complete evaluation of clinical history, neurologic examination, laboratory testing, and neuroimaging was complete. In these patients, 2010 MS diagnostic criteria1 were not met, and alternative diagnoses were identified.
T1-magnetization-prepared rapid gradient-echo (MPRAGE) and T2-weighted three-dimensional fluid attenuation inversion recovery (3D FLAIR) sequences were acquired on a Philips Achieva d-Stream 3T MRI, and scans were randomly ordered and de-identified for a blinded reviewer who performed MRI segmentation using LesionTOADS. Two registration steps were performed using the Advanced Normalization Tools registration framework.14 Each MPRAGE image was rigidly aligned to the MNI152 atlas, and the corresponding FLAIR scan was registered to the MPRAGE image, also using rigid alignment. All transformations were performed using 1 interpolation step by concatenation of the necessary transform matrices. Skull stripping was performed using SPECTRE.15
Whole-brain and lesion segmentation was performed using LesionTOADS.16 LesionTOADS is a fully automated segmentation algorithm that uses multichannel MRI (T1-MPRAGE and T2-FLAIR) data to simultaneously segment T2-lesions and the whole brain into major structures. This is done by combining the information of statistical atlases of segmentation likelihoods and a whole-brain topological atlas to create a topologically consistent segmentation. Volumes were all normalized to the intracranial volume calculated from the SPECTRE brain mask.
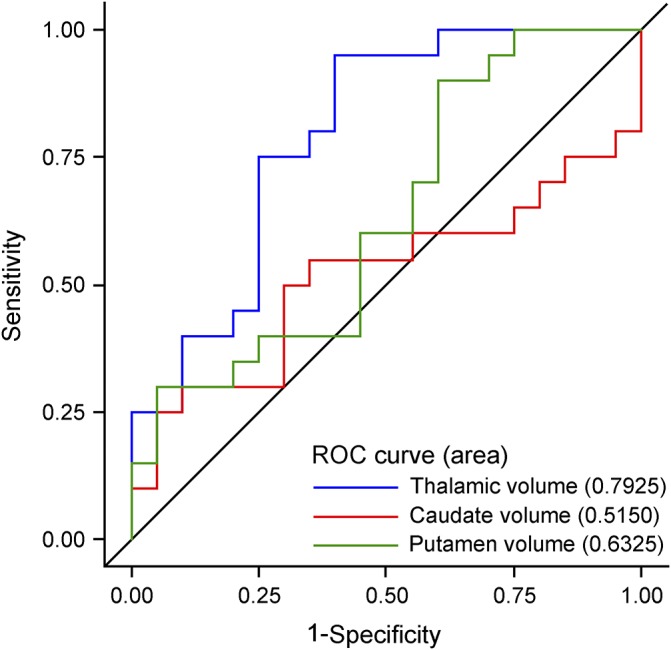
The Shapiro-Wilk test was used to evaluate results for normality. An analysis of variance (ANOVA) was used to test for difference between the 4 cohorts with a normal distribution. Individual contrasts using the ANOVA error term were used to compare the combined MS and non-MS cohorts as well as the various pairwise combinations of the 10-participant individual cohorts. A receiver operating characteristic (ROC) curve was generated to demonstrate sensitivity and specificity of thalamic volume for MS diagnosis. Visual evaluation of the ROC curve was used to choose a cutoff value that might provide optimal sensitivity and specificity for a diagnosis of MS. Sensitivity was defined as the probability of a thalamic volume less than the cutoff for patients with MS. Specificity was defined as the probability of a thalamic volume greater than or equal to the cutoff for non-MS patients.
Standard protocol approvals, registrations, and patient consents.
The study was approved by the University of Vermont Institutional Review Board, and all assessments were performed at the University of Vermont. Written informed consent was obtained from all participants.
RESULTS
Patient characteristics.
Baseline demographics of MS − c, MS + c, Mig − c, and Misdx cohorts are presented in table 1. There was no significant difference among the 4 cohorts in age (ANOVA p = 0.24).
Table 1.
Study participant characteristics
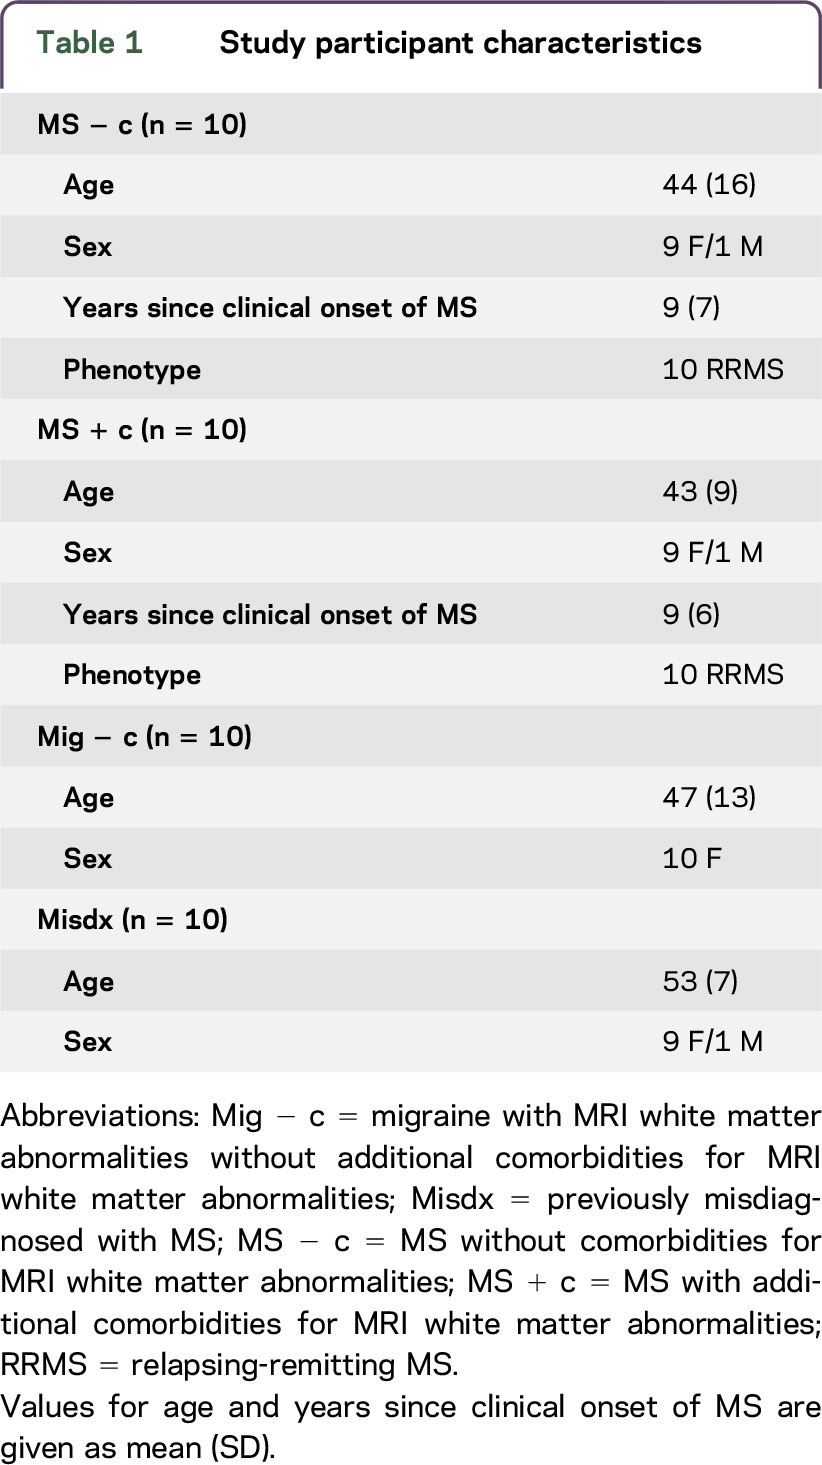
In the MS − c cohort, 8/10 participants were receiving DMT for MS at the time of participation in the study. The 2 remaining participants were both 63 years old; one had never received DMT after diagnosis in the early 1990s and the second discontinued DMT, because of questionable continued benefits, 6 months before participating in the study. In the MS + c cohort, 9/10 participants were receiving DMT at the time of the study and 1 participant had received a final dose of alemtuzumab approximately 3 years before participating in the study.
The comorbid conditions known to cause MRI white matter abnormalities in the MS + c cohort included migraine (4), hypertension (3), hypertension and migraine (1), diabetes mellitus and migraine (1), and diabetes mellitus and hypertension (1). In addition, 6/10 participants in this cohort had a history of comorbid tobacco use.
Mean duration of misdiagnosis in the Misdx cohort was 9 years (median: 6 years). In this cohort, 5/10 participants had received DMT for MS in the past. CSF evaluation, including testing for elevation in intrathecal IgG or oligoclonal bands, was normal in 9 participants and had not been performed in 1 participant. MRI of the cervical and thoracic spinal cord had been performed in 6/10 participants and was normal; only cervical spinal cord MRI had been performed in the remaining 4/10 participants and was normal in all cases. The clinical diagnoses in this cohort included migraine (2), psychogenic disorder and migraine (4), migraine and trigeminal neuralgia (1), migraine and vitamin B12 deficiency (1), vertigo (1), and transient numbness (1). Diagnoses presumed responsible for abnormal brain MRI findings in this cohort included migraine (2), migraine and small vessel ischemic disease (SVID) due to hypertension (1), migraine and SVID due to tobacco use (3), migraine and SVID due to tobacco use and hypertension (1), SVID due to tobacco use (2), and migraine, vitamin B12 deficiency, and SVID due to tobacco use (1).
Thalamic volumetric assessment.
Figure 1 depicts segmentation performed by LesionTOADS in 1 participant from each of the 4 cohorts. Normalized thalamic volume differed among the 4 cohorts (ANOVA, p = 0.005). The mean thalamic volumes of each cohort are presented in table 2, and figure 2 plots the mean thalamic volume of each participant in the 4 cohorts. Thalamic mean volumes were smaller in the 20 MS (MS − c and MS + c) compared with the 20 non-MS (Mig − c and Misdx) cohorts (p < 0.001).
Figure 1. LesionTOADS thalamic segmentation depicted in one participant from each cohort.
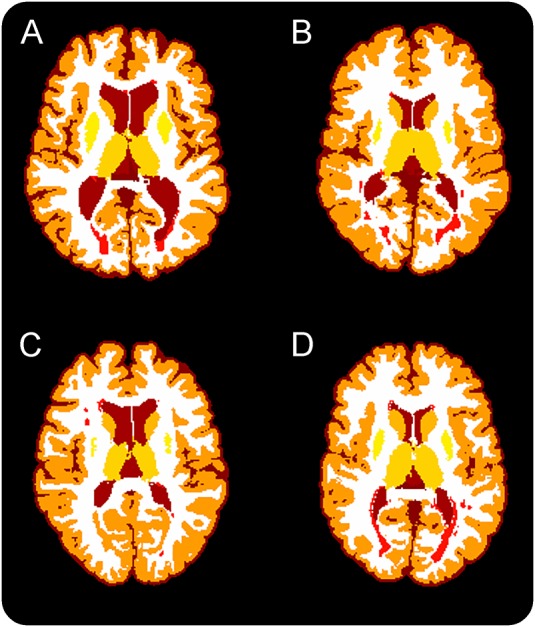
(A) MS without comorbidities for MRI white matter abnormalities, (B) MS with an additional comorbidity for MRI white matter abnormalities, (C) migraine with MRI white matter abnormalities and without additional comorbidities for MRI white matter abnormalities, (D) previously misdiagnosed with MS. Dark red: CSF, dark orange: cortical gray matter, light orange: thalamus and striatum, white: white matter, and red: lesions.
Table 2.
Thalamic volume as proportion of intracranial volume
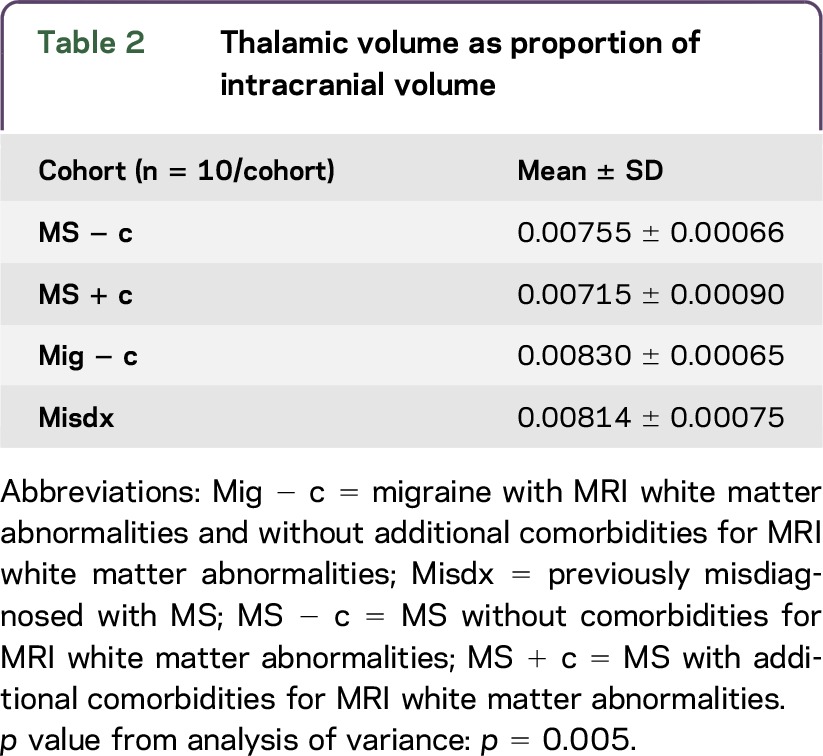
Figure 2. Thalamic volume normalized to intracranial volume for each participant in the 4 cohorts.
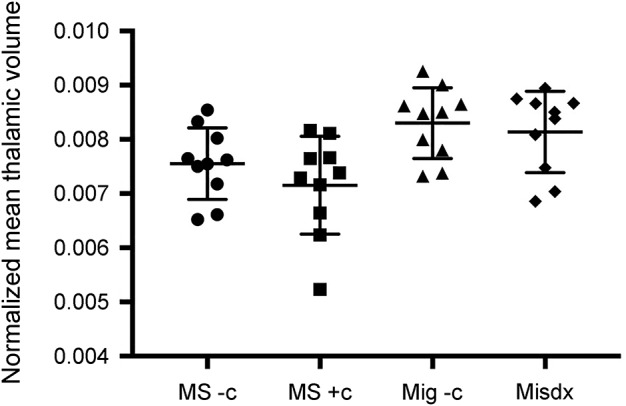
MS − c: MS without comorbidities for MRI white matter abnormalities, MS + c: MS with additional comorbidities for MRI white matter abnormalities, Mig − c: migraine with MRI white matter abnormalities and without additional comorbidities for MRI white matter abnormalities, Misdx: previously misdiagnosed with MS.
Comparing individual cohorts, mean thalamic volume was smaller in MS − c compared with Mig − c (p = 0.03), in MS + c compared with Misdx (p = 0.006), and in MS + c compared with Mig − c (p = 0.002). There was no difference in mean thalamic volumes between MS − c and Misdx (p = 0.09), MS − c and MS + c (p = 0.24), or between Mig − c and Misdx (p = 0.63) cohorts.
The sensitivity and specificity were both 0.75 for diagnosis of MS with normalized thalamic volume <0.0077. MS participants were 3 times more likely to have a thalamic volume <0.0077 compared with participants in the non-MS cohort. Figure 3 shows the ROC curve demonstrating sensitivity and specificity of thalamic volume for MS diagnosis.
Figure 3. Receiver operating characteristic (ROC) curve demonstrating sensitivity and specificity of thalamic, caudate, and putamen volume for MS diagnosis.
Volumetric assessment of other gray-matter structures.
There was no difference in caudate or putamen volume across the 4 cohorts (ANOVA, p = 0.34 and p = 0.09, respectively). Neither caudate (p = 0.88) or putamen (p = 0.08) mean volumes were different between the MS and non-MS cohorts (p = 0.88).
DISCUSSION
In this pilot study, MRI evaluation of normalized thalamic volume differentiated participants with MS from participants with other common causes of white matter abnormalities. The presence of diminished thalamic volume early in the course of MS compared with healthy controls,7–11 as well as the correlation between thalamic atrophy and clinical disability in MS, have been established over the last decade. Our findings are comparable to recent data12,13 reporting that thalamic volume was the gray-matter measure that best distinguished MS from neuromyelitis optica spectrum disorder.
Thalamic demyelinating lesions,17 destructive consequences of inflammation,18 and disruption of thalamocortical connections19 are potential contributors to thalamic atrophy in MS. Our data suggest that any disruption of thalamocortical tracts by white matter lesions in other disorders is not associated with the same degree of thalamic volume loss seen in patients with MS. The pathologic processes in migraine and SVID occurring at the site of white matter lesions are distinct from MS, and these processes, as well as direct thalamic injury in MS,20 may be responsible for the volumetric differences we observed. The presence of cortical lesions in MS21 that may also disrupt thalamocortical tract integrity and the absence of such lesions in migraine and other disorders that may mimic MS13,22 may have also influenced differences in thalamic volume demonstrated between the MS and non-MS cohorts.
Most participants (18/20) in our non-MS cohort had migraine and MRI white matter abnormalities. Our findings are particularly interesting in this population,23,24 since thalamocortical network dysfunction,25,26 thalamic microstructural changes,27,28 and thalamic morphological abnormalities29 have been recently demonstrated in individuals with migraine. Migraine is a disorder that is frequently clinically and radiographically mistaken for MS,5,6 and previous studies have also suggested an increased risk of migraine in patients with MS.30 In our MS + c cohort, 6/10 participants had migraine. The pathophysiology of white matter abnormalities in migraine,31 and the temporal progression of these lesions,32 differ from MS and could account for the differences in thalamic volume we observed. Recent studies have identified group-level gray-matter imaging abnormalities in migraine predominantly in the frontal and temporal lobes,33 and an association with lesions in the periaquductal gray matter and increased inflammatory activity in MS patients with migraine,34,35 suggesting the potential of MRI methods for the differentiation of patients with and without migraine.
There were several limitations to this study. Participants were recruited from a convenience sample. Although MS and migraine are more common in women, fewer men participated in the study. A prospective cohort evaluated at the time of clinical presentation would be a more suitable population to determine the sensitivity and specificity of MRI evaluation of thalamic volume for a diagnosis of MS. Although migraine may be frequently mistaken for MS,4–6,36 participants in the Mig − c cohort were not suspected to have MS. The final diagnoses attributed to clinical symptoms, and MRI abnormalities in the Misdx cohort lacked highly specific biomarkers, and it remains possible that specific diagnoses in some participants (though not the ruling out of MS) were incorrect. The Misdx cohort also did not comprise the full breadth of disorders that may be potentially mistaken for MS. Last, the small sample size of the MS + c and MS − c cohorts may have limited the ability to detect differences in thalamic volumes associated with the presence of an additional comorbidity for white matter lesions in participants with MS.
Although our study demonstrated a difference in normalized mean thalamic volumes between the MS and non-MS cohorts, the overlap between these cohorts suggests that thalamic volumetric assessment alone is unlikely to distinguish MS from other disorders. However, further data may demonstrate that a very low thalamic volume aids the confirmation of a diagnosis of MS. Furthermore, evaluation for thalamic atrophy may show promise as an adjunct to additional MS radiologic criteria. Incorporation of thalamic volumetric assessment into current MS diagnostic criteria1 could in principle demonstrate improved specificity and sensitivity for MS; however, whether this would be the case in the setting of consistent and proper application of current radiographic criteria—which is not always straightforward4,6—is unknown. Instead, evaluation of thalamic volume might be incorporated into algorithms currently in development using new imaging techniques for MS diagnosis. For instance, the recently developed FLAIR* MRI sequence allows evaluation of MS white matter lesions for a central vein—the “central vein” sign (CVS)—and differentiates MS from other populations.37,38 The sensitivity of MRI for visualization of MS cortical lesions presents methodological challenges; yet, the detection of such cortical lesions may also improve specificity of current imaging criteria for MS.39 Thus, an imaging algorithm that might incorporate assessment of CVS, detection of cortical lesions, and evaluation of thalamic volume may demonstrate improved sensitivity and specificity for MS compared with current imaging criteria.
In this study, MRI evaluation of thalamic volumes, but not other deep gray-matter structures, differentiated MS from other diseases that cause white matter abnormalities and are often mistaken for MS. Recent data support the use of such volumetric assessment of regional atrophy in distinguishing diseases with similar radiographic and phenotypical presentation.13,40 Thalamic volumetric assessment by MRI in larger cohorts of patients undergoing evaluation for MS is needed, along with development of automated and easily applied volumetric assessment tools,13 for future clinical application.
ACKNOWLEDGMENT
The authors thank Diantha Howard, MA, MS, Informatics Core Manager, University of Vermont Clinical Research Center, for data analysis; Jay Gonyea, MS, and Scott Hipko, BS, the University of Vermont MRI Center for Biomedical Imaging, for image acquisition.
GLOSSARY
- 3D FLAIR
three-dimensional fluid attenuation inversion recovery
- ANOVA
analysis of variance
- CVS
central vein sign
- DMT
disease modifying therapy
- ROC
receiver operating characteristic
- SVID
small vessel ischemic disease
- T1-MPRAGE
T1-magnetization-prepared rapid gradient-echo
AUTHOR CONTRIBUTIONS
Andrew J. Solomon contributed to conceptualization and study design, analysis and interpretation of the data, and drafting of the manuscript for intellectual content. Richard Watts and Blake E. Dewey contributed to analysis and interpretation of the data and drafting of the manuscript for intellectual content. Daniel S. Reich contributed to conceptualization and study design, analysis and interpretation of the data, and drafting of the manuscript for intellectual content.
STUDY FUNDING
Supported by the University of Vermont Department of Neurological Sciences, University of Vermont Department of Radiology, the University of Vermont MRI Center for Biomedical Imaging, and the Intramural Research Program of NINDS.
DISCLOSURE
A.J. Solomon consulted for Biogen, served on the scientific advisory board for Teva, Genentech, and EMD Serono. R. Watts received research support from NSF and NIH. B.E. Dewey reports no disclosures. D.S. Reich received research support from Vertex Pharmaceuticals, NINDS, and Myelin Repair Foundation. Go to Neurology.org/nn for full disclosure forms.
REFERENCES
- 1.Polman CH, Reingold SC, Banwell B, et al. . Diagnostic criteria for multiple sclerosis: 2010 revisions to the McDonald criteria. Ann Neurol 2011;69:292–302. [DOI] [PMC free article] [PubMed] [Google Scholar]
- 2.Brownlee WJ, Hardy TA, Fazekas F, Miller DH. Diagnosis of multiple sclerosis: progress and challenges. Lancet 2017;389:1336–1346. [DOI] [PubMed] [Google Scholar]
- 3.Toledano M, Weinshenker BG, Solomon AJ. A clinical approach to the differential diagnosis of multiple sclerosis. Curr Neurol Neurosci Rep 2015;15:57. [DOI] [PubMed] [Google Scholar]
- 4.Solomon AJ, Weinshenker BG. Misdiagnosis of multiple sclerosis: frequency, causes, effects, and prevention. Curr Neurol Neurosci Rep 2013;13:403. [DOI] [PubMed] [Google Scholar]
- 5.Solomon AJ, Klein EP, Bourdette D. “Undiagnosing” multiple sclerosis: the challenge of misdiagnosis in MS. Neurology 2012;78:1986–1991. [DOI] [PMC free article] [PubMed] [Google Scholar]
- 6.Solomon AJ, Bourdette DN, Cross AH, et al. . The contemporary spectrum of multiple sclerosis misdiagnosis: a multicenter study. Neurology 2016;87:1393–1399. [DOI] [PMC free article] [PubMed] [Google Scholar]
- 7.Aubert-Broche B, Fonov V, Ghassemi R, et al. . Regional brain atrophy in children with multiple sclerosis. Neuroimage 2011;58:409–415. [DOI] [PubMed] [Google Scholar]
- 8.Azevedo CJ, Overton E, Khadka S, et al. . Early CNS neurodegeneration in radiologically isolated syndrome. Neurol Neuroimmunol Neuroinflamm 2015;2:e102 doi: 10.1212/NXI.0000000000000102. [DOI] [PMC free article] [PubMed] [Google Scholar]
- 9.Bergsland N, Horakova D, Dwyer MG, et al. . Subcortical and cortical gray matter atrophy in a large sample of patients with clinically isolated syndrome and early relapsing-remitting multiple sclerosis. AJNR Am J Neuroradiol 2012;33:1573–1578. [DOI] [PMC free article] [PubMed] [Google Scholar]
- 10.Henry RG, Shieh M, Okuda DT, Evangelista A, Gorno-Tempini ML, Pelletier D. Regional grey matter atrophy in clinically isolated syndromes at presentation. J Neurol Neurosurg Psychiatry 2008;79:1236–1244. [DOI] [PMC free article] [PubMed] [Google Scholar]
- 11.Zivadinov R, Bergsland N, Dolezal O, et al. . Evolution of cortical and thalamus atrophy and disability progression in early relapsing-remitting MS during 5 years. AJNR Am J Neuroradiol 2013;34:1931–1939. [DOI] [PMC free article] [PubMed] [Google Scholar]
- 12.Hyun JW, Park G, Kwak K, et al. . Deep gray matter atrophy in neuromyelitis optica spectrum disorder and multiple sclerosis. Eur J Neurol 2017;24:437–445. [DOI] [PubMed] [Google Scholar]
- 13.Eshaghi A, Wottschel V, Cortese R, et al. . Gray matter MRI differentiates neuromyelitis optica from multiple sclerosis using random forest. Neurology 2016;87:2463–2470. [DOI] [PMC free article] [PubMed] [Google Scholar]
- 14.Avants BB, Tustison NJ, Stauffer M, Song G, Wu B, Gee JC. The Insight ToolKit image registration framework. Front Neuroinform 2014;8:44. [DOI] [PMC free article] [PubMed] [Google Scholar]
- 15.Carass A, Cuzzocreo J, Wheeler MB, Bazin PL, Resnick SM, Prince JL. Simple paradigm for extra-cerebral tissue removal: algorithm and analysis. Neuroimage 2011;56:1982–1992. [DOI] [PMC free article] [PubMed] [Google Scholar]
- 16.Shiee N, Bazin PL, Ozturk A, Reich DS, Calabresi PA, Pham DL. A topology-preserving approach to the segmentation of brain images with multiple sclerosis lesions. Neuroimage 2010;49:1524–1535. [DOI] [PMC free article] [PubMed] [Google Scholar]
- 17.Vercellino M, Plano F, Votta B, Mutani R, Giordana MT, Cavalla P. Grey matter pathology in multiple sclerosis. J Neuropathol Exp Neurol 2005;64:1101–1107. [DOI] [PubMed] [Google Scholar]
- 18.Herranz E, Gianni C, Louapre C, et al. . Neuroinflammatory component of gray matter pathology in multiple sclerosis. Ann Neurol 2016;80:776–790. [DOI] [PMC free article] [PubMed] [Google Scholar]
- 19.Henry RG, Shieh M, Amirbekian B, Chung S, Okuda DT, Pelletier D. Connecting white matter injury and thalamic atrophy in clinically isolated syndromes. J Neurol Sci 2009;282:61–66. [DOI] [PubMed] [Google Scholar]
- 20.Harrison DM, Oh J, Roy S, et al. . Thalamic lesions in multiple sclerosis by 7T MRI: clinical implications and relationship to cortical pathology. Mult Scler 2015;21:1139–1150. [DOI] [PMC free article] [PubMed] [Google Scholar]
- 21.Calabrese M, Filippi M, Gallo P. Cortical lesions in multiple sclerosis. Nat Rev Neurol 2010;6:438–444. [DOI] [PubMed] [Google Scholar]
- 22.Absinta M, Rocca MA, Colombo B, et al. . Patients with migraine do not have MRI-visible cortical lesions. J Neurol 2012;259:2695–2698. [DOI] [PubMed] [Google Scholar]
- 23.Kruit MC, van Buchem MA, Hofman PA, et al. . Migraine as a risk factor for subclinical brain lesions. JAMA 2004;291:427–434. [DOI] [PubMed] [Google Scholar]
- 24.Aradi M, Schwarcz A, Perlaki G, et al. . Quantitative MRI studies of chronic brain white matter hyperintensities in migraine patients. Headache 2013;53:752–763. [DOI] [PubMed] [Google Scholar]
- 25.Coppola G, Di Renzo A, Tinelli E, et al. . Thalamo-cortical network activity between migraine attacks: insights from MRI-based microstructural and functional resting-state network correlation analysis. J Headache Pain 2016;17:100. [DOI] [PMC free article] [PubMed] [Google Scholar]
- 26.Coppola G, Di Renzo A, Tinelli E, et al. . Thalamo-cortical network activity during spontaneous migraine attacks. Neurology 2016;87:2154–2160. [DOI] [PubMed] [Google Scholar]
- 27.Coppola G, Tinelli E, Lepre C, et al. . Dynamic changes in thalamic microstructure of migraine without aura patients: a diffusion tensor magnetic resonance imaging study. Eur J Neurol 2014;21:287–e13. [DOI] [PubMed] [Google Scholar]
- 28.Granziera C, Daducci A, Romascano D, et al. . Structural abnormalities in the thalamus of migraineurs with aura: a multiparametric study at 3 T. Hum Brain Mapp 2014;35:1461–1468. [DOI] [PMC free article] [PubMed] [Google Scholar]
- 29.Magon S, May A, Stankewitz A, et al. . Morphological abnormalities of thalamic Subnuclei in migraine: a multicenter MRI study at 3 Tesla. J Neurosci 2015;35:13800–13806. [DOI] [PMC free article] [PubMed] [Google Scholar]
- 30.Gelfand AA, Gelfand JM, Goadsby PJ. Migraine and multiple sclerosis: epidemiology and approach to treatment. Mult Scler Relat Disord 2013;2:73–79. [DOI] [PubMed] [Google Scholar]
- 31.Takano T, Tian GF, Peng W, et al. . Cortical spreading depression causes and coincides with tissue hypoxia. Nat Neurosci 2007;10:754–762. [DOI] [PubMed] [Google Scholar]
- 32.Hamedani AG, Rose KM, Peterlin BL, et al. . Migraine and white matter hyperintensities: the ARIC MRI study. Neurology 2013;81:1308–1313. [DOI] [PMC free article] [PubMed] [Google Scholar]
- 33.Rocca MA, Ceccarelli A, Falini A, et al. . Brain gray matter changes in migraine patients with T2-visible lesions: a 3-T MRI study. Stroke 2006;37:1765–1770. [DOI] [PubMed] [Google Scholar]
- 34.Gee JR, Chang J, Dublin AB, Vijayan N. The association of brainstem lesions with migraine-like headache: an imaging study of multiple sclerosis. Headache 2005;45:670–677. [DOI] [PubMed] [Google Scholar]
- 35.Graziano E, Hagemeier J, Weinstock-Guttman B, Ramasamy DP, Zivadinov R. Increased contrast enhancing lesion activity in relapsing-remitting multiple sclerosis migraine patients. Neuroimage Clin 2015;9:110–116. [DOI] [PMC free article] [PubMed] [Google Scholar]
- 36.Liu S, Kullnat J, Bourdette D, et al. . Prevalence of brain magnetic resonance imaging meeting Barkhof and McDonald criteria for dissemination in space among headache patients. Mult Scler 2013;19:1101–1105. [DOI] [PubMed] [Google Scholar]
- 37.Sati P, Oh J, Constable RT, et al. . The central vein sign and its clinical evaluation for the diagnosis of multiple sclerosis: a consensus statement from the North American Imaging in Multiple Sclerosis Cooperative. Nat Rev Neurol 2016;12:714–722. [DOI] [PubMed] [Google Scholar]
- 38.Solomon AJ, Schindler MK, Howard DB, et al. . “Central vessel sign” on 3T FLAIR* MRI for the differentiation of multiple sclerosis from migraine. Ann Clin Transl Neurol 2016;3:82–87. [DOI] [PMC free article] [PubMed] [Google Scholar]
- 39.Preziosa P, Rocca M, Mesaros S, et al. . Comparison of MRI criteria for the diagnosis of multiple sclerosis: role of cortical lesions (S45.003). Neurology 2016:86(16 suppl). [Google Scholar]
- 40.Guevara C, Bulatova K, Barker GJ, Gonzalez G, Crossley NA, Kempton MJ. Whole-brain atrophy differences between progressive Supranuclear Palsy and Idiopathic Parkinson's disease. Front Aging Neurosci 2016;8:218. [DOI] [PMC free article] [PubMed] [Google Scholar]


