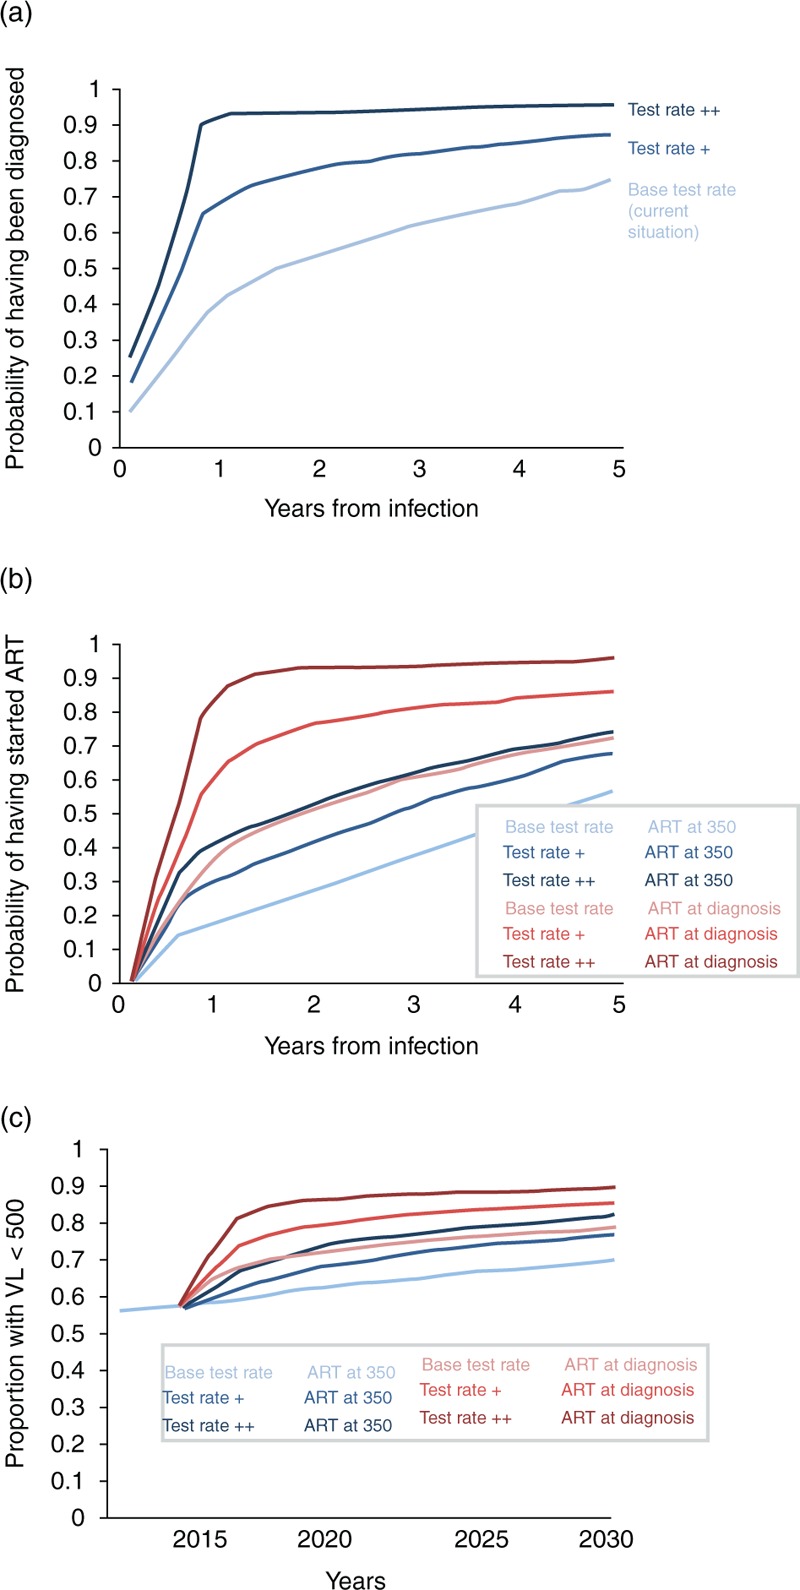
Fig. 1.
Potential changes in HIV testing and ART initiation considered after 2015 and effect on proportion with viral suppression.

(a) Kaplan–Meier plot of time from infection to diagnosis, according to the HIV test rate. For men infected after 2015. (b) Kaplan–Meier plot of time from infection to ART initiation, according to the HIV test rate and ART initiation strategy. For men infected after 2015. (c) Proportion of all HIV-positive men who have viral load below 500 copies/ml according to calendar year.
