

Introduction
Fibromyalgia syndrome (FMS) involves generalized body pain along with commonly co-occurring symptoms of sleep dysfunction, [10] fatigue, [76] and mood, [26; 70] which result in increased physical impairment.[51; 73] The multi-symptom nature and clinical complexity of FMS are well recognized[30; 54], and FMS typically presents a number of symptoms including pain, fatigue, mood disturbance, and poor sleep in additional to chronic generalized body pain.[42] Previous research in our laboratory suggested sequential associations; emotional distress and pain may increase later fatigue, fatigue may lead to increased pain, and pain may lead to increased emotional distress.[54] When the exacerbation of one symptom leads to aggravation of another problem it seems to have adverse impact on how patients manage their condition. Similarly, Vitiello et al.[74] suggest a reciprocal relationship between sleep and pain that can lead to significant dysregulation of behavioral patterns in activity and sleep-wake schedules, and to avoidance behaviors that may suppress an effective coping response to worsened pain, fatigue, mood, and sleep. However, there is little research regarding the patterns of behavioral functioning in FMS and how these relate to the experienced symptoms of pain, fatigue, mood, physical functioning, and sleep.
Limited work has focused on quantifying physical activity in FMS with conflicting results[24; 37; 48; 61; 67] One study[48] showed reduced activity levels in FMS relative to controls, whereas others[27; 35; 37] reported consistent activity differences only in the subset of patients with comorbid depression.[37] Interpreting these results is complicated by use of different activity measurements[27; 48; 67] and by the practice of averaging over important inter-day and day-to-day variability in activity level, timing, and duration. This is illustrated in a recent study that showed no difference in overall activity levels between FMS patients and controls, but for which the within-day patterns of activity differed significantly for the FMS patients.[27]
It is important to note that the severity of FMS symptoms varies significantly across time, often making it difficult for patients to anticipate how they will feel from day to day.[23; 80] Such dilemma has been well described in a recent JAMA case report[17] of a 64-year-old woman with FMS. She states: “I never know what my day is going to be like. I have to wake up in the morning and see what hurts and how I can medicate it and how I can function for the day.” This illustrates the difficulty that FMS patients commonly experience, where they feel compelled to adjust their behavioral and functional patterns to unpredictable, ever fluctuating symptom burden. The importance of adaptive functioning in chronic pain has been well documented, [31] but FMS patients may experience particular difficulties in attaining consistent adaptive functioning in the presence of symptom fluctuation and volatility. Activity and behavioral variability (regularity/consistency of daily routines) may be represented better by activity rhythms, which factor in activity level, timing, and duration over multiple days. To our knowledge, there have been no studies evaluating activity rhythms in FMS. This cross-sectional study aimed to describe activity rhythms in FMS and evaluate the relationship between such rhythms and overall FMS symptoms presentation of pain, fatigue, mood, physical functioning, and sleep.
Methods
Participants
We utilized an existing sample of 307 patients with fibromyalgia who were recruited for a behavioral treatment study. For complete assessment procedures, see Okifuji et al.[55] For the purpose of this study we excluded participants who had missing or incomplete baseline actigraphy data (n=12). We also excluded 3 subjects with peak mean activity between 11:00pm and 8:00am as such values may reflect a ‘switched’ diurnal pattern (being asleep during the day and awake throughout the night) which is commonly seen in shift-work or in patients devoid of circadian rhythm entrainers (e.g., as in hospital or nursing home settings).[3; 5]
The data from the remaining 292 patients were utilized in this study. Demographics and clinical information for this sample are provided in Tables 1 and 2. The overwhelming majority of this sample were white/Caucasian (94.5%) females (93.2%). All participants were recruited through referrals from the University of Utah Pain Management Center, other community physicians, and by community advertisements. The Institutional Review Board at the University of Utah approved this study and all participants signed an informed consent prior to participation.
Table 1.
Demographics
| Age: Mean ± SD [Range] | 45.1 ± 11.1 [211–65] |
|
| |
| Gender: N (%) | |
| Females | 272 (93.2%) |
| Males | 20 (6.8%) |
|
| |
| Ethnicity: N (%) | |
| Hispanic or Latino | 15 (5.1%) |
| Not Hispanic or Latino | 275 (94.2%) |
| Missing | 2 (0.7%) |
|
| |
| Race: N (%) | |
| Asian | 4 (1.4%) |
| White | 276 (94.5%) |
| American Indian/ Alaskan Native | 1 (0.3%) |
| Other | 10 (3.4%) |
| Missing | 1 (0.3%) |
|
| |
| Highest Level of Education: N (%) | |
| 9th grade or less | 1 (0.3%) |
| 10th–12th grade | 9 (3.1%) |
| High School Graduate | 30 (10.3%) |
| Trade/Technical school | 23 (7.9%) |
| Some College | 112 (38.4%) |
| College Degree | 91 (31.2%) |
| Masters Degree or higher | 26 (8.9%) |
|
| |
| Marital Status: N (%) | |
| Single (never married) | 31 (10.6%) |
| Married | 187 (64.0%) |
| Separated/Divorced | 69 (23.6) |
| Widowed | 5 (1.7%) |
|
| |
| Living status: N (%) | |
| Living alone | 24 (8.2%) |
| With Spouse/Significant Other | 179 (61.3%) |
| With Children | 38 (13.0%) |
| Other | 43 (14.7%) |
| Missing | 8 (2.7%) |
|
| |
| Estimated total household income: N (%) | |
| < $10,000 | 31 (10.6%) |
| $10,000 – $19,000 | 23 (7.9%) |
| $20,000 – $29,000 | 27 (9.2%) |
| $30,000 – $39,000 | 41 (14.0%) |
| $40,000 – $49,000 | 27 (9.2%) |
| $50,000 – $59,000 | 37 (12.7%) |
| $60,000 – $69,000 | 27 (9.2%) |
| ≥ $70,000 | 77 (26.4%) |
| Missing | 2 (0.7%) |
|
| |
| Current Employment Status: N (%) | |
| Full-time (>30hr/wk) | 80 (27.4%) |
| Part-time (<30hr/wk) | 39 (13.4%) |
| Unemployed (NOT due to pain) | 13 (4.5%) |
| Homemaker | 33 (11.3%) |
| Retired | 5 (1.7%) |
| Working part-time due to pain | 15 (5.1%) |
| Unemployed due to pain | 55 (18.8%) |
| Retired early due to pain | 10 (3.4) |
| Other | 40 (13.7%) |
| Missing | 2 (0.7%) |
|
| |
| Currently on long-term disability: N (%) | |
| Yes | 40 (13.6%) |
| No | 252 (86.3%) |
|
| |
| Pending disability claim: N (%) | |
| Yes | 43 (14.7%) |
| No | 245 (83.9%) |
| Missing | 4 (1.4%) |
Table 2.
Clinical Information for the total sample
| Currently receiving treatment for FMS | |
| Yes | 190 (65.1%) |
| No | 101 (34.6%) |
| Missing | 1 (0.3%) |
|
| |
| Current sleep disturbances | |
| Yes | 204 (69.2%) |
| No | 88 (30.8%) |
|
| |
| Diagnosis of sleep apnea | |
| Yes | 68 (23.3%) |
| No | 223 (76.4%) |
| Missing | 1 (0.3%) |
|
| |
| Legs jerking at night (“restless legs”) | |
| Yes | 157 (53.8%) |
| No | 135 (46.2%) |
|
| |
| Current fatigue | |
| Yes | 271 (92.8%) |
| No | 21 (7.2%) |
|
| |
| Migraine Headache | |
| Yes | 178 (65.1%) |
| No | 113 (38.7%) |
| Missing | 1 (0.3%) |
|
| |
| Tension Headache | |
| Yes | 200 (68.5%) |
| No | 92 (31.5%) |
|
| |
| Depression Diagnosis | |
| No Depressive Disorder | 55 (18.8%) |
| Major Depressive Disorder | 101 (34.6%) |
| Dysthymia | 22 (7.5%) |
| Depression Disorder NOS | 10 (3.4%) |
| Bipolar Disorder | 23 (7.9%) |
| Other | 9 (3.1%) |
| Depression in Remission | 33 (11.3%) |
| Missing | 39 (13.4%) |
|
| |
| Anxiety Diagnosis | |
| No Anxiety Disorder | 110 (37.7%) |
| Panic Disorder | 6 (2.1%) |
| Generalized Anxiety Disorder | 50 (17.1%) |
| Posttraumatic Stress Disorder | 21 (7.2%) |
| Obsessive Compulsive Disorder | 8 (2.7%) |
| Anxiety NOS | 8 (2.7%) |
| Other | 9 (3.1%) |
| Missing | 80 (27.4%) |
|
| |
| Panic Attacks | |
| Yes | 109 (37.3%) |
| No | 183 (62.7%) |
|
| |
| Diagnosed with irritable bowel syndrome | |
| Yes | 114 (39%) |
| No | 178 (61%) |
|
| |
| Diabetes | |
| Yes | 14 (4.8%) |
| No | 278 (95.2%) |
|
| |
| Non-opioids, NSAIDS, cox-2, other pain meds | |
| Yes | 234 (80.1%) |
| No | 56 (19.2%) |
| Missing | 2 (0.7%) |
|
| |
| Current opioid use | |
| Yes | 109 (37.3) |
| No | 181 (62.0%) |
| Missing | 2 (0.7%) |
|
| |
| AEDs | |
| Yes | 82 (28.1%) |
| No | 208 (71.2%) |
| Missing | 2 (0.7%) |
|
| |
| Tricyclics | |
| Yes | 37 (12.7%) |
| No | 253 (86.6%) |
| Missing | 2 (0.7%) |
|
| |
| SSRI/SNRI | |
| Yes | 156 (53.4%) |
| No | 134 (45.9%) |
| Missing | 2 (0.7%) |
|
| |
| Benzodiazepines | |
| Yes | 81 (27.7%) |
| No | 209 (71.6%) |
| Missing | 2 (0.7%) |
|
| |
| Non-benzodiazepines hypnotic, other antidepressant/anti-anxiety | |
| Yes | 128 (43.8%) |
| No | 162 (55.5%) |
| Missing | 2 (0.7%) |
|
| |
| Muscle Relaxants | |
| Yes | 76 (26.0%) |
| No | 214 (73.3%) |
| Missing | 2 (0.7%) |
|
| |
| Mood stabilizers | |
| Yes | 20 (6.8%) |
| No | 270 (92.5%) |
| Missing | 2 (0.7%) |
|
| |
| Stimulants | |
| Yes | 32 (11.0%) |
| No | 258 (88.4%) |
| Missing | 2 (0.7%) |
Procedure
All participants provided a 7-day actigraphy record, completed a questionnaire packet addressing pain, mood, fatigue, functioning and comorbidities, and were seen for medical, physical, and semi-structured psychological assessment. The questionnaires were completed at the time of the comprehensive evaluation for the parent study. The home assessment protocol was done for a week immediately following the evaluation after establishing the eligibility of the participants. The symptom measures typically asked the “usual” levels of the symptom severity in the recent past (generally a week or two at most).
Semi-Structured Psychological Assessment
To better characterize this sample, a licensed psychologist conducted a structured interview with each participant, evaluating pain history, current functioning, psychosocial history, and mood. Additionally, the anxiety and depression modules of the Structured Clinical Interview for the Diagnosis of Mental Disorders[22] were utilized (Table 2).
Assessment of Activity Rhythms
The MicroMini-Motionlogger Actigraph (Ambulatory Monitoring, Ardsley, NY) was used to measure activity and sleep parameters. The actigraph resembles a small wristwatch in size, weight, and appearance, and is worn on the non-dominant wrist. Participants were instructed to wear the device continually for 7 days. The actigraph contains a microprocessor and 64K RAM memory as well as a piezoelectric linear accelerometer (sensitivity <.01 g-force) that samples wrist movement in three dimensions at a sampling rate of 32Hz. By measuring activity over time the actigraph allows for derivation of objective measurement of activity rhythms.[59] The use of actigraphy for monitoring sleep as well as characterizing activity patterns has been extensively evaluated for validity, reliability, sensitivity, and effectiveness. Objective actigraphic assessment is well accepted in clinical research, offering relatively low cost, low intrusiveness, and good utility.[4; 41] In our study the actigraph was set by research staff and its settings could not be modified by the user. As this actigraph has no display, no feedback is provided in real time and the participants are blind to this data. The research staff informed participants that the actigraph is water proof and that it should not be removed during the entire 7-day evaluation period. When devices were returned, data from the device were downloaded to a desktop computer and analyzed using Action-3 (Ambulatory Monitoring Inc., Ardsley, NY). To ensure consistency among participants and to remove any first-day biases, the data for each subject (~7 days) were trimmed to begin at noon post first full night of actigraph recording and end at noon of the last day. This trimming process ensures that travel from and to the research offices was not included in our analyses, as such travel is outside of the participants’ normal routines. Further support for the decision to trim the lead-in period derives from our clinical observation that usual energy and activity of FMS patients may be challenged during the initial encounters with the potentially stressful tasks of a new research protocol. Because of such trimming, each subject had 6 full 24-hour periods that start and end at noon. Patients with missing actigraphic data (missing data for >1 night per week or >8hr of missing data in a given day) were excluded from this study (n=12). The substantial majority (85%) of our participants had no missing actigraphic data at all and appeared to have followed the research staff advice not to remove the actigraph. For those with some missing data, the mean cumulative missing time was 2.5hr for the total 6-days. No individual included in these analyses had consecutive missing data for longer than 4hr per day.
Actigraph software includes algorithms for estimating sleep-wake times as well as time in bed. Since the actigraphy is based on movement alone, one concern is distinguishing sleep from quiescent rest. A person may get into bed but be relatively inactive for some time prior to sleep onset. We followed previously validated procedures for improving accuracy of time in bed and sleep onset latency calculations by incorporating self-report of times in- and out- of bed.[11] For this purpose we utilized electronic sleep log information that was collected each morning and integrated with the visual time series from the actigraph recordings. These procedures allow better determination of intervals for Down (i.e., the period of time the participant was generally in bed attempting to sleep) and Up (i.e., the period of time between two successive Down intervals). After establishing Down and Up intervals, sleep variables were derived from the Action-3 software using the Sadeh scoring algorithm.[65] Sleep variables derived included: total sleep time, sleep onset latency, wake after sleep onset, sleep efficiency, percent sleep during Up intervals, Down activity mean, and Up activity mean. All measures were the average of the 6-day actigraphy recordings. For full description of these measures see Table 3.
Table 3.
Actigraphy measures
| Measure | Description | Meaning | |
|---|---|---|---|
| Scoring Measures | Down Interval | Manually set and derived utilizing validated procedures [10] utilizing self-reported sleep times along with objective actigraph data | Generally, refers to the “night” of an individual when they are generally in bed attempting to sleep for the night |
| Up Interval | The default period of time between two successive down intervals | Generally, refers to the “day” of an individual from getting out of bed in the morning and getting back into bed for the night | |
| Sleep Measures | Total sleep time | Average sleep time during Down intervals | Average amount of nighttime sleep |
| Sleep onset latency | Time it took to fall asleep from the start of the Down interval | Average amount of time taken to fall asleep | |
| Wake after sleep onset | Total wake time post the first sleep period of Down interval | Average time spent awake during nighttime awakenings | |
| Sleep efficiency | Proportion of total sleep time of the Down interval | Percent or sleep during the time spent in bed. Higher values indicating better sleep efficiency | |
| Percent sleep during Up intervals | Proportion of sleep time of the Up interval | Naps or sleep times that are not a part of the stereotypical nighttime sleep period | |
| Activity Measures | Down activity mean | Average activity levels during Down intervals | Higher values indicating more activity during the “night” or “sleep time” |
| Up activity Mean | Average activity levels during Up intervals | Higher values indicating higher levels of physical activity during the day | |
| Activity Rhythm Measures | Amplitude | Distance between the mean of the curve and its peak | Higher values are indicative of higher rhythmicity as well as higher overall maximum activity amount |
| Amplitude Consistency | Daily variation (expressed in standard errors) of Amplitude compared to the weekly Amplitude average (i.e., the degree of variation of the maximum activity amount) | Higher values indicate higher degree of variability and higher inconsistency in the amount of daily maximum activity | |
| Phi | Time of day of the average peak activity | Later values indicate later peak of activity and may also indicate a more delayed rhythm | |
| Phi Consistency | Daily variation (expressed in standard errors) of Phi compared to the weekly Phi average (i.e., the degree of variation of the peak activity time) | Higher values indicate higher degree of variability and higher inconsistency in the daily timing of peak activity | |
| Mesor | A person’s mean level of activity in native units of the actigraph | Average activity levels over the full week period (not clinically meaningful as averages over both day and night) | |
| Mesor Consistency | Daily variation (expressed in standard errors) of Mesor compared to the weekly Mesor average (i.e., the degree of variation of the average activity during a given 24-hr period) | Higher values indicate higher degree of variability and higher inconsistency in the average activity level during 24-hr period over the entire week |
Once the actigraph data were trimmed and scored, the epoch-by-epoch (minute-by-minute) activity levels were exported into SPSS v24, [1] where a continuous clock time was applied to each individual’s activity data. Each participant’s activity data were then fitted independently to a cosine model with 24-hour periodicity (see Figures 1a and 1b). As mentioned above, such methodology has been widely used in other clinical populations[8; 46; 53; 56; 57] and is recognized for the evaluation of activity rhythm disturbances in the published practice parameters for the use of actigraphy.[15] The model yields the weekly values of Amplitude, Phi, and Mesor. Figure 2 provides a visual description of the model measures and Table 3 provides detailed explanation of each measure along with its interpretation. Mesor is a person’s mean level of activity in native units of the actigraph. Amplitude is the distance between the Mesor and the peak of the curve, at the point where the first derivative equals zero and the second derivative is negative. The Amplitude of the activity rhythm can be thought of as the range or variability of an individual’s movement activity over the course of a day. Amplitude has been used in previous work as an indicator of rhythmicity with higher values indicating increased behavioral rhythmicity (e.g., keeping regular and consistent daily routines).[45] Phi refers to the time of day of the average peak activity over the week with later peak times indicating later timing of high activity levels.
Figure 1.


Figure 1a: Example A – 6 day activity rhythm of an FMS patient with a relatively good model fit (R2=0.59, Amplitude=1.07, Phi=15.85, Phi Consistency = 0.33, Mesor=1.52, activity mean during Up=160, activity mean during down=15). Blue data points are observed activity data and green data points are the predicted model.
Figure 1b: Example B – 6 day activity rhythm of an FMS patient with a relatively poor model fit (R2=0.27, Amplitude=0.57, Phi=15.95, Phi Consistency = 0.46, Mesor=1.73, activity mean during Up=164, activity mean during down=48). Blue data points are observed activity data and green data points are the predicted model.
Figure 2.

Circadian Activity Rhythm (CAR) Parameters
The simple cosine model provides a substantively interpretable high-level summary of behavioral activity rather than a detailed curve fitting solution, which would require many additional components in a Fourier series. To verify that the weekly (overall) estimates for Amplitude, Phi, and Mesor parameters are representative of participants’ typical experience, we also applied the cosine model to each day independently and extracted daily values of Amplitude, Phi, and Mesor. From these daily estimates, we calculated for each individual the Amplitude Variability, Phi Variability, and Mesor Variability as the respective standard deviations of the daily Amplitude, Phi, and Mesor estimates. When divided by the square root of six, the number of days assessed, the Variability measures can equally be thought of as the standard errors of the random process generating the mean activity parameter estimates, with higher values indicating greater uncertainty in the activity parameter mean (over six days) estimates. This also allowed us to control statistically for fluctuations in the activity rhythm parameters that might otherwise lead to chance relationships. While pattern/rhythms can in general only be ascertained only if multiple days are used, [4] we further exploit their availability in this dataset as indicators of temporal variability and measurement quality, specifically the within-person precision of estimation of mean individual Amplitude, Phi, and Mesor.
Definitive statistical tests were conducted with continuous measures of the activity rhythms (i.e., Amplitude, Phi, and Mesor), but for graphical description only, we classified individuals on each activity measure into one of three ordinal categories defined by boxplot summaries of the univariate distributions (i.e., the three tertiles: <25th%, 25th–75th%, and >75th%). There are multiple ways in which we could have divided the sample to better explain the associations revealed in our omnibus testing using the continuous measures. We observed clearer discontinuities however with three visual clusters of unequal size that emerged in univariate quantile plots, corresponding approximately with the regions below, within, and above the central interquartile range. This division further corresponds naturally with the pragmatic idea of worse, average, and better. In addition, we conducted follow-up analyses incorporating the Amplitude and Phi groupings, which have evident pragmatic or clinical utility. It is important to note that we settled on percentile groupings a-priori and did not run the analyses in any other way.
Measurements of FMS Symptoms
The study’s main focus was on the relationship between activity rhythms and the commonly co-occurring symptoms of FMS. We utilized a single self-reported measure for each symptom within our major analyses to balance the representation of each dimension.
Pain Severity and Interference
In this study we utilized the pain severity scale from the Multidimensional Pain Inventory (MPI-pain).[33; 62] Our choice of this more general pain measure as opposed to FMS-specific measure was motivated by on our intention to assess how pain itself, rather than FMS symptom burden in general, impacts the patient’s life. This questionnaire asks how pain interferes with different life activities and how severe it was over the last week.
Physical Impairment and Functioning
Fibromyalgia Impact Questionnaire (FIQ)[13] was used as a measure of physical impairment and functionality. The FIQ includes a physical impairment scale which is used in these analyses. Patients are asked to rate from 0–3 the degree of their engagement in common 11 activities such as going shopping, preparing meals, driving, and climbing stairs.
Fatigue
Fatigue was assessed using the Multidimensional Fatigue Inventory (MFI).[69] The inventory covers 5 dimensions: General Fatigue, Physical Fatigue, Mental Fatigue, Reduced Motivation, and Reduced Activity. This analysis utilized the total score (MFI-total; sum of the 5-scales) as an indicator of Fatigue.
Mood
Mood (i.e., depressive symptomology) was valuated using the Center for the Epidemiological Studies Depression Scale (CESD).[62] This scale measures symptoms associated with depression over the past week and includes 20-items covering feelings of guilt and shame, depressed affect, and somatic symptoms.
Sleep
This study did not include a self-reported validated measure of sleep quality or disturbance analogous to the measures assessing symptoms of pain, fatigue, mood, and functioning. Actigraphy-derived sleep measures were available, but to eliminate any possibility of artefactual measurement linkage, these were not used in our principal conservative evaluations of the association between actigraphy parameters and clinical measures. For our exploratory analyses, we did include the activity-derived measures of total sleep time, sleep onset latency, and wake after sleep onset as indicators of sleep. We also provided information pertaining to sleep efficiency, a further derived measure defined as the proportion of total sleep time over the total Down interval, incorporating self-reported as well as actigraphic data. Higher sleep efficiency is commonly used as an indicator of improved quality.[9]
Statistical Analysis
Descriptive Statistics
Descriptive statistics for all the variables were computed along with the frequency distribution for the activity rhythm variables. We also computed intraclass correlations for Amplitude, Phi, and Mesor. As with reliability measures in general, the intraclass correlations depend on the true cross-person heterogeneity in the population as well as the precision of measurement. Additionally, we evaluated the relationship between the activity rhythm variables (Amplitude, Phi, and Mesor) using bivariate correlations (i.e., Person’s r).
Primary analyses
Our primary analyses evaluated the relationship between the activity rhythms and the commonly co-occurring symptom of pain, fatigue, mood, and functioning symptoms in patients with FMS. For this purpose, we considered multivariate relationships between sets of variables: Set Y, Set X, and Set D. Set Y consists of the four clinical measures: pain, fatigue, mood, and physical impairment. Set X contains the actigraphic variables, which we further differentiated by type of actigraphic estimate: Set XR contains the rhythm parameter estimates (Amplitude, Phi, and Mesor), while Set XSE consists of their standard errors (equivalently, their variation across days: Amplitude Variability, Phi Variability, and Mesor Variability). Set D contains the background demographic covariates of Age, Income, and Education. Since the study design is effectively cross-sectional, no causal or temporal attribution can be made. Accordingly, all analyses are based on contemporaneous associations only, and we do not partition the variables into dependent outcomes and independent predictors. In particular, we do not assume that actigraphic variables are more fundamental than clinical ones.
The first and broadest question addressed whether an overall association existed at all between actigraphy variables and clinical measures. For this purpose, we examined the magnitude and significance of the first canonical correlation between Set X and Set Y. As a follow-up to this canonical correlation we sought to investigate whether unique association remained between actigraphic and clinical measures after controlling statistically for other blocks of variables. In keeping with the criterion of associational decomposition, we used covariance selection models[20; 40] that assume no explanatory structure. All hypotheses were tested, using the graphical modeling program MIM and the structural equation modeling program Mplus, as likelihood ratio tests between nested models. In covariance selection models, the set of partial covariances linking Sets XR to Yare set to zero in the inverse covariance matrix and the change in fit examined. Three main hypotheses were tested (these are represented by their corresponding null hypothesis):
Hypothesis 1
The null hypothesis Y∐D asserts that Set Y and Set D are independent, implying the equality of the fit of multivariate models with and without associations between Set Y and Set D. In the covariance selection approach, the null hypothesis model is obtained by setting all partial covariances between Set Y and Set D in the saturated (unrestricted) model to zero. The equality of fit between the two models is evaluated by a likelihood ratio test and the chi square statistic. Since all model elements are covariances, the test is based on association only with no assumption of temporal or causal priority. Rejecting this null hypothesis (Y∐̶D) implies that there is a relationship between Set Y (clinical measures) and Set D (actigraphy derived Variability measures). In other words, that Set Y and Set D are not independent.
Hypothesis 2
The null hypothesis Y∐XSE |D asserts that Set Y and Set XSE are unassociated conditional on Set D. The null implies the equality of the fit of models allowing, and not allowing, associations between Set Y and Set XSE, controlled for Set D. Rejecting this null hypothesis implies that the Set XSE measures of temporal variability contain unique information, not found in Set D, contributing to their association with clinical Set Y. In other words, rejecting this null hypothesis implies a significant relationship between Set Y (clinical measures) and the operationally independent Set XSE (actigraphy derived Variability measures) while controlling for Set D (demographics).
Hypothesis 3
The null hypothesis Y∐XR|D, XSE asserts that Set Y and Set XR are unassociated conditionally on both Set D and Set XSE. This null hypothesis implies the equality of the fit of the full saturated multivariate model for all four variable sets with the model in which the conditional associations between Set Y and Set XR (only) are eliminated. Rejecting this null hypothesis implies that the Set XR activity rhythm parameters (Amplitude, Phi, Mesor) have unique information linking them to the clinical measures beyond the information contained in Set D and Set XSE. This is the strongest claim possible, as it implies that neither background variables, nor temporal variabilities (day-to-day fluctuations) can account for the association between actigraphy rhythm parameters Set XR and the operationally independent clinical measures of Set Y. This key hypothesis is illustrated in Figure 3.
Figure 3.
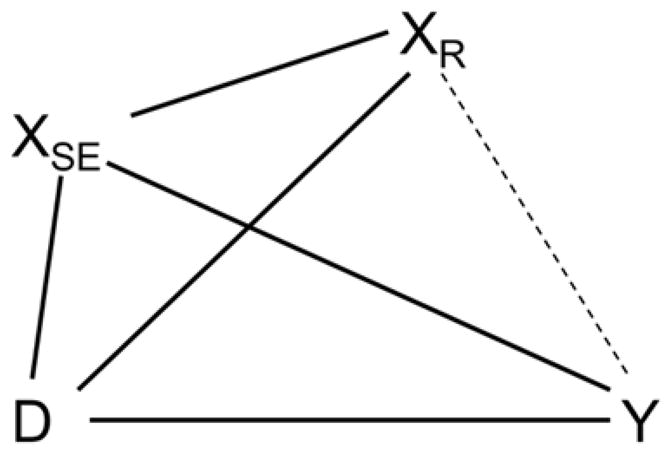
Graphical model testing the null hypothesis Y∐XR|D, XSE. The hypothesis is evaluated by likelihood ratio test between a saturated model and one in which all covariances between Set XR and Set Y are set to zero.
As activity count means are commonly used in this area of research, [35; 37; 48] we assessed whether activity rhythm measures provide unique additional information when compared to utilization of weekly activity averages during the day (i.e., activity average during Up and Down Intervals). Using similar graphical modeling and structural equation modeling approaches we evaluated whether the association between Set XR and Set Y remained relevant after controlling for activity level averages over the entire week. This null hypothesis implies no residual association between Set Y and Set XR conditional on the activity rhythm parameters. Rejecting the null hypothesis implies that the activity rhythm parameters provide unique information above and beyond that contained in weekly activity level averages alone.
Follow-up Analyses: Activity Rhythm Parameters and FMS Symptom
Following these definitive multivariate statistical tests, we used general linear models to sharpen the focus on the specific activity rhythm variables contributing to these associations. Multivariate tests (F-statistic for Pillai’s trace statistic) evaluated the relationship between each activity rhythm parameter (Amplitude, Phi, and Mesor) and the pain, fatigue, mood, and physical impairment outcome variables. This approach tests the global multivariate null hypothesis of no differences and thus protects from multiple comparisons of individual outcomes.
To ease interpretation of the results, we relied on the boxplot-derived tripartite categorical variables described above for Activity, Phi, and Mesor. As further aids to interpretation, we report conventional univariate analyses of variance (ANOVA) with a priori contrasts for the clinical measures using the boxplot-derived parameter groupings. This division is a purely descriptive discretization of an unfamiliar continuous measure, and is not intended to imply any clinical thresholds. The “significance” of the ANOVA results should be regarded as furthering descriptive clarity, not as definitive inference. As our hypothesis was that patients with more disturbed rhythms will exhibit worse functionality, a priori contrasts were set for Amplitude and Phi. For Amplitude, we specifically hypothesized that patients with low Amplitude scores (LowA: <25th %ile) indicating poor rhythmicity will exhibit significantly worse symptoms as compared to those than with average Amplitude (AverageA: 25th–75th %ile) and high Amplitude (HighA: >75th %ile) scores. Similarly, ANOVA was used to evaluate the differences between Early Phi (Phi<25th %ile), Average Phi (Phi between 25th–75th %ile) and Late Phi (Phi>75th %ile). As clinical meaning for Mesor is difficult to ascertain, no a priori contrasts were defined and these associations are described in graphical forms for descriptive reasons only.
Exploratory analyses
As discussed above, this study did not include self-reported measures for sleep disturbances. Theoretically, the actigraphy-derived sleep measures are operationally independent of the activity rhythm parameters. Nonetheless, we chose to avoid any possibility of procedural measurement confounding, and omitted the actigraphy-derived sleep variables from primary analyses targeting the association between clinical and actigraphic rhythm parameters. As sleep problems are very significant in FMS, however, we did evaluate in exploratory analyses the relationships between actigraphy-derived sleep measure (i.e., total sleep time, sleep onset latency, and wake after sleep onset) with the actigraphy-derived rhythm variables (Amplitude, Phi, and Mesor). While exploratory, this allows us to better consider sleep itself in relationship to activity rhythms. The relationships between Set XR and Set S (actigraphy derived sleep measures of total sleep time and wake after sleep onset) were tested in a canonical relationship.
Results
Description of Activity Rhythms in FMS
Mean model fit for our cosine modeling (evaluated by the R2 values) was 0.39, indicating that 39% of the variance in the observed activity rhythms is explained by this simple cosine model across all individuals in the study. Evaluating frequency distributions of the activity rhythms variables in this sample of FMS patients (N=292) revealed a slight negative skew for Amplitude (i.e., measure of rhythmicity and robustness; mean Amplitude=0.77 and median Amplitude=0.81) and a slight positive skew for Phi (i.e., time of day of the average peak activity) Weekly Phi for this sample was 15.9 (SD=1.9, Range 11.9 – 22.2) indicating that weekly timing of high activity for the sample was at 3:54PM±1.9hr (Range 11:54AM – 10:12PM; Median Phi=15.7 or 3:42PM). Mesor (i.e., person’s mean level of activity over the entire week) exhibited an overall normal distribution (Mesor mean=1.6). Overall, these distributions suggest that the majority of patients have more rhythmic activity patterns (higher Amplitude values), but that there is a proportion of patients with very low amplitude. Intraclass correlations revealed high reliability for Amplitude (0.882), Phi (0.845), and Mesor (0.886). We observed moderate to strong bivariate relationships between Amplitude and Phi (r=−0.33, p<0.001) and a weak relationship between Amplitude and Mesor (r=−0.15, p<0.001). These results suggest that patients with a more delayed rhythm (higher Phi values) tended to have more attenuated activity rhythms (lower Amplitude).
Primary Aim Analyses
The primary aim evaluated the canonical relationship between clinical outcomes (Set Y) and all actigraphy-derived measures (Set X), which includes rhythm parameter estimates of Amplitude, Phi, and Mesor (Set XR) and the variability measures for Amplitude, Phi, and Mesor (Set XSE). The results show significant correlation between these set of variables (r=0.376, R2=0.14, Wilk’s Lambda=0.799, p<0.001) suggesting significant relationships between clinical outcomes with rhythm parameters and variability measures.
Null Hypotheses Testing of Factor independence
Table 4 describes results of independence comparisons adjusting for statistical control sets as defined above. Null Hypothesis 1 was rejected at p<.001: demographic variables (Set D) were not independent of the clinical measures. Null Hypothesis 2 was also rejected: Controlled for demographics, activity variability parameters (Set XSE) were not independent of clinical measures (Set Y) (p=.047). Finally, the key Null Hypothesis 3 was definitively rejected (p<.001): Controlled for both demographics (Set D) and day-to-day activity variability (Set XSE), the set of Amplitude, Phi, and Mesor activity parameters (Set XR) remained associated with clinical measures (p<.001). Operationally independent actigraphically extracted rhythm parameters provided unique information that correlated with clinical measures, even when controlled for demographic and temporal variability measures.
Table 4.
Covariance selection models and tests
| # | Null Hypotheses | Model | Deviance | df | df2-df1 | Chi Square Difference | p-Value |
|---|---|---|---|---|---|---|---|
| 1 | Y∐D | Full: YD | 0 | 0 | * | * | *a |
| Restricted: Y, D | 30.68 | 12 | 12 | 30.68 | 0.0001a | ||
| 2 | Y∐XSE|D | Full: Y XSED | 0 | 0 | * | * | *b |
| Restricted: YD, XSED | 21.23 | 12 | 12 | 21.23 | 0.047b | ||
| 3 | Y∐XR|D, XSE | Full: YXRXSED | 0 | 0 | * | * | *c |
| Restricted: YDXSE, DXSEXR | 36.24 | 12 | 12 | 36.24 | 0.0003c |
Testing whether Set D (demographic variables) is correlated with Set Y (clinical measures). The notation indicates removal of edges between Set D and Set Y in the restricted model.
Testing whether Set XSE (daily variability in actigraphy parameters) remains correlated with Set Y (clinical measures) after conditioning on Set D (demographics). The model notation indicates deletion of edges between Set XSE and Set Y in the restricted model.
Testing whether Set XR (Amplitude, Phi, and Mesor) remains correlated with Set Y (clinical measures) after conditioning on Set D (demographics) and Set XSE (daily variability in actigraphy parameters). The notation indicates deletion (“selection”) of edges between Set XR and Set Y in the restricted model.
The analyses also revealed that activity rhythm parameters provide unique information above and beyond the one provided by weekly activity level averages (chi square = 34.28, 12df, p=.0006). Descriptively, the addition of activity averages to the set of rhythm parameters is negligible (first canonical correlations with clinical measures of .376 and .381), while the addition of rhythm parameters to mean activity is substantial (first canonical correlations with clinical measures of .220 and .376).
Follow-up Analyses: Activity Rhythm Parameters and FMS Symptom
Multivariate test to further explore the relationship between the activity rhythms parameters (Amplitude, Phi, and Mesor) and the commonly co-occurring symptom of pain, fatigue, mood, and physical disability in patients with FMS revealed that each activity parameter provided unique discrimination of the clinical set (p=0.003, p=0.018, p=0.007 for Amplitude, Phi, and Mesor, respectively). These results generally revealed that better pain, fatigue, mood, and disability outcomes were associated with higher Amplitude and Mesor, and lower Phi (earlier peak activity).
As explained in Methods, we utilized the tripartite groups for Amplitude and Phi parameter, and examined clinical variation as a function of these groupings utilizing a priori contrasts in ANOVA. These findings are provided in Table 5 and expressed in plots provided in Figure 4. In general, patients with lower Amplitude (<25th %ile) and later peak of rhythm (Phi>75th %ile) exhibited worse clinical outcomes compared to the other patient groups. More specifically, patients in the Low Amplitude group (Amplitude between 0.11–0.66) as compared to Average Amplitude (Amplitude between 0.67–0.91) and High Amplitude (Amplitude between 0.92–1.17) reported significantly more fatigue, worse physical disability, and mood. Patients in the High Phi group (a trend to go to sleep later in the night and wake up later in the day; a Phi between 4:47PM–10:12PM) reported worse pain, mood, fatigue, and disability when compared with patients with an Average Phi (Phi between 2:51PM–4:46PM) or Low Phi (Phi between 11:54AM–2:50PM).
Table 5.
Total and group Means with Standard Deviations of clinical outcomes and sleep measures.
| Total Sample N = 292 |
Amplitude | Phi | ||||||||||||||
|---|---|---|---|---|---|---|---|---|---|---|---|---|---|---|---|---|
|
| ||||||||||||||||
| LowA n = 73 |
AverageA n = 146 |
HighA n = 73 |
a-priori contrast p-value | Early Phi n = 73 |
Average Phi n = 146 |
Late Phi n = 73 |
a-priori contrast p-value | |||||||||
|
|
|
|||||||||||||||
| Mean | SD | Mean | SD | Mean | SD | Mean | SD | Mean | SD | Mean | SD | Mean | SD | |||
|
| ||||||||||||||||
| MPI-Pain | 4 | 0.9 | 4.1 | 0.9 | 3.9 | 0.9 | 4 | 0.9 | 0.229 | 3.9 | 0.8 | 3.9 | 0.9 | 4.2 | 0.8 | 0.005 |
|
| ||||||||||||||||
| CESD Total | 26.1 | 10.9 | 27.9 | 11.1 | 26.3 | 10.6 | 23.7 | 11.1 | 0.055 | 24.4 | 10.7 | 25.3 | 10.9 | 29.3 | 10.5 | 0.003 |
|
| ||||||||||||||||
| MFI Total | 78.9 | 11.2 | 81.8 | 9.7 | 78.3 | 11.8 | 77.2 | 11.1 | 0.008 | 76.8 | 11.9 | 78.2 | 11.1 | 82.3 | 10 | 0.002 |
| Physical Fatigue | 17.3 | 2.7 | 18.1 | 2.2 | 17 | 2.8 | 17 | 2.8 | 0.006 | 17 | 3.2 | 17.2 | 2.6 | 17.7 | 2.5 | 0.088 |
| Reduced Activity | 15.2 | 3.9 | 16.3 | 3.1 | 15 | 3.9 | 14.4 | 4.3 | 0.003 | 14.5 | 4.2 | 14.7 | 3.8 | 16.8 | 3.2 | <0.001 |
| Reduced Motivation | 13.9 | 3.2 | 14.1 | 2.7 | 13.9 | 3.3 | 13.6 | 3.4 | 0.425 | 13.5 | 3.3 | 13.7 | 3.3 | 14.6 | 2.7 | 0.016 |
| Mental Fatigue | 14.1 | 3.5 | 14.7 | 3.2 | 14.1 | 3.6 | 13.6 | 3.5 | 0.058 | 13.6 | 3.4 | 14.2 | 3.6 | 14.6 | 3.2 | 0.149 |
|
| ||||||||||||||||
| FIQ-Functionality | 17 | 6.2 | 19 | 6 | 16.5 | 6.7 | 16.2 | 4.9 | 0.002 | 15.6 | 7 | 16.9 | 6.3 | 18.8 | 4.6 | 0.002 |
|
| ||||||||||||||||
| Sleep Efficiency (%) | 81.3 | 11.7 | 69.7 | 14.5 | 83.6 | 7.7 | 88.2 | 4.7 | <0.001 | 83.4 | 11 | 82.1 | 11.8 | 77.5 | 11.3 | 0.001 |
|
| ||||||||||||||||
| Total Sleep Time (min) | 459.1 | 88.4 | 396 | 105.9 | 471 | 75 | 498.3 | 56.5 | <0.001 | 464.8 | 94.3 | 462.8 | 82.9 | 445.8 | 92.9 | 0.14 |
|
| ||||||||||||||||
| Sleep Onset Latency (min) | 24.3 | 24.3 | 28.1 | 26 | 23.7 | 24.7 | 21.7 | 21.3 | 0.11 | 16.4 | 23.2 | 25.8 | 24.4 | 29.1 | 23.7 | 0.015 |
|
| ||||||||||||||||
| Wake After Sleep Onset (min) | 59.1 | 50 | 107.7 | 62.9 | 49 | 33.9 | 30.5 | 19.7 | <0.001 | 54.1 | 49.3 | 51.9 | 43.8 | 78.3 | 57.6 | <0.001 |
|
| ||||||||||||||||
| % Sleep during Up | 12 | 8.7 | 16 | 10.7 | 11.5 | 7.9 | 9 | 6.2 | <0.001 | 10.8 | 8.2 | 11.4 | 8.1 | 14.3 | 10 | 0.008 |
|
| ||||||||||||||||
| Activity Levels During Down | 27.8 | 14.3 | 40.8 | 17.2 | 25.9 | 10.5 | 18.8 | 6.6 | <0.001 | 24.9 | 12.3 | 27 | 14.7 | 32.4 | 14.3 | 0.001 |
|
| ||||||||||||||||
| Activity Levels During Up | 157.2 | 31.1 | 145 | 35.9 | 158.9 | 31.8 | 166 | 18.2 | <0.001 | 161.5 | 32.6 | 155.6 | 28.7 | 156 | 33.9 | 0.547 |
Figure 4.

Clinical outcome differences in mean standardized Z-scores between the Low, Medium, High categories (Low<25th %ile, Medium 25th–75th%ile, and High >75th%ile) of the activity rhythm parameters.
Activity Rhythms and Sleep Parameters
While exploratory, we evaluated the relationship between sleep parameters and the clinical outcomes. Canonical relationship revealed significant associations (r=0.273, R2=0.07, Wilk’s Lambda=0.914, p=0.014) between the set of sleep parameters (total sleep time, wake after sleep onset, and sleep onset latency) and the clinical measures (mood, fatigue, pain, and disability). Post-hoc ANOVA to further clarify these associations revealed that, in general, patients with lower Amplitude and with a higher Phi exhibited significantly worse sleep (Table 5). More specifically, patients with Low Amplitude exhibited significantly worse sleep efficiency, lower total sleep time during the night, more time spent awake during the night, more naps, more activity during the sleep period, and lower activity levels during the daytime. Patients with High Phi (or in other words a more delayed Phi) exhibited worse sleep efficiency, longer sleep onset latencies, spent more time awake during the night, had more naps, and higher activity levels in bed. Interestingly, there was no difference in total sleep time or average activity levels between the Phi groups (full results are provided in Table 5).
Discussion
This study is the first to describe activity rhythms/patterns rather than activity levels in patients with FMS and evaluate the relationship between rhythms and cardinal symptoms of FMS. The data suggest that diurnal activity rhythms have significant relationships with clinical presentation in FMS and that attenuated rhythms are associated with increased symptom severity. The results demonstrate significant and meaningful associations between activity rhythm parameters and clinical outcomes of pain, fatigue, mood, and physical disability over and beyond that which is accounted for by background variables (demographics) or temporal variabilities (day-to-day fluctuations).
It is important to clarify that attenuated activity rhythms do not indicate low activity levels. While these two measures are correlated, it is possible to observe relatively high activity counts during the day with overall attenuated activity rhythms. As illustrated in Figures 1, nearly identical timing of activity peak (Phi), Mesor (overall average activity levels), and average daytime activity showed significantly different Amplitude. While average activity levels were significantly related to clinical outcomes, the relationships between activity rhythms and clinical outcomes were significant while controlling for average activity levels and structural equation modeling suggested that the associations between activity rhythm and clinical outcomes were stronger than those seen with weekly activity averages alone.
Follow-up and exploratory analyses indicated that all activity rhythm parameters (Amplitude, Phi, and Mesor) were significant correlates of the clinical outcomes. As expressed in Figure 4, patients with the most attenuated rhythms suggested by low Amplitudes (<25th%ile) exhibited worse clinical outcomes of fatigue, physical disability, and mood. Amplitude was not significantly associated with pain and these results align with previous research showing relatively poor relationship between activity measures and pain, and stronger associations between activity measures and sleep, fatigue, and mood.[27; 28; 35; 37; 49] Nonetheless, individuals with most delayed rhythms indicated by higher levels of Phi (>75th%ile) reported worse mood, fatigue, physical disability, and pain with patients exhibiting more delayed Phi reporting more pain. Finally, our exploratory analyses revealed that patients with low Amplitude and late Phi experience significantly worse sleep in nearly all sleep parameters.
Past research in general populations and in chronic disease populations has demonstrated a link between dysregulation of activity rhythms and circadian rhythms.[4; 53; 59; 66] Circadian rhythms are controlled by the central circadian pacemaker located in the suprachiasmatic nucleus of the hypothalamus which bears influence on the hypothalamic-pituitary-adrenal-axis, which plays a significant role in chronic pain conditions.[12] Circadian dysfunction has been documented in multiple chronic conditions such as mood disorders, neurodegenerative disease, and cancer.[7; 32; 77] Studies evaluating biological markers of circadian rhythms in FMS, however, have yielded contradictory and inconclusive results.[16; 19; 25; 34; 36; 47; 60; 71; 75] While disruptive circadian rhythms are far from established in FMS, from a behavioral perspectives, the dysregulation of behavioral patterns could lead to disruption in functioning (e.g., changing sleep times, meal times, physical activity times, and lack of light exposure), which may further have significant impact on the clinical presentation of these patients. Future studies are necessary to better understand the relationship between activity rhythms, circadian rhythms, and symptom presentation of patients with FMS.
The finding that more delayed activity rhythms (i.e., later timing of average peak activity/Phi) were associated with greater severity of cardinal FMS symptoms, including pain, may be clinically meaningful. Research suggests that Phi is a measure of circadian timing and that delayed Phi is reflective of delayed sleep phase syndrome (DSPS).[4; 18; 79] DSPS occurs from a misalignment between the circadian system and the desired sleep-wake schedule.[78] Increased prevalence of phase delay is shown in various chronic disease population including dementia, [5; 72] cancer, [6] mood disorders, [2; 44] attention-deficit/hyperactivity disorder, [64] and obsessive-compulsive disorder, [52] and DSPS is associated with emotional disturbances, social difficulties, medical complications, and behavioral concerns.[63] Chronotherapy, which involves a re-alignment of the circadian system and sleep-wake schedule by means of bright-light therapy, pharmacotherapy, and behavioral change, has been very effective in the treatment of DSPS.[78] In FMS, chronotherapy (with bright-light) has yielded conflicting results. One study using older methodology showed no efficacy, [58] yet a recent modern study showed significant improvement in pain and functioning post morning bright-light treatment.[14] Treatments increasing physical activity have shown to decrease risk for pain[38; 39; 68] and decrease FMS symptoms.[43; 50] However, whether behavioral activation via exercise involves the re-regulation of activity patterns is not known. Behavioral treatments integrating a focus on activity rhythm regulation have shown to be effective for treating patients with mood disorders[21] and PTSD.[29] Thus, future studies may consider a multimodal approach that includes chronotherapy to regulate activity rhythms.
It is important to highlight that these results accounted for the day-to-day variability that exists in activity rhythm parameters. To our knowledge, this is the first study to evaluate the relationship between activity and clinical outcomes while controlling for behavioral activity variability in pain patients. Utilizing daily activity rhythm measures to quantify temporal variability can also indicate the degree of within-person precision, akin to the standard error of measurement for psychometric variables (with higher values indicating worse precision and more variability-less consistency-in activity patterns). Without this check, it is too easy to consider that an overall mean parameter computed over a few sample days in fact represents a trait, stable state, or another typical characteristic of an individual. Precise, consistent estimates are more likely to replicate and generalize than imprecise, inconsistent estimates.
The pattern of the associations between FMS symptoms and activity rhythm variables was remarkably consistent, although the associations with individual symptoms (except with sleep) were small-to-modest at best. To a certain degree, weak correlations were expected due to the highly variable nature of symptoms in FMS. Levels of fatigue are more variable in FMS compared to rheumatoid arthritis or osteoarthritis.[80] High variability of activity rhythms may reflect the daily struggle FMS patients commonly experience. Fluctuations in symptom severity may compel some patients to modify their activity levels. The ever-changing nature of behavioral response to symptom fluctuations may result in a dysregulated activity rhythm, which in turn may further impact overall symptoms of pain, sleep, fatigue, and mood. Nonetheless, the multivariate statistical approach utilized here allowed to account for the significant day-to-day activity variability. When utilizing this multivariate and highly conservative approach the analyses indicated a significant correlation 0.376 (R2=0.14) between actigraphy-derived activity rhythm parameters and clinical measures.
Study Limitations
Several significant limitations to this study need to be mentioned. First, activity data are often non-sinusoidal in shape, but rather better resembling a square wave. Thus, extended Fourier functions were proposed and these have shown to have better fit when compared to the simple cosine model utilized here. Poor model fit in our study is also partially attributed to the floor and ceiling effects of the actigraph itself and the method by which it tallies activity. While it is possible that another level of the Fourier decomposition could show a better fit, this type of investigation is beyond the scope of this current study. We utilized the simpler Fourier function to ease interpretation and simplify the description of the pattern by using Amplitude, Phi, and Mesor (all the available and independent outcome parameters from the cosine analyses) as opposed to the numerous variables yielded by more extended models (e.g., slope, Up-mesor, Down-mesor, width). We avoided assertions that the activity rhythms described in this study are biologically induced circadian rhythms, even though there is strong rationale for this relationship. While a late Phi may indicate a delayed acrophase and a delayed sleep phase, we use this data only to highlight the importance of activity rhythms, timing, and consistency.
Another concern is that the use of actigraphy-derived sleep measures may introduce artefactual dependencies since the activity rhythms parameters are also derived from actigraphy. Thus, we only included sleep parameters in a separate analysis. In the primary analyses, no sleep measures were included, and while this this is a drawback of the original study design (which did not include a subjective sleep measure), the analyses were most conservative. It is important to note that the assessment of symptoms was conducted prior to actigraphy assessment. As the questionnaires typically assess symptoms in the recent past, there is a mismatch between the time of actigraphy assessment and the time covered by the questionnaire assessment. While there is no reason to suggest that either questionnaire measures or activity rhythms would have varied significantly in this adjacent period of time, future studies may consider assessment at pre- and post-actigraph time points, as well as daily and within day assessment.
We are grateful to an anonymous reviewer who pointed out the subtle and not-so-subtle bias that language tends to produce. One particular bias we are at pains to avoid is that actigraphic objective measures are more “fundamental” than self-report. Either type of variable may cause the other, or some other sets of explanatory variables may cause both. From a cross-sectional design lacking strong theory, there is no way to know. Here, we have relied on statistical methods that require no temporal or causal priority assumptions at all.
Summary
The data from the present study provides preliminary supports for the potential role of behavioral activity rhythms in FMS symptoms. The results suggest that modification of dysfunctional rhythms may have clinical impact on FMS symptoms. Further studies are warranted to delineate the therapeutic role of such behavioral treatment for FMS.
Acknowledgments
Disclosure
The preparation of this manuscript was supported by the NIAMS grant (R01AR48888) to Akiko Okifuji. No other conflicts of interest for the authors.
The preparation of this manuscript was supported by the NIAMS grant (R01AR48888) to Akiko Okifuji.
References
- 1.IBM Corp. IBM SPSS Statistics for Mac, Version 22.0. Armonk, NY: IBM Corp; Released 2013. [Google Scholar]
- 2.Ahn YM, Chang J, Joo YH, Kim SC, Lee KY, Kim YS. Chronotype distribution in bipolar I disorder and schizophrenia in a Korean sample. Bipolar disorders. 2008;10(2):271–275. doi: 10.1111/j.1399-5618.2007.00573.x. [DOI] [PubMed] [Google Scholar]
- 3.Ancoli-Israel S, Clopton P, Klauber MR, Fell R, Mason W. Use of wrist activity for monitoring sleep/wake in demented nursing-home patients. Sleep. 1997;20(1):24. doi: 10.1093/sleep/20.1.24. [DOI] [PMC free article] [PubMed] [Google Scholar]
- 4.Ancoli-Israel S, Cole R, Alessi C, Chambers M, Moorcroft W, Pollak C. The role of actigraphy in the study of sleep and circadian rhythms. American Academy of Sleep Medicine Review Paper. Sleep. 2003;26(3):342–392. doi: 10.1093/sleep/26.3.342. [DOI] [PubMed] [Google Scholar]
- 5.Ancoli-Israel S, Klauber MR, Jones DW, Kripke DF, Martin J, Mason W, Pat-Horenczyk R, Fell R. Variations in circadian rhythms of activity, sleep, and light exposure related to dementia in nursing-home patients. Sleep. 1997;20(1):18–23. [PubMed] [Google Scholar]
- 6.Ancoli-Israel S, Liu L, Marler MR, Parker BA, Jones V, Sadler GR, Dimsdale J, Cohen-Zion M, Fiorentino L. Fatigue, sleep, and circadian rhythms prior to chemotherapy for breast cancer. Supportive Care in Cancer. 2006;14(3):201–209. doi: 10.1007/s00520-005-0861-0. [DOI] [PMC free article] [PubMed] [Google Scholar]
- 7.Ancoli-Israel S, Liu L, Rissling M, Natarajan L, Neikrug AB, Palmer BW, Mills PJ, Parker BA, Sadler GR, Maglione J. Sleep, fatigue, depression, and circadian activity rhythms in women with breast cancer before and after treatment: a 1-year longitudinal study. Supportive Care in Cancer. 2014;22(9):2535–2545. doi: 10.1007/s00520-014-2204-5. [DOI] [PMC free article] [PubMed] [Google Scholar]
- 8.Baird A, Coogan A, Siddiqui A, Donev R, Thome J. Adult attention-deficit hyperactivity disorder is associated with alterations in circadian rhythms at the behavioural, endocrine and molecular levels. Molecular psychiatry. 2012;17(10):988–995. doi: 10.1038/mp.2011.149. [DOI] [PubMed] [Google Scholar]
- 9.Bastien CH, Vallières A, Morin CM. Validation of the Insomnia Severity Index as an outcome measure for insomnia research. Sleep medicine. 2001;2(4):297–307. doi: 10.1016/s1389-9457(00)00065-4. [DOI] [PubMed] [Google Scholar]
- 10.Bigatti SM, Hernandez AM, Cronan TA, Rand KL. Sleep disturbances in fibromyalgia syndrome: relationship to pain and depression. Arthritis Care & Research. 2008;59(7):961–967. doi: 10.1002/art.23828. [DOI] [PMC free article] [PubMed] [Google Scholar]
- 11.Blackwell T, Ancoli-Isael S, Gehrman PR, Schneider JL, Pedula KL, Stone KL. Actigraphy scoring reliability in the study of osteoporotic fractures. SLEEP-NEW YORK THEN WESTCHESTER. 2005;28(12):1599. doi: 10.1093/sleep/28.12.1599. [DOI] [PubMed] [Google Scholar]
- 12.Buckley TM, Schatzberg AF. On the interactions of the hypothalamic-pituitary-adrenal (HPA) axis and sleep: normal HPA axis activity and circadian rhythm, exemplary sleep disorders. The Journal of Clinical Endocrinology & Metabolism. 2005;90(5):3106–3114. doi: 10.1210/jc.2004-1056. [DOI] [PubMed] [Google Scholar]
- 13.Burckhardt CS, Clark SR, Bennett RM. The fibromyalgia impact questionnaire: development and validation. J rheumatol. 1991;18(5):728–733. [PubMed] [Google Scholar]
- 14.Burgess HJ, Park M, Ong JC, Shakoor J, Williams DA, Burns J. Morning Versus Evening Bright Light Treatment At Home To Improve Function and Pain Sensitivity for Women with Fibromyalgia: A Pilot Study. Sleep medicine. 2016 doi: 10.1093/pm/pnw160. Accepted. [DOI] [PubMed] [Google Scholar]
- 15.Chesson M, Jr, Coleman M, Lee-Chiong M, Pancer D. Practice parameters for the use of actigraphy in the assessment of sleep and sleep disorders: an update for 2007. Sleep. 2007;30(4):519. doi: 10.1093/sleep/30.4.519. [DOI] [PubMed] [Google Scholar]
- 16.Citera G, Arias M, Maldonado-Cocco J, La M, Rosemffet M, Brusco L, Scheines E, Cardinalli D. The effect of melatonin in patients with fibromyalgia: a pilot study. Clinical rheumatology. 2000;19(1):9–13. doi: 10.1007/s100670050003. [DOI] [PubMed] [Google Scholar]
- 17.Clauw DJ. Fibromyalgia: a clinical review. JAMA. 2014;311(15):1547–1555. doi: 10.1001/jama.2014.3266. [DOI] [PubMed] [Google Scholar]
- 18.Cole RJ, Smith JS, Alcal YC, Elliott JA, Kripke DF. Bright-light mask treatment of delayed sleep phase syndrome. Journal of Biological Rhythms. 2002;17(1):89–101. doi: 10.1177/074873002129002366. [DOI] [PubMed] [Google Scholar]
- 19.Crofford LJ, Pillemer SR, Kalogeras KT, Cash JM, Michelson D, Kling MA, Sternberg EM, Gold PW, Chrousos GP, Wilder RL. Hypothalamic–pituitary–adrenal axis perturbations in patients with fibromyalgia. Arthritis & Rheumatism. 1994;37(11):1583–1592. doi: 10.1002/art.1780371105. [DOI] [PubMed] [Google Scholar]
- 20.Dempster AP. Covariance selection. Biometrics. 1972:157–175. [Google Scholar]
- 21.Ehlers CL, Kupfer DJ, Frank E, Monk TH. Biological rhythms and depression: the role of zeitgebers and zeitstorers. Depression. 1993;1(6):285–293. [Google Scholar]
- 22.First MB, Spitzer RL, Gibbon M, Williams JB. User’s guide for the Structured clinical interview for DSM-IV axis I disorders SCID-I: clinician version. American Psychiatric Pub; 1997. [Google Scholar]
- 23.Fischer S, Doerr JM, Strahler J, Mewes R, Thieme K, Nater UM. Stress exacerbates pain in the everyday lives of women with fibromyalgia syndrome—The role of cortisol and alpha-amylase. Psychoneuroendocrinology. 2016;63:68–77. doi: 10.1016/j.psyneuen.2015.09.018. [DOI] [PubMed] [Google Scholar]
- 24.Fontaine KR, Haaz S. Effects of lifestyle physical activity on health status, pain, and function in adults with fibromyalgia syndrome. Journal of Musculoskeletal Pain. 2007;15(1):3–9. [Google Scholar]
- 25.Geiss A, Rohleder N, Anton F. Does a disturbed HPA axis function require enhanced IL-6 levels? Evidence from a psychoneuroimmunological study in fibromyalgia patients. Brain, Behavior, and Immunity. 2006;20(3):23–24. [Google Scholar]
- 26.Gormsen L, Rosenberg R, Bach FW, Jensen TS. Depression, anxiety, health-related quality of life and pain in patients with chronic fibromyalgia and neuropathic pain. European Journal of Pain. 2010;14(2):127. e121–127. e128. doi: 10.1016/j.ejpain.2009.03.010. [DOI] [PubMed] [Google Scholar]
- 27.Grossman P, Deuring G, Walach H, Schwarzer B, Schmidt S. Mindfulness-based Intervention does not Influence Cardiac Autonomic Control or Pattern of Physical Activity in Fibromyalgia During Daily Life: An Ambulatory, Multi-measure Randomized Controlled Trial*. The Clinical Journal of Pain. 2016 doi: 10.1097/AJP.0000000000000420. [DOI] [PubMed] [Google Scholar]
- 28.Hartescu I, Morgan K, Stevinson CD. Increased physical activity improves sleep and mood outcomes in inactive people with insomnia: a randomized controlled trial. Journal of sleep research. 2015;24(5):526–534. doi: 10.1111/jsr.12297. [DOI] [PubMed] [Google Scholar]
- 29.Haynes PL, Kelly M, Warner L, Quan SF, Krakow B, Bootzin RR. Cognitive Behavioral Social Rhythm Group Therapy for Veterans with posttraumatic stress disorder, depression, and sleep disturbance: Results from an open trial. Journal of affective disorders. 2016;192:234–243. doi: 10.1016/j.jad.2015.12.012. [DOI] [PubMed] [Google Scholar]
- 30.Hazlett RL, Haynes SN. Fibromyalgia: a time-series analysis of the stressor-physical symptom association. Journal of behavioral medicine. 1992;15(6):541–558. doi: 10.1007/BF00844855. [DOI] [PubMed] [Google Scholar]
- 31.Jensen MP, Turner JA, Romano JM. Self-efficacy and outcome expectancies: relationship to chronic pain coping strategies and adjustment. Pain. 1991;44(3):263–269. doi: 10.1016/0304-3959(91)90095-F. [DOI] [PubMed] [Google Scholar]
- 32.Jones SH, Hare DJ, Evershed K. Actigraphic assessment of circadian activity and sleep patterns in bipolar disorder. Bipolar disorders. 2005;7(2):176–186. doi: 10.1111/j.1399-5618.2005.00187.x. [DOI] [PubMed] [Google Scholar]
- 33.Kerns RD, Turk DC, Rudy TE. The west haven-yale multidimensional pain inventory (WHYMPI) Pain. 1985;23(4):345–356. doi: 10.1016/0304-3959(85)90004-1. [DOI] [PubMed] [Google Scholar]
- 34.Klerman EB, Goldenberg DL, Brown EN, Maliszewski AM, Adler GK. Circadian Rhythms of Women with Fibromyalgia 1. The Journal of Clinical Endocrinology & Metabolism. 2001;86(3):1034–1039. doi: 10.1210/jcem.86.3.7293. [DOI] [PubMed] [Google Scholar]
- 35.Kop WJ, Lyden A, Berlin AA, Ambrose K, Olsen C, Gracely RH, Williams DA, Clauw DJ. Ambulatory monitoring of physical activity and symptoms in fibromyalgia and chronic fatigue syndrome. Arthritis & Rheumatism. 2005;52(1):296–303. doi: 10.1002/art.20779. [DOI] [PubMed] [Google Scholar]
- 36.Korszun A, Sackett-Lundeen L, Papadopoulos E, Brucksch C, Masterson L, Engelberg N, Haus E, Demitrack M, Crofford L. Melatonin levels in women with fibromyalgia and chronic fatigue syndrome. The Journal of rheumatology. 1999;26(12):2675–2680. [PubMed] [Google Scholar]
- 37.Korszun A, Young EA, Engleberg NC, Brucksch CB, Greden JF, Crofford LA. Use of actigraphy for monitoring sleep and activity levels in patients with fibromyalgia and depression. Journal of psychosomatic research. 2002;52(6):439–443. doi: 10.1016/s0022-3999(01)00237-9. [DOI] [PubMed] [Google Scholar]
- 38.Landmark T, Romundstad P, Borchgrevink PC, Kaasa S, Dale O. Associations between recreational exercise and chronic pain in the general population: evidence from the HUNT 3 study. PAIN®. 2011;152(10):2241–2247. doi: 10.1016/j.pain.2011.04.029. [DOI] [PubMed] [Google Scholar]
- 39.Landmark T, Romundstad PR, Borchgrevink PC, Kaasa S, Dale O. Longitudinal Associations between Exercise and Pain in the General Population-The HUNT Pain Study. PloS one. 2013;8(6):e65279. doi: 10.1371/journal.pone.0065279. [DOI] [PMC free article] [PubMed] [Google Scholar]
- 40.Lauritzen SL. Graphical models. Vol. 17. Clarendon Press; 1996. [Google Scholar]
- 41.Littner M, Hirshkowitz M, Kramer M, Kapen S, Anderson W, Bailey D, Berry R, Davila D, Johnson S, Kushida C. Practice parameters for using polysomnography to evaluate insomnia: an update. Sleep. 2003;26(6):754. doi: 10.1093/sleep/26.6.754. [DOI] [PubMed] [Google Scholar]
- 42.Lukkahatai N, Walitt B, Espina A, Gelio A, Saligan LN. Understanding the Association of Fatigue With Other Symptoms of Fibromyalgia: Development of a Cluster Model. Arthritis care & research. 2016;68(1):99–107. doi: 10.1002/acr.22626. [DOI] [PMC free article] [PubMed] [Google Scholar]
- 43.Mannerkorpi K, Iversen MD. Physical exercise in fibromyalgia and related syndromes. Best Practice & Research Clinical Rheumatology. 2003;17(4):629–647. doi: 10.1016/s1521-6942(03)00038-x. [DOI] [PubMed] [Google Scholar]
- 44.Mansour HA, Wood J, Chowdari KV, Dayal M, Thase ME, Kupfer DJ, Monk TH, Devlin B, Nimgaonkar VL. Circadian phase variation in bipolar I disorder. Chronobiology international. 2005;22(3):571–584. doi: 10.1081/CBI-200062413. [DOI] [PubMed] [Google Scholar]
- 45.Marler MR, Gehrman P, Martin JL, Ancoli-Israel S. The sigmoidally transformed cosine curve: a mathematical model for circadian rhythms with symmetric non-sinusoidal shapes. Statistics in medicine. 2006;25(22):3893–3904. doi: 10.1002/sim.2466. [DOI] [PubMed] [Google Scholar]
- 46.Martin JL, Jeste DV, Ancoli-Israel S. Older schizophrenia patients have more disrupted sleep and circadian rhythms than age-matched comparison subjects. Journal of psychiatric research. 2005;39(3):251–259. doi: 10.1016/j.jpsychires.2004.08.011. [DOI] [PubMed] [Google Scholar]
- 47.McCain G, Tilbe K. Diurnal hormone variation in fibromyalgia syndrome: a comparison with rheumatoid arthritis. The Journal of rheumatology Supplement. 1989;19:154–157. [PubMed] [Google Scholar]
- 48.Mcloughlin MJ, Colbert LH, Stegner AJ, Cook DB. Are women with fibromyalgia less physically active than healthy women? Medicine and science in sports and exercise. 2011;43(5):905. doi: 10.1249/MSS.0b013e3181fca1ea. [DOI] [PMC free article] [PubMed] [Google Scholar]
- 49.Minton O, Stone PC. A comparison of cognitive function, sleep and activity levels in disease-free breast cancer patients with or without cancer-related fatigue syndrome. BMJ supportive & palliative care. 2012 doi: 10.1136/bmjspcare-2011-000172. bmjspcare-2011–000172. [DOI] [PMC free article] [PubMed] [Google Scholar]
- 50.Mior S. Exercise in the treatment of chronic pain. The Clinical journal of pain. 2001;17(4):S77–S85. doi: 10.1097/00002508-200112001-00016. [DOI] [PubMed] [Google Scholar]
- 51.Miró E, Martínez MP, Sánchez AI, Prados G, Medina A. When is pain related to emotional distress and daily functioning in fibromyalgia syndrome? The mediating roles of self-efficacy and sleep quality. British journal of health psychology. 2011;16(4):799–814. doi: 10.1111/j.2044-8287.2011.02016.x. [DOI] [PubMed] [Google Scholar]
- 52.Mukhopadhyay S, Fineberg NA, Drummond LM, Turner J, White S, Wulff K, Ghodse H. Delayed sleep phase in severe obsessive-compulsive disorder: a systematic case-report survey. CNS spectrums. 2008;13(05):406–413. doi: 10.1017/s1092852900016576. [DOI] [PubMed] [Google Scholar]
- 53.Neikrug AB, Rissling M, Trofimenko V, Liu L, Natarajan L, Lawton S, Parker BA, Ancoli-Israel S. Bright light therapy protects women from circadian rhythm desynchronization during chemotherapy for breast cancer. Behavioral sleep medicine. 2012;10(3):202–216. doi: 10.1080/15402002.2011.634940. [DOI] [PubMed] [Google Scholar]
- 54.Okifuji A, Bradshaw DH, Donaldson GW, Turk DC. Sequential analyses of daily symptoms in women with fibromyalgia syndrome. The Journal of Pain. 2011;12(1):84–93. doi: 10.1016/j.jpain.2010.05.003. [DOI] [PMC free article] [PubMed] [Google Scholar]
- 55.Okifuji A, Donaldson GW, Barck L, Fine PG. Relationship between fibromyalgia and obesity in pain, function, mood, and sleep. The Journal of Pain. 2010;11(12):1329–1337. doi: 10.1016/j.jpain.2010.03.006. [DOI] [PMC free article] [PubMed] [Google Scholar]
- 56.Paudel ML, Taylor BC, Ancoli-Israel S, Blackwell T, Stone KL, Tranah G, Redline S, Cummings SR, Ensrud KE. Rest/activity rhythms and mortality rates in older men: MrOS Sleep Study. Chronobiology international. 2010;27(2):363–377. doi: 10.3109/07420520903419157. [DOI] [PMC free article] [PubMed] [Google Scholar]
- 57.Paudel ML, Taylor BC, Ancoli-Israel S, Stone KL, Tranah G, Redline S, Barrett-Connor E, Stefanick ML, Ensrud KE. Rest/activity rhythms and cardiovascular disease in older men. Chronobiology international. 2011;28(3):258–266. doi: 10.3109/07420528.2011.553016. [DOI] [PMC free article] [PubMed] [Google Scholar]
- 58.Pearl S, Lue F, MacLean A, Heslegrave R, Reynolds W, Moldofsky H. The effects of bright light treatment on the symptoms of fibromyalgia. The Journal of rheumatology. 1996;23(5):896–902. [PubMed] [Google Scholar]
- 59.Pollak CP, Tryon WW, Nagaraja H, Dzwonczyk R. How accurately does wrist actigraphy identify the states of sleep and wakefulness? SLEEP-NEW YORK. 2001;24(8):957–965. doi: 10.1093/sleep/24.8.957. [DOI] [PubMed] [Google Scholar]
- 60.Press J, Phillip M, Neumann L, Barak R, Segev Y, Abu-Shakra M, Buskila D. Normal melatonin levels in patients with fibromyalgia syndrome. The Journal of rheumatology. 1998;25(3):551–555. [PubMed] [Google Scholar]
- 61.Puetz TW, O’Connor PJ, Dishman RK. Effects of chronic exercise on feelings of energy and fatigue: a quantitative synthesis. Psychological bulletin. 2006;132(6):866. doi: 10.1037/0033-2909.132.6.866. [DOI] [PubMed] [Google Scholar]
- 62.Radloff LS. The CES-D scale a self-report depression scale for research in the general population. Applied psychological measurement. 1977;1(3):385–401. [Google Scholar]
- 63.Regestein QR, Monk TH. Delayed sleep phase syndrome: a review of its clinical aspects. The American journal of psychiatry. 1995;152(4):602. doi: 10.1176/ajp.152.4.602. [DOI] [PubMed] [Google Scholar]
- 64.Rybak YE, McNeely HE, Mackenzie BE, Jain UR, Levitan RD. Seasonality and circadian preference in adult attention-deficit/hyperactivity disorder: clinical and neuropsychological correlates. Comprehensive psychiatry. 2007;48(6):562–571. doi: 10.1016/j.comppsych.2007.05.008. [DOI] [PubMed] [Google Scholar]
- 65.Sadeh A, Alster J, Urbach D, Lavie P. Actigraphically based automatic bedtime sleep-wake scoring: validity and clinical applications. Journal of Ambulatory Monitoring. 1989;2(3):209–216. [Google Scholar]
- 66.Savard J, Liu L, Natarajan L, Rissling MB, Neikrug AB, He F, Dimsdale JE, Mills PJ, Parker BA, Sadler GR. Breast cancer patients have progressively impaired sleep-wake activity rhythms during chemotherapy. Sleep. 2009;32(9):1155–1160. doi: 10.1093/sleep/32.9.1155. [DOI] [PMC free article] [PubMed] [Google Scholar]
- 67.Segura-Jimenez V, Munguia-Izquierdo D, Camiletti-Moiron D, Alvarez-Gallardo I, Ortega F, Ruiz J, Delgado-Fernandez M. Comparison of the International Physical Activity Questionnaire (IPAQ) with a multi-sensor armband accelerometer in women with fibromyalgia: The al-Andalus project. Clin Exp Rheumatol. 2013;31(6 Suppl 79):S94–101. [PubMed] [Google Scholar]
- 68.Sluka KA, O’Donnell JM, Danielson J, Rasmussen LA. Regular physical activity prevents development of chronic pain and activation of central neurons. Journal of Applied Physiology. 2013;114(6):725–733. doi: 10.1152/japplphysiol.01317.2012. [DOI] [PMC free article] [PubMed] [Google Scholar]
- 69.Smets E, Garssen B, Bonke Bd, De Haes J. The Multidimensional Fatigue Inventory (MFI) psychometric qualities of an instrument to assess fatigue. Journal of psychosomatic research. 1995;39(3):315–325. doi: 10.1016/0022-3999(94)00125-o. [DOI] [PubMed] [Google Scholar]
- 70.Thieme K, Turk DC, Flor H. Comorbid depression and anxiety in fibromyalgia syndrome: relationship to somatic and psychosocial variables. Psychosomatic medicine. 2004;66(6):837–844. doi: 10.1097/01.psy.0000146329.63158.40. [DOI] [PubMed] [Google Scholar]
- 71.Torpy DJ, Papanicolaou DA, Lotsikas AJ, Wilder RL, Chrousos GP, Pillemer SR. Responses of the sympathetic nervous system and the hypothalamic-pituitary-adrenal axis to interleukin-6. Arthritis Rheum. 2000;43(4):872–880. doi: 10.1002/1529-0131(200004)43:4<872::AID-ANR19>3.0.CO;2-T. [DOI] [PubMed] [Google Scholar]
- 72.Tranah GJ, Blackwell T, Stone KL, Ancoli-Israel S, Paudel ML, Ensrud KE, Cauley JA, Redline S, Hillier TA, Cummings SR. Circadian activity rhythms and risk of incident dementia and mild cognitive impairment in older women. Annals of neurology. 2011;70(5):722–732. doi: 10.1002/ana.22468. [DOI] [PMC free article] [PubMed] [Google Scholar]
- 73.Turk DC, Okifuji A, Sinclair JD, Starz TW. Pain, disability, and physical functioning in subgroups of patients with fibromyalgia. The Journal of rheumatology. 1996;23(7):1255–1262. [PubMed] [Google Scholar]
- 74.Vitiello MV, Rybarczyk B, Von Korff M, Stepanski EJ. Cognitive behavioral therapy for insomnia improves sleep and decreases pain in older adults with co-morbid insomnia and osteoarthritis. J Clin Sleep Med. 2009;5(4):355–362. [PMC free article] [PubMed] [Google Scholar]
- 75.Wikner J, Hirsch U, Wetterberg L, Röjdmark S. Fibromyalgia—a syndrome associated with decreased nocturnal melatonin secretion. Clinical endocrinology. 1998;49(2):179–183. doi: 10.1046/j.1365-2265.1998.00503.x. [DOI] [PubMed] [Google Scholar]
- 76.Wolfe F, Rasker JJ. The Symptom Intensity Scale, fibromyalgia, and the meaning of fibromyalgia-like symptoms. The Journal of rheumatology. 2006;33(11):2291–2299. [PubMed] [Google Scholar]
- 77.Wulff K, Gatti S, Wettstein JG, Foster RG. Sleep and circadian rhythm disruption in psychiatric and neurodegenerative disease. Nature Reviews Neuroscience. 2010;11(8):589–599. doi: 10.1038/nrn2868. [DOI] [PubMed] [Google Scholar]
- 78.Wyatt JK. Delayed sleep phase syndrome: pathophysiology and treatment options. Sleep. 2004;27(6):1195–1203. doi: 10.1093/sleep/27.6.1195. [DOI] [PubMed] [Google Scholar]
- 79.Youngstedt SD, Kripke DF, Elliott JA, Klauber MR. Circadian abnormalities in older adults. Journal of pineal research. 2001;31(3):264–272. doi: 10.1034/j.1600-079x.2001.310311.x. [DOI] [PubMed] [Google Scholar]
- 80.Zautra AJ, Fasman R, Parish BP, Davis MC. Daily fatigue in women with osteoarthritis, rheumatoid arthritis, and fibromyalgia. Pain. 2007;128(1):128–135. doi: 10.1016/j.pain.2006.09.004. [DOI] [PubMed] [Google Scholar]