

Abstract
Whereas the stress-inducible heat-shock protein 70 (Hsp70) has gained plenty of attention as a putative target for tumor therapy, little is known about the role of other Hsp70 proteins in cancer. Here we present the first thorough analysis of the expression and function of the cytosolic Hsp70 proteins in human cancer cells and identify Hsp70-2, a protein essential for spermatogenesis, as an important regulator of cancer cell growth. Targeted knock-down of the individual family members by RNA interference revealed that both Hsp70 and Hsp70-2 were required for cancer cell growth, whereas the survival of tumorigenic as well as nontumorigenic cells depended on Hsc70. Cancer cells depleted for Hsp70 and Hsp70-2 displayed strikingly different morphologies (detached and round vs. flat senescent-like), cell cycle distributions (G2/M vs. G1 arrest) and gene expression profiles. Only Hsp70-2 depletion induced the expression of macrophage inhibitory cytokine-1 that was identified as a target of P53 tumor-suppressor protein and a mediator of the G1 arrest and the senescent phenotype. Importantly, concomitant depletion of Hsp70 and Hsp70-2 had a synergistic antiproliferative effect on cancer cells. Thus, highly homologous Hsp70 proteins bring about nonoverlapping functions essential for cell growth and survival.
Keywords: Heat-shock proteins 70, macrophage inhibitory cytokine-1, neoplasms, senescence, RNA interference, microarray
Heat-shock proteins (Hsps, stress proteins) are a group of evolutionarily highly conserved chaperone proteins (for review, see Lindquist and Craig 1988). The Hsp superfamily includes several different molecular weight class families of which the Hsp70 family represents the most highly conserved Hsps with functional counterparts in the most primitive of bacteria and the most sophisticated of higher organisms (Hunt and Morimoto 1985). Hsp70 proteins function as ATP-dependent molecular chaperones that assist the folding of newly synthesized polypeptides, the assembly of multiprotein complexes, transport of proteins across cellular membranes, and targeting of proteins for lysosomal degradation (for review, see McKay 1993; Bukau and Horwich 1998). Stress-induced accumulation of Hsp70s accelerates the cellular recovery by enhancing the ability of stressed cells to cope with increased concentrations of unfolded/denatured proteins (Pelham 1984; Nollen et al. 1999). The human Hsp70 family consists of at least eight highly homologous members that differ from each other by the intracellular localization and expression pattern (for review, see Tavaria et al. 1996). The localization of Bip (also known as Hsp70-5 or Grp78) and mtHsp70 (Grp75, Hsp70-9, or mortalin) is confined to the lumen of the endoplasmic reticulum and the mitochondrial matrix, respectively, whereas the remaining six Hsp70 proteins (Table 1) reside mainly in the cytosol, suggesting that they either display specificity for their client proteins or serve chaperone-independent particular functions. Hsc70 (Hsp70-8 or Hsp73) is the only cytosolic Hsp70 protein that is abundantly and ubiquitously expressed in all cells, whereas Hsp70t (Hsp70-Hom or Hsp701L) and Hsp70-2 (HspA2) are expressed at high levels in testis and at considerably lower or nondetectable levels in other tissues (Son et al. 1999; Fourie et al. 2001). Hsp70-1A and Hsp70-1B are encoded by almost identical intronless genes and are here collectively referred to as Hsp70 (Hsp72 or iHsp70). Hsp70 is expressed only at low or undetectable levels in most unstressed normal cells and tissues, but its expression is rapidly induced by a variety of physical and chemical stresses, and therefore it is often called the major stress-inducible Hsp70. Finally, Hsp70-6 (Hsp70B′) represents a poorly studied intronless member of the family that shows almost no basal expression and is induced only by extreme stresses (Leung et al. 1990).
Table 1.
Cytosolic members of the Hsp70 chaperone family
| Locus | Position | Amino acid homology to Hsp70a | Homology to Ad.asHsp70b | Protein namec | Alternative names |
|---|---|---|---|---|---|
| HSPA1A | 6p21.3 | 100% | 99.4% | Hsp70 | Hsp72, Hsp70-1a |
| HSPA1B | 6p21.3 | 99% | 100% | Hsp70 | Hsp72, Hsp70-1b |
| HSPA1L | 6p21.3 | 91% | 81.2% | Hsp70t | Hsp70-Hom |
| HSPA8 | 11q23.3-q25 | 86% | 71.0% | Hsc70 | Hsp73, Hsp70-8 |
| HSPA2 | 14q24.1 | 84% | 84.1% | Hsp70-2 | HspA2, Hsp70-3 |
| HSPA6 | 1cen-qter | 84% | 81.9% | Hsp70-6 | Hsp70B′ |
Percent amino acid homology to the Hsp70 protein coded by HSP1A.
Percent DNA homology to the 321-bp sequence present in Ad.asHsp70.
Name of the protein used in this paper.
A long line of experimental evidence positions Hsp70 as a cancer-relevant survival protein. Hsp70 is abundantly expressed in malignant tumors of various origins (for review, see Jäättelä 1999), and its expression correlates with increased cell proliferation, poor differentiation, lymph node metastases, and poor therapeutic out-come in human breast cancer (Ciocca et al. 1993; Lazaris et al. 1997; Vargas-Roig et al. 1997, 1998). Furthermore, numerous experimental cancer models have demonstrated the tumorigenic potential of Hsp70 in rodents (Jäättelä 1995; Seo et al. 1996; Volloch and Sherman 1999; Gurbuxani et al. 2001). In support of the hypothesis that Hsp70 promotes tumorigenesis via its pro-survival function, it can effectively inhibit cell death induced by a wide range of stimuli including several cancer-related stresses like hypoxia, inflammatory cytokines, monocytes, irradiation, oxidative stress, and anticancer drugs (Jäättelä et al. 1992, 1998; Jäättelä and Wissing 1993; Simon et al. 1995; Mosser et al. 1997; Buzzard et al. 1998; Vayssier et al. 1998; Nylandsted et al. 2004). Furthermore, the depletion of Hsp70 by antisense oligonucleotides or adenoviral transfer of antisense cDNA selectively kills cancer cells not only in cell culture but also in various orthotopic tumor xenografts in mice (Wei et al. 1995; Kaur and Ralhan 2000; Nylandsted et al. 2000, 2002).
Hsp70-2 has been assigned a particular function in male germ cells. Hsp70-2 is essential for the formation of the active CDC2/cyclinB complex during the metaphase of the first meiotic division of male germ cells (Zhu et al. 1997). Accordingly, male mice deficient for Hsp70-2 are sterile due to a failure of spermatocytes to proceed through the first meiotic division and increased spermatocyte apoptosis (Dix et al. 1996), and a decreased level of Hsp70-2 mRNA in human testis has been associated with abnormal spermatogenesis and sterility (Son et al. 2000). Neither the expression levels nor the function of Hsp70-2 in tumors have been reported.
Considering that at least six different, although very homologous, Hsp70 species potentially coexist in the cytosol, it is remarkable that practically nothing has been done to distinguish the roles of these proteins. The aims of this study were to determine the expression levels of all cytosolic Hsp70s in nontumorigenic and tumorigenic cells and to define their putative functions in the regulation of cell growth and survival. In order to perform molecular and functional analysis of cells selectively depleted for individual Hsp70 family members, we took advantage of the RNA interference (RNAi) technology. Prompted by our data showing that Hsp70-2 expression was dramatically elevated in a subset of human breast cancer samples and that its depletion triggered a striking antiproliferative response specific to cancer cells, we studied this response in molecular detail by using DNA microarray analysis. The data obtained demonstrate that Hsp70-2 promotes tumor cell growth by a mechanism clearly distinct from other Hsp70 proteins.
Results
Hsp70-2 expression is elevated in human breast cancer tissue
Whereas the ubiquitously expressed Hsc70 and the stress-inducible Hsp70 are highly expressed in cancers of various origins, very little is known about the expression levels of the other cytosolic Hsp70 family members in human cancer. Due to the lack of antibodies specific enough to differentiate the closely related Hsp70 proteins, we first determined the expression levels of the six cytosolic members of the Hsp70 family by semiquantitative RT-PCR in cell lines originating from carcinomas of cervix (HeLa), mammary gland (MCF-7 and MDA-MD-468), prostate (PC-3), colon (LoVo-36), and liver (HuH-7), as well as in immortalized but nontumorigenic mammary (MCF-10A and HBL-100) and prostate (PNT1A) epithelial cells (Fig. 1A). As expected, very high amounts of Hsc70 (HSPA8) mRNA, and moderate to high amounts of one or both of the major stress-inducible Hsp70 mRNAs that are encoded by two almost identical genes, HSPA1A and HSPA1B, were found in all cell lines tested. Also Hsp70-2 (HSPA2), a testis-associated family member, was expressed at moderate levels in eight of the nine cell lines tested. The expression of the other testis-associated member of the family, Hsp70t (HSPA1L), and the strictly heat-inducible Hsp70-6 (HSPA6) mRNA varied from undetectable to very low in all nine cell lines. Neither the individual Hsp70 mRNAs nor their combined expression (determined in relation to a housekeeping PBGD mRNA) was clearly up- or down-regulated in tumorigenic cells as compared to nontumorigenic cells. The Affymetrix GeneChip array-based quantification of gene expression in HeLa cells confirmed the Hsp70 mRNA expression data obtained by RT-PCR (Fig. 1B). We next monitored the Hsp70-2 mRNA levels in tissue biopsies from breast cancer patients. As compared to 13 samples from the adjacent normal breast tissue, Hsp70-2 expression was clearly elevated in five out of 16 (31%) and four out of nine (44%) samples from primary and metastatic breast cancer tissue, respectively (Fig. 1C). The Hsp70-2/PBGD ratios in these nine samples were also significantly (65-940 times) higher than in any of the immortalized or tumorigenic cell lines tested.
Figure 1.
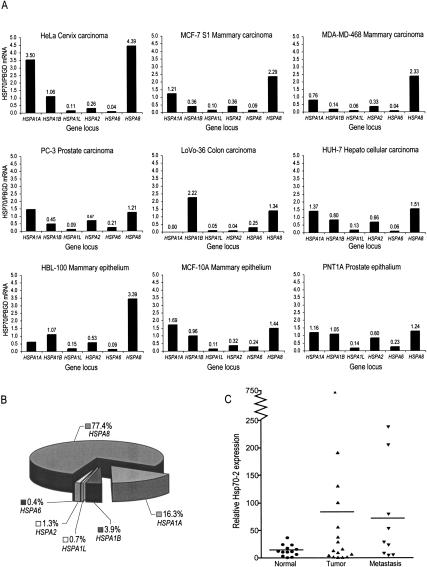
Hsp70-2 is expressed in various cell lines and in primary and metastatic breast cancer tissue. (A) Expression of the genes encoded by HSPA1A, HSPA1B, HSPA1L, HSPA2, HSPA6, and HSPA8 gene loci was monitored in the indicated cell lines by RT-PCR, and their expression levels are expressed relative to the PBDG housekeeping gene. The results of one representative experiment out of a minimum of three independent measurements are shown. (B) The relative amounts of different cytosolic Hsp70 mRNAs in HeLa cells as determined by Affymetrix GeneChip array. (C) Hsp70-2 mRNA expression levels in human mammary biopsies originating from normal, primary tumor, or metastatic tumor samples were determined by real-time RT-PCR. Each dot represents an independent tissue sample, where Hsp70-2 levels are depicted relative to PBGD levels. The horizontal lines represent mean values.
Depletion of Hsp70 or Hsp70-2 induces cancer-specific antiproliferative effects
In order to deplete cells specifically for individual cytosolic Hsp70 proteins, we took advantage of the RNAi technology and designed sequence-specific small interfering RNAs (siRNAs). This technology allowed for the first time a highly specific knock-down of Hsp70, Hsp70-2, and Hsc70 mRNAs (data not shown) and proteins (Fig. 2A). Due to the very low expression levels of Hsp70-6 in unstressed cells (0.4% of mRNA coding for cytosolic Hsp70s), the effectiveness of an Hsp70-6 siRNA was demonstrated by RT-PCR analysis of mRNAs in heat-shocked cells (Fig. 2B). RNAi of Hsp70t was excluded from most of the further studies because its low expression levels did not allow appropriate control of the effectiveness of the siRNA. Next we compared the effect of the specific Hsp70 knock-downs on the growth and morphology of tumorigenic and nontumorigenic cells. Whereas HeLa cells transfected with a control or Hsp70-6 siRNAs grew normally, the morphology of cells depleted for Hsp70, Hsp70-2, or Hsc70 changed dramatically 2-3 d after the transfection. Depletion of Hsp70 resulted in the detachment and rounding up of the cells, whereas Hsp70-2 depletion triggered a morphology reminiscent of senescence characterized by large, flattened cells, some of which displayed membrane blebbing while attached to the dish (Fig. 2C). Cells depleted for Hsc70 obtained strongly elongated fibroblast-like morphology before rounding up and detaching from the culture dish (Fig. 2C). In concordance with a clear reduction in the cell number observed in the light microscope, the MTT reduction assay revealed a significant reduction in the cell density following depletion of Hsp70, Hsp70-2, or Hsc70 (Fig. 2D). Importantly, HeLa cells depleted for Hsp70, Hsp70-2, Hsp70-6, or Hsc70 by at least two additional siRNAs directed against nonoverlapping sequences in each Hsp70 displayed similar morphology and growth characteristics as described above (data not shown). Furthermore, similar antiproliferative responses were observed following depletion of Hsc70 in MCF-7 cells and that of Hsp70 and Hsp70-2 in MCF-7, PC-3, and HuH-7 cells (Fig. 2D; data not shown). Contrary to tumor cells, the morphology (data not shown) and growth of nontumorigenic HBL-100 cells depleted for Hsp70 or Hsp70-2 were indistinguishable from those observed in nontransfected cells or cells transfected with a control siRNA or Hsp70-6 siRNA (Fig. 2D). Also, other nontumorigenic epithelial cells (MCF-10A and PNT1A) grew normally in spite of the effective depletion of Hsp70, Hsp70-2, or Hsp70-6 (Fig. 2D; data not shown). Nontumorigenic cells depleted for Hsc70 responded, however, by fibroblast-like elongated morphology and massive cell death comparable to that seen in tumor cells (Fig. 2D). Thus, the growth of none of the cells tested depended on Hsp70-6, only tumorigenic cells depended on Hsp70 and Hsp70-2, and all cells required Hsc70.
Figure 2.

Hsp70 and Hsp70-2 are specifically required for the growth of cancer cells.(A) Hsp70, Hsp70-2, Hsc70, and GAPDH protein levels in indicated cell lines were determined by immunoblotting 72 h after the transfection with a control siRNA (C) or siRNA targeting Hsp70 (A1), Hsp70-2 (A2.1, A2.2 and A2.3), Hsp70-6 (A6), or Hsc70 (A8). The asterisk (★) indicates the position of an unspecific protein detected by the Hsp70-2 antiserum. (B) Hsp70-6 mRNA levels in HeLa cells treated with oligofectamine alone (O) or transfected with a control siRNA (C) or an siRNA targeting Hsp70-6 (A6) were determined by RT-PCR. When indicated (HS), cells were heated at 45°C for 30 min, 2 h before harvesting. PCR reactions with no DNA (neg.) and genomic DNA (pos.) are shown as controls. (C) HeLa cells were transfected with indicated siRNAs as in A and photographed in the phase contrast microscope 72 h later. (D) Indicated cell lines were transfected with siRNAs as in A and analyzed for the metabolic activity by MTT assay 72 h after the transfection. The data are presented as percentage of cell density in cultures treated with oligofectamine alone (O), and averages ± SD of a triplicate experiment are shown. The experiments were performed from three to 10 times with the same results.
Depletion of Hsp70 and Hsp70-2 arrests cancer cells in G2/M and G1, respectively
Prompted by the cancer-specific antiproliferative effects induced by Hsp70 and Hsp70-2 siRNAs, we analyzed their effects on HeLa cells in more detail. Flow cytometry of HeLa cells transfected with siRNA against Hsp70 and Hsp70-2 revealed an arrest in G2/M phase and G1 phase of the cell cycle, respectively (Fig. 3). These findings were further substantiated by repeating the experiment with an imposed cell cycle arrest in G1 or mitosis by lovastatin or the spindle drug nocodazole, respectively. Whereas nearly all lovastatin-treated control cells accumulated in G1, >30% of similarly treated Hsp70-depleted cells remained in G2/M (data not shown). On the contrary, practically all nocodazole-treated control as well as Hsp70-depleted cells accumulated in G2/M, whereas a significant proportion of Hsp70-2 depleted cells remained in G1 (Fig. 3). Remarkably, similar results were obtained by several nonoverlapping siRNA sequences (Fig. 3; data not shown).
Figure 3.

Depletion of Hsp70 and Hsp70-2 induces G2/M and G1 arrest, respectively. HeLa cells transfected with the indicated siRNAs were analyzed for the DNA content by flow cytometry 72 h after transfection. Cells were treated with nocodazole (Noco) or diluent (Untr) for 16 h before the harvest. The positions of the G1 (2N) and G2/M (4N) peaks are marked. The experiment was performed three times with the same results.
Depletion of Hsp70 and Hsp70-2 induces striking changes in gene expression
To enlighten the pathways involved in the antiproliferative responses induced by the depletion of Hsp70s, we performed a gene expression analysis using the Affymetrix GeneChip array. We compared HeLa cells transfected with siRNAs against either Hsp70 or Hsp70-2 with cells transfected with a mismatch siRNA control. To avoid numerous secondary changes in the gene expression, the analysis was performed at the time when the morphological changes were only just about to appear (48 h after the transfection). Surprisingly, specific depletion of Hsp70 chaperone proteins involved in the control of folding and transport of other proteins resulted in striking changes in gene expression. As compared to the control cells, 50 and 137 genes were differently expressed (more than twofold difference, p < 0.005) in cells depleted for Hsp70 and Hsp70-2, respectively (see Supplemental Material for identities of all differentially expressed genes). Interestingly, the expression of only 14 of the genes was similarly altered in cells depleted with Hsp70 and Hsp70-2, the most prominent example being plectin, a cytoskeletal linker protein involved in the hemidesmisome assembly (Huber 2003), that was down-regulated 10- and 20-fold, respectively. A relatively high number of the genes displaying altered expression in Hsp70-2-depleted cells were genes reported to be involved in cell cycle regulation and apoptosis. The genes whose regulation was up-regulated more than threefold or down-regulated more than fourfold are listed in Tables 2 and 3.
Table 2.
Genes regulated by the depletion of Hsp70
| Fold change | GenBanka | Gene nameb |
|---|---|---|
| 3.5 | NM_138720 | H2B histone family, member B |
| −27.6 | BC014652 | Hypothetical protein BC002942 |
| −25.9 | NM_003186 | Transgelin |
| −10.0 | Z54367 | Homo sapiens gene for plectin |
| −7.3 | NM_005345 | Heat shock 70 kDa protein 1A |
| −6.6 | NM_054013 | Mannosyl-acetylglucosaminyltransferase |
| −6.0 | NM_005009 | Nonmetastatic cells 4 |
| −5.1 | AC004528 | Homo sapiens chr. 19, cosmid R32184 |
| −4.6 | NM_005451 | Enigma (LIM domain protein) |
| −4.5 | NM_014876 | KIAA0063 gene product |
| −4.2 | NM_005983 | S-phase kinase-associated protein 2 (p45) |
GenBank accession number.
Genes listed include those differentially regulated 48 h after the transfection of HeLa cells with A1 siRNA as compared to cells transfected with a mismatch siRNA. The cutoff limit in the Affymetrix GeneChip array analysis was set to three-fold for induced genes (+) and four-fold for repressed (−) genes.
Table 3.
Genes regulated by the depletion of Hsp 70-2
| Fold change | GenBanka | Gene nameb |
|---|---|---|
| 19.1 | AF003934 | Macrophage inhibitory cytokine-1 (MIC-1) |
| 9.2 | NM_003469 | Secretogranin II (chromogranin C) |
| 8.8 | NM_000389 | Cyclin-dependent kinase inhibitor 1A (p21, Cip1) |
| 4.3 | D13889 | Inhibitor of DNA binding 1 |
| 4.1 | NM_000963 | Prostaglandin-endoperoxide synthase 2 (cox-2) |
| 3.9 | NM_000161 | GTP cyclohydrolase 1 (dopa-responsive dystonia) |
| 3.7 | AA401492 | GNAS complex locus |
| 3.6 | NM_000713 | Biliverdin reductase B (flavin reductase (NADPH)) |
| 3.3 | AF112857 | Cyclin E2 |
| 3.3 | AF155810 | Solute carrier family 25, member 14 |
| 3.1 | BC000305 | Caspase 6, apoptosis-related cysteine protease |
| 3.1 | NM_030799 | Golgi membrane protein SB140 |
| 3.1 | NM_000107 | Damage-specific DNA binding protein 2 (48 kDa) |
| −20.2 | Z54367 | EMBL: H. sapiens gene for plectin |
| −7.1 | AF142419 | Homolog of mouse quaking QKI |
| −6.7 | NM_005451 | Enigma (LIM domain protein) |
| −5.9 | AB017498 | Low-density lipoprotein receptor-related protein 5 |
| −5.8 | U28964 | 14-3-3ζ |
| −5.6 | NM_015392 | Neural proliferation, differentiation and control, 1 |
| −5.6 | NM_006893 | Ligatin |
| −5.5 | NM_005397 | Podocalyxin-like |
| −5.4 | NM_005030 | Polo-like kinase (Drosophila) |
| −5.0 | AA577698 | Eukaryotic translation initiation factor 2, subunit 1 |
| −5.0 | BC002323 | Zyxin |
| −4.9 | AL136807 | Ribosome-associated membrane protein 4 |
| −4.6 | NM_014888 | Family with sequence similarity 3, member C |
| −4.6 | BC002827 | Tropomyosin 4 |
| −4.5 | NM_002748 | Mitogen-activated protein kinase 6 |
| −4.4 | NM_002653 | Paired-like homeodomain transcription factor 1 |
| −4.3 | NM_005983 | S-phase kinase-associated protein 2 (p45) |
| −4.1 | NM_016837 | Single-stranded interacting protein 1 |
| −4.1 | NM_006729 | Diaphanous homolog 2 (Drosophila) |
| −4.0 | NM_007061 | Serum constituent protein |
| −4.0 | AL525798 | Fatty-acid-Coenzyme A ligase, long-chain 3 |
| −4.0 | NM_005962 | MAX interacting protein 1 |
| −4.0 | NM_002402 | Mesoderm specific transcript homolog (mouse) |
GenBank accession number.
Genes listed include those differentially regulated 48 h after the transfection of HeLa cells with A1 siRNA as compared to cells transfected with a mismatch siRNA. The cutoff limit in the Affymetrix GeneChip array analysis was set to three-fold for induced genes (+) and four-fold for repressed (−) genes.
MIC-1 is instrumental for the cell cycle arrest induced by Hsp70-2 depletion
A member of the transforming growth factor-β (TGF-β) family, macrophage inhibitory cytokine-1 (MIC-1), was the most strongly induced gene following Hsp70-2 knockdown (Table 3). In concordance with published data (Li et al. 2000; Tan et al. 2000), ectopic expression of MIC-1 in human cancer cells induced changes similar to those we observed in Hsp70-2-depleted cancer cells, that is, induction of the cyclin inhibitor p21cip (Table 3; Fig. 4A), G1 arrest (Fig. 3), and cell death (Fig. 2C,D). Therefore, we chose to study the role of MIC-1 in the antiproliferative response induced by Hsp70-2 depletion in more detail. Using RT-PCR (Fig. 4A) and immunoblotting (Fig. 4B), we confirmed that MIC-1 expression was significantly up-regulated in HeLa cells upon depletion of Hsp70-2. Importantly, Hsp70-2 depletion induced a strong up-regulation of MIC-1 expression also in MCF-7 breast cancer cells, but not in nontumorigenic cells (PNT1A and HBL-100), although they were efficiently depleted of Hsp70-2 (Fig. 4A). Also, the induction of p21cip was observed only in cancerous cells, but not in immortalized epithelial cells (Fig. 4A). Thus, the induction of MIC-1 and p21cip fully correlated with the impact of Hsp70-2 depletion on the growth of the cancer-derived versus non-cancer-derived cell lines. The ability of an ectopically expressed Hsp70-2 refractory to the Hsp70-2 siRNA (two silent mutations in the siRNA target sequence) to prevent the induction of MIC-1 and partially inhibit the reduction in cell number in Hsp70-2-depeleted HeLa cells confirmed that the induction of MIC-1 and the growth arrest were actually caused by the Hsp70-2 knock-down rather than an unspecific knock-down of another gene (Fig. 4B). This conclusion was further supported by a similar induction of MIC-1 expression and growth arrest by four independent siRNAs directed against Hsp70-2 (Figs. 3, 5A, 6A; data not shown). Furthermore, MIC-1 induction was specific for the depletion of Hsp70-2, since not only the control siRNA, but also those directed against Hsp70, Hsc70, Hsp70t, and Hsp70-6, failed to up-regulate MIC-1 (Figs. 5A, 6A).
Figure 4.

Depletion of Hsp70-2 induces MIC-1 and p21 expression in cancer cells. (A) Tumorigenic (HeLa and MCF-7) and nontumorigenic (PNT1A and HBL-100) cells were analyzed by RT-PCR for the expression of Hsp70-2, MIC-1, and p21CIP (represented by the upper bands in each gel) 72 h after transfection with oligofectamine alone (O), mismatch siRNA (C), or Hsp70-2 siRNA (A2.2). The lower bands represent the internal PBGD control. (B) HeLa cells were cotransfected with pX-CD20 together with an siRNA refractory mutant of Hsp70-2 (70-2★) or control plasmid (Mock). Transfected cells were enriched 24 h later using anti-CD20-coated magnetic beads and subsequently transfected with a mismatch (C) or Hsp70-2 (A2.2) siRNA. After 72 h, cells were monitored for the expression of Hsp70-2 (the asterisk indicates the position of an unspecific protein detected by the Hsp70-2 antibody), MIC-1 and GAPDH by immunoblot analysis, and the surviving cells were counted. The number of surviving cells after A2.2 siRNA treatment is presented as a percentage of surviving control siRNA-treated cells, and averages ± SD of a triplicate experiment are shown. The experiments were performed at least three times with the same results.
Figure 5.

Codepletion of MIC-1 alleviates the growth arrest induced by Hsp70-2 depletion. (A) HeLa cells were transfected with oligofectamine alone (O), or with 50 nM mismatch (C), Hsp70 (A1), or Hsp70-2 (A2.1 and A2.2) siRNA. When indicated, cells were cotransfected with increasing concentrations (10 nM and 20 nM) of either mismatch (C) or MIC-1 siRNA. Hsp70-2 and MIC-1 protein levels were analyzed by immunoblotting 72 h after the transfection. The asterisk indicates the position of an unspecific protein detected by the Hsp70-2 antibody. (B,C) HeLa cells were transfected with 50 nM mismatch siRNA (C) or 50 nM A2.2 siRNA alone or together with 10 nM MIC-1 or mismatch (C) siRNA. The DNA content (B) and the morphology (C) of the cells were analyzed 72 h after the transfection by flow cytometry and phase contrast microscopy, respectively. The percent increase of cells in G1 as compared to control transfected cells is depicted in B. The values present averages ± SD of a triplicate experiment. The experiments were performed at least three times with the same results.
Figure 6.

Depletion of Hsp70-2 activates P53 that is involved in the induction of MIC-1. (A) HeLa cells were transfected with the indicated siRNAs, and the expression of the indicated proteins was monitored by immunoblotting 72 h later. The specific down-regulation of Hsp70t by the A1L siRNA was confirmed by RT-PCR (data not shown). (B) HeLa cells were transfected with the indicated siRNAs. The transcriptional activity of P53 was monitored 48 h later by a luciferase reporter assay and is presented relative to the activity in cells treated with oligofectamine alone (O). The data represent mean values of two duplicate experiments. (C) HeLa cells were transfected with 5 nM control siRNA (C) or decreasing concentrations of siRNAs targeting Hsp70-2 (A2.1 and A2.2). The expression of the indicated proteins was monitored by immunoblotting 72 h later. (D) HeLa cells were transfected either with 50 nM A2.2 alone or in combination with 10 nM of siRNAs against MIC-1, P53, or a control siRNA (C). The levels of the indicated proteins was monitored by immunoblotting 72 h after the transfection. The asterisk indicates the position of an unspecific protein detected by the Hsp70-2 antibody.
Next we carried out another rescue experiment to test whether MIC-1 was the mediator of the phenotype induced by the Hsp70-2 depletion. For this purpose, the Hsp70-2 siRNA-induced expression of MIC-1 was inhibited by cotransfecting HeLa cells with an siRNA targeting MIC-1 (Fig. 5A). Cells transfected with Hsp70-2 siRNA alone, or together with increasing amounts of a control siRNA, up-regulated the expression of MIC-1, accumulated in the G1 phase of the cell cycle, and displayed the flattened morphology described above (Fig. 5). When the control siRNA was substituted with increasing amounts of MIC-1 siRNA, cells failed to up-regulate MIC-1, and they retained their normal shape and cell cycle distribution (Fig. 5). Thus, MIC-1 is an important mediator of the growth arrest induced by Hsp70-2 knock-down.
MIC-1 up-regulation depends on P53 tumor-suppressor protein and vice versa
MIC-1 can be regulated in both a p53-dependent and -independent manner (Li et al. 2000; Albertoni et al. 2002). Therefore, we tested whether Hsp70-2 depletion resulted in changes in P53 expression or activity. Indeed, Hsp70-2 knock-down induced a clear increase in P53 protein level and an ∼10-fold increase in P53 transcriptional activity (Fig. 6). Akin to the MIC-1 induction, the increase in P53 expression was specific for the depletion of Hsp70-2, since three independent siRNAs against Hsp70-2 resulted in similar P53 increase, whereas cells depleted for Hsp70, Hsc70, Hsp70-6, or Hsp70t showed no detectable increase in P53 levels (Fig. 6A). Furthermore, the titration of concentrations of A2.1 and A2.2 siRNAs down to the level where no effect could be monitored on Hsp70-2 expression, revealed an indirect correlation between the levels of Hsp70-2 and both P53 and MIC-1 (Fig. 6C).
Next we asked whether the expression of MIC-1 and P53 influence each other's expression levels. For this purpose, HeLa cells were transfected either with A2.2 siRNA alone or in combination with siRNA against MIC-1, P53, or a mismatch control. In addition to effectively inhibiting their own expressions, P53 and MIC-1 siRNAs completely blocked the induction of each other in response to Hsp70-2 depletion (Fig. 6D). Importantly, neither siRNA affected the ability of A2.2 to down-regulate Hsp70-2. Thus, MIC-1 and P53 appear to form a positive feedback loop by positively affecting each other's expression.
Synergistic antiproliferative response by codepletion of Hsp70 and Hsp70-2
We have earlier shown that an adenoviral transfer of a 321-bp antisense sequence of Hsp70 (Ad.asHsp70) depletes cells for Hsp70 (without inhibiting the expression of Hsc70 or mtHsp70), induces massive death of cancer cell lines in vitro, and eradicates tumor xenografts in nude mice (Nylandsted et al. 2000, 2002). Given the high homology between Hsp70 and Hsp70-2 genes, also in the region covered by the antisense sequence (Table 1), together with our present data showing that the specific depletion of Hsp70 by siRNA induced a more modest response in cancer cells than Ad.asHsp70 infection, we reasoned that the dramatic phenotype of Ad.asHsp70-infected cancer cells could be due to the combined depletion of Hsp70 and Hsp70-2. Indeed, infection of cancer cells with Ad.asHsp70 reduced Hsp70-2 protein levels approximately to one-third of the level detected in Ad.β-Gal-infected control cells (Fig. 7A), and induced the expression of MIC-1 (Fig. 7B). To test more directly whether codepletion of Hsp70 and Hsp70-2 acts synergistically, we combined siRNAs specific for Hsp70 and Hsp70-2. In spite of numerous efforts, this approach failed to result in an effective simultaneous down-regulation of both proteins. Instead, we took advantage of an siRNA originally designed to target Hsp70-2 (A2.4) that displayed strong cross-reactivity with Hsp70 (Fig. 7C). The antiproliferative response of HeLa cells depleted for both Hsp70 and Hsp70-2 by the A2.4 siRNA was much more dramatic than that caused by specific knock-down of either protein alone (Fig. 7D,E). Instead of mainly growth-arrested phenotypes observed in cultures transfected with A1 or A2.2 siRNAs, cells transfected with A2.4 siRNA underwent massive cell death 2-3 d after the transfection.
Figure 7.

Concomitant down-regulation of Hsp70 and Hsp70-2 induce massive cell death. (A) HeLa cells were infected with either Ad.β-gal or Ad.asHsp70, and Hsp70-2 protein levels were determined by immunoblotting 48 and 72 h later. (B) Cells were left untreated (C) or infected as in A (as, Ad.asHsp70), and the expression of MIC-1 and an internal control (PDGD) was monitored by RT-PCR. (C) Hsp70, Hsp70-2, and GAPDH protein levels in HeLa cells were determined by immunoblotting 72 h after transfection with oligofectAmine alone (O), or with a control siRNA (C), siRNA targeting Hsp70-6 (A6), or siRNA targeting both Hsp70 and Hsp70-2 (A2.4). The asterisk (★) indicates the position of an unspecific protein detected by the Hsp70-2 antiserum. (D,E) HeLa cells were transfected with indicated siRNAs and analyzed for the metabolic activity by MTT assay (D) or photographed in a phase contrast microscope (E) 72 h after the transfection. (D) The data are presented as percent of cells treated with oligofectamine alone, and averages ± SD of a triplicate experiment are shown. All experiments were performed at least three times with the same results.
Discussion
Tumorigenesis involves a series of events that allow cells to bypass senescence, a signal transduction program leading to irreversible cell cycle arrest (Hanahan and Weinberg 2000). The minimal molecular changes required for the infinite growth of human epithelial cells in culture have been identified recently and include the activation of telomerase and the inhibition of the retinoblastoma/p16 pathway (Kiyono et al. 1998). Upon transformation, human tumors accumulate numerous other genetic and epigenetic changes, and several genes essential for the growth and survival of certain sub-classes of tumors have been identified. The data presented above reveal HSPA2 as a gene essential for the growth of tumor cells of various origins. This conclusion is based on meticulously controlled experiments using siRNA-based knock-down of Hsp70-2: (1) Four independent Hsp70-2 siRNAs triggered a senescence-like phenotype and G1 growth arrest in HeLa cells, whereas none of the control siRNAs or siRNAs depleting closely related Hsp70s did the same. (2) The expression of an siRNA refractory mutant of Hsp70-2 effectively inhibited the up-regulation of MIC-1 mRNA and partially rescued HeLa cells from the growth arrest induced by Hsp70-2 siRNA. (3) All tumorigenic cell lines successfully depleted for Hsp70-2 (HeLa, MCF-7, HuH-7, PC-3) were growth-arrested. Remarkably, the growth of immortalized cells of similar origins was not dependant on the expression of HSPA2. Thus, Hsp70-2 does not appear to be a prerequisite for infinite growth, but rather for the maintenance of the deregulated cell cycle in tumorigenic cells.
RT-PCR analysis showed that Hsp70-2 was expressed at moderate levels in five out of six tumorigenic cell lines studied and that its expression was dramatically elevated in one-third of the human breast cancer biopsies studied. In HeLa cells, Hsp70 and Hsp70-2 mRNAs accounted for ∼20% and 2% of the total mRNAs encoding for cytosolic Hsp70s, respectively. Thus, the dramatic impacts of their knock-downs were unexpected and suggest that in cancer cells Hsp70 and Hsp70-2 do not function only as housekeeping chaperones assisting overall protein folding and trafficking, but instead must have acquired more specific tasks. This hypothesis is further supported by the data showing that whereas the depletion of the major housekeeping chaperone Hsc70 killed tumorigenic as well as nontumorigenic cells, only cancer cell growth depended on Hsp70 and Hsp70-2. Interestingly, cancer cells depleted for Hsp70 and Hsp70-2 displayed strikingly dissimilar phenotypes and gene expression profiles, indicating that also their functions are separate. Recent data suggest that Hsp70 promotes tumor cell growth by inhibiting apoptosis and/or stabilizing the lysosomal membranes (Xanthoudakis and Nicholson 2000; Nylandsted et al. 2004), whereas the function of Hsp70-2 in tumor cells has not been studied. A possible clue for its function comes from the knock-out study of the corresponding mouse gene HSP70-2 (Dix et al. 1996). Male mice with targeted disruption of HSP70-2 are sterile due to impaired meiosis. In pachytene spermatocytes Hsp70-2 is necessary for CDC2/cyclinB complex formation and hence CDC2 activity (Zhu et al. 1997). It is, however, unlikely that Hsp70-2 is necessary for CDC2 activity in cancer cells, since its depletion leads to G1 arrest rather than mitotic arrest. Nevertheless, the idea of Hsp70-2 being critical for the activity of a specific kinase is interesting. Since deregulated growth and survival signaling is a hallmark of cancer, it is tempting to speculate that Hsp70-2 is required for the stability and activity of a specific kinase or a group of kinases involved in growth and survival signal transduction pathways in cancer cells.
To enlighten the signaling pathways affected by Hsp70-2 knock-down, we performed Affymetrix GeneChip analysis. Surprisingly, expression levels of >100 genes were significantly modulated (30 up and 95 down) in Hsp70-2-depleted cells before any obvious changes in the phenotype were obvious. A closer look at the Hsp70-2-regulated genes revealed an up-regulation of several G1-phase genes (e.g., p21CIP1, Inhibitor of DNA binding 1, Cyclin E2, and Damage-specific DNA-binding protein-2) and a down-modulation of S-phase (S-phase kinase-associated protein-2) and mitotic (polo-like kinase, mitotic check point gene BUB1b) genes. These genes play a role in the progression through the cell cycle, but it remains unclear whether their regulation is the cause or rather a consequence of the observed cell cycle arrest in G1. Instead, MIC-1, the gene that was most strongly up-regulated by Hsp70-2 knockdown (19-fold), was found to be a molecule responsible for the growth arrest. This was proven by the ability of the inhibition of MIC-1 up-regulation by RNAi to significantly attenuate the antiproliferative effects induced by Hsp70-2 knock-down. MIC-1 is a divergent member of the TGF-β superfamily that was originally identified as a cytokine inhibiting macrophage activation (Bootcov et al. 1997). It has also been reported as placental TGF-β (Lawton et al. 1997), placental bone morphogenetic protein (Hromas et al. 1997), prostate-derived factor (Paralkar et al. 1998), growth-differentiation factor-15 (Bottner et al. 1999), and nonsteroidal anti-inflammatory drug-activated gene-1 (Baek et al. 2001). MIC-1 is expressed at high levels in placenta, macrophages, and epithelial cells. Its expression is very low in tumor cell lines originating from breast, cervix, and lung (Li et al. 2000), but elevated in some metastatic colon and gastric cancers (Buckhaults et al. 2001; Lee et al. 2003). MIC-1 expression is rapidly induced by a variety of cellular stresses in a p53-dependent and -independent manner, and it mediates cell cycle arrest and apoptosis in response to DNA damage, toxins, anoxia, liver injury, and other cellular stresses (Hsiao et al. 2000; Li et al. 2000; Albertoni et al. 2002; Wilson et al. 2003). MIC-1 induction may occur via p53-dependent and -independent pathways also in response to Hsp70-2 depletion. In HeLa cells Hsp70-2 depletion resulted in increased p53 protein levels and activity as measured by a reporter gene assay. The direct testing of the role of p53 in the growth arrest and senescent phenotype of Hsp70-2-depleted cells was complicated by the fact that siRNA-based depletion of p53 greatly reduced the viability of HeLa cells (data not shown). However, the depletion of P53 fully abolished the induction of MIC-1 in response to Hsp70-2 depletion. Interestingly, siRNA against MIC-1 also reduced the P53 response, suggesting a more complex feedback regulation between P53 and MIC-1. Moreover, cancer cells lacking P53 (PC-3) responded to Hsp70-2 depletion by MIC-1 induction (data not shown) and growth arrest. Thus, akin to other stress responses, the signaling pathway leading from Hsp70-2 depletion to MIC-1 up-regulation can be both dependent and independent on P53 depending on the cell type.
MIC-1 is a secreted protein that can inhibit tumor cell growth both in an autocrine and paracrine fashion (Tan et al. 2000). Whereas the antiproliferative effect of the recombinant protein depends on the intact TGF-β signaling pathway (receptor and Smad4), endogenously expressed MIC-1 is highly cytotoxic also in Smad4-null breast cancer cells (Li et al. 2000; Tan et al. 2000). Thus, therapeutic strategies targeting Hsp70-2 are likely to affect also cancer cells with defective TGF-β signaling and additionally to induce a so-called bystander effect in MIC-1-responsive tumors. Such a bystander effect may explain the surprisingly high efficacy of an experimental cancer therapy based on a single injection of Ad.asHsp70 into orthotopic glioblastoma xenografts in mice (Nylandsted et al. 2002), as well as a relatively poor rescue of Hsp70-2-depleted cells by ectopic expression of Hsp70-2.
In conclusion, our findings define a novel specific function for Hsp70-2 in the control of tumor cell proliferation. These data open exciting possibilities for the development of highly specific cancer therapies based on the inhibition of Hsp70-2 expression or function and on the identification of the unique client proteins of Hsp70-2 in cancer cells.
Materials and methods
Cell lines and primary tissue
HeLa (cervix), MCF-7-S1 and MDA-MD-468 (breast), PC-3 (prostate), HuH-7 (liver), and LoVo-36 (colon) cell lines originate from human carcinomas of indicated origins. HBL-100 and MCF-10A (mammary) and PNTIA (prostate) are epithelial cell lines of nontumorigenic origin. All cell lines were grown in RPMI 1640 with Glutamax-1 (GIBCO) and 6% FCS (Biological Industries). The growth medium for MCF-10A cells were further supplemented with 10% FCS, 500 ng/mL hydrocortisone (Sigma), 100 ng/mL cholerotoxin (Sigma), 20 ng/mL epidermal growth factor, and 100 ng/mL insulin. Cells were arrested in G1 or mitosis by 20 h of treatment with 20 μM lovastatin or 4 μg/mL nocodazole, respectively.
Complimentary DNA samples for RT-PCR analysis of human breast tissue (normal, primary tumor, and metastasis) were kindly provided by Drs. Per Thor Straten and Per Guldberg (Department of Tumor Cell Biology, Danish Cancer Society, Copenhagen, Denmark). All tissue samples were obtained from patients operated on in the Copenhagen University Hospital and assigned to a research program under administration of the Danish Centre for Translational Breast Cancer Research.
RT-PCR
The RNA was harvested from cell culture or human mammary biopsy samples with RNeasy columns (QIAGEN) and subjected to an on-column DNase treatment using the On-column RNase-free DNase 1 (QIAGEN) to eliminate genomic DNA contamination. Single-stranded cDNA synthesis was made with the TaqMan RT Kit (Roche) using oligo-(dT)16 primers. The cDNA originating from the cell lines was used as template in a duplex PCR reaction performing the amplification of the housekeeping gene porphobilinogen deaminase (PBGD; PubMed entry BC000520) together with the gene of interest. Each PCR reaction contained 1× PCR-buffer (QIAGEN), 0.1 mM dATP, dTTP, and dGTP (BioLabs), 0.01 mM dCTP (BioLabs), 1 μCi 33P-dCTP (Amersham), 0.8 μM each primer (TAG Copenhagen), 2.5 U/20 μL HotStart Taq (QIAGEN), and H2O to 20 μL. The reactions were performed in a PCR Thermo Cycle machine (Techne) with an initial Taq activation at 95°C for 15 min followed by 20 cycles of three segments consisting of 30 sec at 95°C, 30 sec at 60°C, and 30 sec at 72°C. Primers were designed as follows in 5′-3′ directions: HSPA1A-for, GGCAAGATCAGCGAGGCC; HSPA1A-rev, TCTCTGCATGTAGAAACCGC; HSPA1B-for, CCCTACCATTGAGGAGGTG; HSPA1B-rev, AAACTCGTACAGAAGGTGGC; HSPA1L-for, GAGATTGAGCGCATGGTTCT; HSPA1L-rev, GGTAGGGAACCTTTAAGACC; HSPA2- for, CCTACTCGGACAACCAGAG; HSPA2-rev, TCTCGTCTTCCACCGTCTG; HSPA6-for, CCAAATGCAAGACAAGTGTCG; HSPA6-rev, TTCTAGCTTTGGAGGGAAAG; HSPA8- for, AAACGTCTGATTGGACGCAG; HSPA8-rev, GCACGTTTCTTTCTGCTCCA; MIC-1-for, TCTCAGATGCTCCTGGTGTT; MIC-1-rev, CGAAGATTCTGCCAGCAGTT; p21-for, GGAACTTCGACTTTGTCACC; p21-rev, AATCTGTCATGCTGGTCTGC; PBGD-for, CATGTCTGGTAACGGCAATG; PBGD-rev, AGGGCATGTTCAAGCTCCTT. The samples were separated by 5% polyacrylamide gel electrophoresis according to standard methods. The gel was dried, exposed for 10-16 h in a P-image cassette (Fujifilm), and scanned in a LAS-3000 Phosphor Image Scanner (Fujifilm). Bands were quantified with the Image Gauge software (Fujifilm) in Quant mode as ImageGaugeQuant (IGQ) = (VolumeBand - VolumeBackground)/AreaPixels. The expression of genes was computed as the fraction IGQGene of interest/IGQPBGD. The single-stranded cDNA from human mammary biopsy samples was analyzed in a real-time PCR setup performed in the LightCycler 2.0 (Roche) with the Fast-Start SYBR-green I Master-mix (Roche) and the primer-sequences 5′-3′ (500 nM final): HSPA2-for, AAAGGTCGTCTGAGCAAGGA; HSPA2-rev, ATAGGACTCCAGGGCGTTTT; PBGD-for, TCCAAGCGGAGCCATGTCTG; PBGD-rev, AGAATCTTGTCCCCTGTGGA. PCR was initiated with a Taq activation step performed at 95°C for 10 min followed by 40 amplification cycles of a 95°C denaturation step for 2 sec and a 72°C combined annealing-elongation step for 10 sec. The reaction was subjected to an absolute quantification analysis according to the manufacturer's guidelines. The Hsp70-2 expression in each tissue sample was normalized to an external standard curve and evaluated relative to the PBGD expression.
siRNAs, plasmids, and transfections
siRNAs were designed against the mRNA sequences targeting HSPA1A and HSPA1B, 5′-CGACGGAGACAAGCCCAAG-3′ (A1); HSPA2, 5′-CGGCAAGGAGCUGAACAAG-3′ (A2.1), 5′-GGACAUUGGGCCCAACAAG-3′ (A2.2), 5′-GAUGAGUAUGAACACAAGC-3′ (A2.3), and 5′-GGGAGACCAAGACCUUCUU-3′ (A2.4); HSPA6, 5′-GGGAGGACAAGACGUUCUA-3′ (A6); HSPA8, 5′-GAGAGACCAAAAGCUUCUA-3′ (A8); HSPA1L, 5′-GCTGGACTTAATGTGCTAA-3′ (A1L); MIC-1, 5′-UCCCAUGGUGCUCAUUCAA-3′. As control we used a version of A1 with two mismatches (underlined): 5′-CGACCGAGACAAGCGCAAG-3′ (C). All siRNAs were purchased at Dharmacon Research, USA. In every siRNA experiment a control sample treated with the transfection agent alone (O) was included.
pcDNA-Hsp70-2*: The coding sequence of Hsp70-2 was isolated by RT-PCR from MCF-7 cells and inserted between EcoRI and HindIII sites of pcDNA3.1 (Invitrogen). Two silent mutations (underlined) in the target sequence of A2.2 siRNA were generated by PCR using the following primers: 5′-AGAAGGACATCGGACCCAACAAGC-3′ and 5′-GCTTGTTGGGTCCGATGTCCTTC-3′. HeLa cells were transfected with CaCl2 according to standard protocol. Reconstitution of Hsp70-2 expression in siRNA-treated HeLa cells was done by cotransfecting cells with pcDNA-Hsp70-2★ and the px-CD-20 plasmid encoding for CD20 surface marker (kindly provided by Dr. Jiri Bartek, Danish Cancer Society, Copenhagen, Denmark). Cells expressing CD20 were isolated using the anti-CD20-coated Dynabeads and a DYNAL magnetic particle concentrator according to the protocol of the manufacturer (Dynal A.S.). The isolated cells were plated on six-well plates and transfected with siRNA as described below.
Recombinant adenoviruses and infections
Ad.asHsp70 and Ad.β-Gal are adenoviral shuttle vectors carrying bases 475-796 of the published human Hsp70 sequence (accession no. NM_005345) in antisense orientation or the β-galactosidase gene, respectively (Nylandsted et al. 2000). The infections were performed as described (Nylandsted et al. 2000).
Western blotting
The primary antibodies used included murine monoclonal antibodies against Hsp70 and Hsc70 (2H9 and N69, kindly provided by Boris Margulis, Russian Academy of Sciences, St. Petersburg, Russia), glyceraldehyde-3-phosphate dehydrogenase (GAPDH; Biogenesis), goat antiserum against MIC-1 (Santa Cruz Biotechnology, USA), and P53 (DO1, kindly provided by Jiri Bartek). Antiserum (789) against Hsp70-2 was generated by immunizing a rabbit with ovalbumin-conjugated NH2-SKLYQGGPGGGGSSGGPT peptide corresponding to the amino acids 611-628 in the published Hsp70-2 sequence (accession no. NP_068814; Neosystem). Immunodetection of proteins separated by 10%-12% SDS-PAGE and transferred to nitrocellulose was performed using indicated primary antibodies, appropriate peroxidase-conjugated secondary antibodies from Dako, ECL Western blotting reagents (Amersham), and Luminescent Image Reader (LAS-1000Plus, Fujifilm).
Cell density measurement and microscopic analysis
Viable cells were measured by their ability to reduce the tetrazolium salt 3-(4,5-dimethylthiazole-2-y)-2,5-diphenyltetrasodiumbromide (MTT; Sigma) to a formazan dye detectable by spectrophotometric analysis A550/A650 (VersaMax; Molecular Devices) as described previously (Foghsgaard et al. 2001).
Phase contrast pictures of cell lines were taken with an inverted Olympus IX-70 Microscope connected to an Olympus C-3030 digital camera at 100× and 200× magnification.
Flow cytometry
Cells were washed in 300 μL of PBS + 3% FCS and fixed for 20 min on ice by adding 800 μL of -20°C methanol. After rehydration in PBS + 3% FCS, cells were resuspended in 400 μL of propidium iodide buffer (10 mM Tris-Cl at pH 7.5, 5 mM MgCl2, 50 mg/mL propidium iodide, 10 mg/mL RNase A, 0.02% sodium azide) and incubated 30 min at 37°C. Stained cells were analyzed by the Becton and Dickinson FACSCalibur flow cytometer using the CellQuest software. The data were expressed as a histogram with the DNA content (FL2) along the X-axis. The percentage of cells in S phase was obtained using the ModFit LT program from Verity Software House, Inc.
Reporter assay
HeLa cells were seeded at 2.5 × 10⁶ cells per 10-cm dish and transfected by the calcium phosphate method using 8 μg of the mdm2-luciferase reporter construct (kindly provided by Jiri Lukas, Danish Cancer Society, Copenhagen, Denmark) and 2 μg of CMV-β-galactosidase. After 24 h, cells were trypsinized and transferred to six-well plates and transfected with siRNA 24 h later as described above. Cells were harvested 48 h later, and the luciferase activity was measured using the Luciferease Assay System (Promega) and a Berthold Lumat LB95d instrument. β-Galactosidase activity was quantitated as an internal control for transfection efficiency, and the luciferase readout was normalized accordingly.
Affymetrix GeneChip expression analysis
HeLa cells were transiently transfected with indicated siRNAs and grown for 48 h in 37°C. Total RNA was purified on RNeasy columns (QIAGEN) and inverse-transcribed into double-stranded cDNA with T7-(dT)24 primers using the SuperScript Double-stranded cDNA Synthesis Kit (Invitrogen). cDNA was cleaned up with PhaseLock Gel Light (Eppendof), and the complementary RNA was in vitro transcribed incorporating biotin-labeled dCTP and dUTP using the MEGAscript T7 High Yield Transcription Kit (Ambion). The unincorporated biotin nucleotides were removed using RNeasy columns (QIAGEN). The labeled RNA (30 μg/sample) was then fragmented in 5× fragmentation buffer (40 mM Tris-acetate at pH 8.1, 100 mM potassium acetate, 30 mM magnesium acetate) creating the hybridization probe. The probe was mixed with the GeneChip Eukaryotic Hybridization Control Kit (Affymetrix) and hybridization buffer (1×: 100 mM MES, 1 M NaCl, 20 mM EDTA, 0.01% Tween-20) and heated to 99°C for 5 min and tested for appropriate quality on a test3chip before loading into the probe array cartridge HG-U133A (Affymetrix). Hybridization was performed for 16 h at 45°C under constant rotation at 60 rpm. After hybridization the probe array was washed in the hybridization buffer 10 times at 25°C and five times at 50°C, stained with phycoerythrin-conjugated streptavidin (2 μg/μL; Molecular Probes), and washed 10 times in the hybridization buffer at 25°C. All washing steps were done in the GeneChip Fluidic Station (Affymetrix). The probe array was scanned in the HP GeneArray Scanner with an excitation wavelength at 488 nm and an emission wavelength at 570 nm (Hewlett-Packard). The signal was then amplified using a streptavidin-specific biotin-labeled goat IgG antibody (3 μg/mL; Vector Laboratories) and phycoerythrin-conjugated streptavidin (2 μg/μL; Molecular Probes) and subjected to the second scan. All sample conditions were performed in a duplex setting, evaluated with the Microarray Suite 5.0 (Affymetrix), and subjected a two-tailed comparing t-test with the level of significance fixed to p ≤ 0.005 and a twofold cutoff limit in the difference call (GenePicker 9; IFOM Bioinformatics). Furthermore, it was required that the difference was significant as compared to cells transfected with olicofectamine alone and with control siRNA. For more detailed description of the analysis and complete lists of regulated genes, see the Supplemental Material.
Acknowledgments
We thank Birgit Poulsen and Karina Grøn Henriksen for excellent technical assistance and Marco Ciro for helpful discussions. This work was supported by grants from the Danish Cancer Society, the Danish Medical Research Council, the European Commission 5th Framework Programme, the Novo Foundation, and the Association for International Cancer Research.
Supplemental material is available at http://www.genesdev.org.
Article and publication are at http://www.genesdev.org/cgi/doi/10.1101/gad.305405.
References
- Albertoni M., Shaw, P.H., Nozaki, M., Godard, S., Tenan, M., Hamou, M.F., Fairlie, D.W., Breit, S.N., Paralkar, V.M., de Tribolet, N., et al. 2002. Anoxia induces macrophage inhibitory cytokine-1 (MIC-1) in glioblastoma cells independently of p53 and HIF-1. Oncogene 21: 4212-4219. [DOI] [PubMed] [Google Scholar]
- Baek S.J., Kim, K.S., Nixon, J.B., Wilson, L.C., and Eling, T.E. 2001. Cyclooxygenase inhibitors regulate the expression of a TGF-β superfamily member that has proapoptotic and anti-tumorigenic activities. Mol. Pharmacol. 59: 901-908. [PubMed] [Google Scholar]
- Bootcov M.R., Bauskin, A.R., Valenzuela, S.M., Moore, A.G., Bansal, M., He, X.Y., Zhang, H.P., Donnellan, M., Mahler, S., Pryor, K., et al. 1997. MIC-1, a novel macrophage inhibitory cytokine, is a divergent member of the TGF-β superfamily. Proc. Natl. Acad. Sci. 94: 11514-11519. [DOI] [PMC free article] [PubMed] [Google Scholar]
- Bottner M., Suter-Crazzolara, C., Schober, A., and Unsicker, K. 1999. Expression of a novel member of the TGF-β superfamily, growth/differentiation factor-15/macrophage-inhibiting cytokine-1 (GDF-15/MIC-1) in adult rat tissues. Cell Tissue Res. 297: 103-110. [DOI] [PubMed] [Google Scholar]
- Buckhaults P., Rago, C., St Croix, B., Romans, K.E., Saha, S., Zhang, L., Vogelstein, B., and Kinzler, K.W. 2001. Secreted and cell surface genes expressed in benign and malignant colorectal tumors. Cancer Res. 61: 6996-7001. [PubMed] [Google Scholar]
- Bukau B. and Horwich, A.L. 1998. The Hsp70 and Hsp60 chaperone machines. Cell 92: 351-366. [DOI] [PubMed] [Google Scholar]
- Buzzard K.A., Giaccia, A.J., Killender, M., and Anderson, R.L. 1998. Heat shock protein 72 modulates pathways of stress-induced apoptosis. J. Biol. Chem. 273: 17147-17153. [DOI] [PubMed] [Google Scholar]
- Ciocca D.R., Clark, G.M., Tandon, A.K., Fuqua, S.A., Welch, W.J., and McGuire, W.L. 1993. Heat shock protein hsp70 in patients with axillary lymph node-negative breast cancer: Prognostic implications. J. Natl. Cancer Inst. 85: 570-574. [DOI] [PubMed] [Google Scholar]
- Dix D.J., Allen, J.W., Collins, B.W., Mori, C., Nakamura, N., Poorman-Allen, P., Goulding, E.H., and Eddy, E.M. 1996. Targeted gene disruption of Hsp70-2 results in failed meiosis, germ cell apoptosis, and male infertility. Proc. Natl. Acad. Sci. 93: 3264-3268. [DOI] [PMC free article] [PubMed] [Google Scholar]
- Foghsgaard L., Wissing, D., Mauch, D., Lademann, U., Bastholm, L., Boes, M., Elling, F., Leist, M., and Jäättelä, M. 2001. Cathepsin B acts as a dominant execution protease in tumor cell apoptosis induced by tumor necrosis factor. J. Cell Biol. 153: 999-1009. [DOI] [PMC free article] [PubMed] [Google Scholar]
- Fourie A.M., Peterson, P.A., and Yang, Y. 2001. Characterization and regulation of the major histocompatibility complex-encoded proteins Hsp70-Hom and Hsp70-1/2. Cell Stress Chaperones 6: 282-295. [DOI] [PMC free article] [PubMed] [Google Scholar]
- Gurbuxani S., Bruey, J.M., Fromentin, A., Larmonier, N., Parcellier, A., Jäättelä, M., Martin, F., Solary, E., and Garrido, C. 2001. Selective depletion of inducible HSP70 enhances immunogenicity of rat colon cancer cells. Oncogene 20: 7478-7485. [DOI] [PubMed] [Google Scholar]
- Hanahan D. and Weinberg, R.A. 2000. The hallmarks of cancer. Cell 100: 57-70. [DOI] [PubMed] [Google Scholar]
- Hromas R., Hufford, M., Sutton, J., Xu, D., Li, Y., and Lu, L. 1997. PLAB, a novel placental bone morphogenetic protein. Biochim. Biophys. Acta 1354: 40-44. [DOI] [PubMed] [Google Scholar]
- Hsiao E.C., Koniaris, L.G., Zimmers-Koniaris, T., Sebald, S.M., Huynh, T.V., and Lee, S.J. 2000. Characterization of growth-differentiation factor 15, a transforming growth factor β superfamily member induced following liver injury. Mol. Cell Biol. 20: 3742-3751. [DOI] [PMC free article] [PubMed] [Google Scholar]
- Huber O. 2003. Structure and function of desmosomal proteins and their role in development and disease. Cell Mol. Life Sci. 60: 1872-1890. [DOI] [PMC free article] [PubMed] [Google Scholar]
- Hunt C. and Morimoto, R.I. 1985. Conserved features of eukaryotic hsp70 genes revealed by comparison with the nucleotide sequence of human hsp70. Proc. Natl. Acad. Sci. 82: 6455-6459. [DOI] [PMC free article] [PubMed] [Google Scholar]
- Jäättelä M. 1995. Over-expression of hsp70 confers tumorigenicity to mouse fibrosarcoma cells. Intl. J. Cancer 60: 689-693. [DOI] [PubMed] [Google Scholar]
- ____. 1999. Heat shock proteins as cellular lifeguards. Ann. Med. 31: 261-271. [DOI] [PubMed] [Google Scholar]
- Jäättelä M. and Wissing, D. 1993. Heat-shock proteins protect cells from monocyte cytotoxicity: Possible mechanism of self-protection. J. Exp. Med. 177: 231-236. [DOI] [PMC free article] [PubMed] [Google Scholar]
- Jäättelä M., Wissing, D., Bauer, P.A., and Li, G.C. 1992. Major heat shock protein hsp70 protects tumor cells from tumor necrosis factor cytotoxicity. EMBO J. 11: 3507-3512. [DOI] [PMC free article] [PubMed] [Google Scholar]
- Jäättelä M., Wissing, D., Kokholm, K., Kallunki, T., and Egeblad, M. 1998. Hsp70 exerts its anti-apoptotic function downstream of caspase-3-like proteases. EMBO J. 17: 6124-6134. [DOI] [PMC free article] [PubMed] [Google Scholar]
- Kaur J. and Ralhan, R. 2000. Induction of apoptosis by abrogation of HSP70 expression in human oral cancer cells. Intl. J. Cancer 85: 1-5. [DOI] [PubMed] [Google Scholar]
- Kiyono T., Foster, S.A., Koop, J.I., McDougall, J.K., Galloway, D.A., and Klingelhutz, A.J. 1998. Both Rb/p16INK4a inactivation and telomerase activity are required to immortalize human epithelial cells. Nature 396: 84-88. [DOI] [PubMed] [Google Scholar]
- Lawton L.N., Bonaldo, M.F., Jelenc, P.C., Qiu, L., Baumes, S.A., Marcelino, R.A., de Jesus, G.M., Wellington, S., Knowles, J.A., Warburton, D., et al. 1997. Identification of a novel member of the TGF-β superfamily highly expressed in human placenta. Gene 203: 17-26. [DOI] [PubMed] [Google Scholar]
- Lazaris A., Chatzigianni, E.B., Panoussopoulos, D., Tzimas, G.N., Davaris, P.S., and Golematis, B. 1997. Proliferating cell nuclear antigen and heat shock protein 70 immunolocalization in invasive ductal breast cancer not otherwise specified. Breast Cancer Res. Treat. 43: 43-51. [DOI] [PubMed] [Google Scholar]
- Lee D.H., Yang, Y., Lee, S.J., Kim, K.Y., Koo, T.H., Shin, S.M., Song, K.S., Lee, Y.H., Kim, Y.J., Lee, J.J., et al. 2003. Macrophage inhibitory cytokine-1 induces the invasiveness of gastric cancer cells by up-regulating the urokinase-type plasminogen activator system. Cancer Res. 63: 4648-4655. [PubMed] [Google Scholar]
- Leung T.K., Rajendran, M.Y., Monfries, C., Hall, C., and Lim, L. 1990. The human heat-shock protein family. Expression of a novel heat-inducible HSP70 (HSP70B′) and isolation of its cDNA and genomic DNA. Biochem. J. 267: 125-132. [DOI] [PMC free article] [PubMed] [Google Scholar]
- Li P.X., Wong, J., Ayed, A., Ngo, D., Brade, A.M., Arrowsmith, C., Austin, R.C., and Klamut, H.J. 2000. Placental transforming growth factor-β is a downstream mediator of the growth arrest and apoptotic response of tumor cells to DNA damage and p53 overexpression. J. Biol. Chem. 275: 20127-20135. [DOI] [PubMed] [Google Scholar]
- Lindquist S. and Craig, E.A. 1988. The heat shock proteins. Ann. Rev. Genet. 22: 631-677. [DOI] [PubMed] [Google Scholar]
- McKay D.B. 1993. Structure and mechanism of 70-kDa heatshock-related proteins. Adv. Prot. Chem. 44: 67-97. [DOI] [PubMed] [Google Scholar]
- Mosser D.D., Caron, A.W., Bourget, L., Denis-Larose, C., and Massie, B. 1997. Role of the human heat shock protein hsp70 in protection against stress-induced apoptosis. Mol. Cell. Biol. 17: 5317-5327. [DOI] [PMC free article] [PubMed] [Google Scholar]
- Nollen E.A., Brunsting, J.F., Roelofsen, H., Weber, L.A., and Kampinga, H.H. 1999. In vivo chaperone activity of heat shock protein 70 and thermotolerance. Mol. Cell. Biol. 19: 2069-2079. [DOI] [PMC free article] [PubMed] [Google Scholar]
- Nylandsted J., Rohde, M., Brand, K., Bastholm, L., Elling, F., and Jäättelä, M. 2000. Selective depletion of heat shock protein 70 (Hsp70) activates a tumor-specific death program that is independent of caspases and bypasses Bcl-2. Proc. Natl. Acad. Sci. 97: 7871-7876. [DOI] [PMC free article] [PubMed] [Google Scholar]
- Nylandsted J., Wick, W., Hirt, U.A., Brand, K., Rohde, M., Leist, M., Weller, M., and Jäättelä, M. 2002. Eradication of glioblastoma, and breast and colon carcinoma xenografts by Hsp70 depletion. Cancer Res. 62: 7139-7142. [PubMed] [Google Scholar]
- Nylandsted J., Gyrd-Hansen, M., Danielewich, A., Fehrenbacher, N., Lademann, U., Høyer-Hansen, M., Weber, E., Multhoff, G., Rohde, M., and Jäättelä, M. 2004. Hsp70 promotes cell survival by inhibiting lysosomal membrane permeabilization. J. Exp. Med. 200: 425-435. [DOI] [PMC free article] [PubMed] [Google Scholar]
- Paralkar V.M., Vail, A.L., Grasser, W.A., Brown, T.A., Xu, H., Vukicevic, S., Ke, H.Z., Qi, H., Owen, T.A., and Thompson, D.D. 1998. Cloning and characterization of a novel member of the transforming growth factor-β/bone morphogenetic protein family. J. Biol. Chem. 273: 13760-13767. [DOI] [PubMed] [Google Scholar]
- Pelham H.R.B. 1984. Hsp70 accelerates the recovery of nucleolar morphology after heat shock. EMBO J. 3: 3095-3100. [DOI] [PMC free article] [PubMed] [Google Scholar]
- Seo J.S., Park, Y.M., Kim, J.I., Shim, E.H., Kim, C.W., Jang, J.J., Kim, S.H., and Lee, W.H. 1996. T cell lymphoma in transgenic mice expressing the human Hsp70 gene. Biochem. Biophys. Res. Commun. 218: 582-587. [DOI] [PubMed] [Google Scholar]
- Simon M.M., Krone, C., Schwarz, A., Luger, T.A., Jäättelä, M., and Schwarz, T. 1995. Heat shock protein 70 overexpression affects the response to ultraviolet light in murine fibroblasts. Evidence for increased cell viability and suppression of cytokine release. J. Clin. Invest. 95: 926-933. [DOI] [PMC free article] [PubMed] [Google Scholar]
- Son W.Y., Hwang, S.H., Han, C.T., Lee, J.H., Kim, S., and Kim, Y.C. 1999. Specific expression of heat shock protein HspA2 in human male germ cells. Mol. Hum. Reprod. 5: 1122-1126. [DOI] [PubMed] [Google Scholar]
- Son W.Y., Han, C.T., Hwang, S.H., Lee, J.H., Kim, S., and Kim, Y.C. 2000. Repression of hspA2 messenger RNA in human testes with abnormal spermatogenesis. Fertil. Steril. 73: 1138-1144. [DOI] [PubMed] [Google Scholar]
- Tan M., Wang, Y., Guan, K., and Sun, Y. 2000. PTGF-β, a type β transforming growth factor (TGF-β) superfamily member, is a p53 target gene that inhibits tumor cell growth via TGF-β signaling pathway. Proc. Natl. Acad. Sci. 97: 109-114. [DOI] [PMC free article] [PubMed] [Google Scholar]
- Tavaria M., Gabriele, T., Kola, I., and Anderson, R.L. 1996. A hitchhiker's guide to the human Hsp70 family. Cell Stress Chaperones 1: 23-28. [DOI] [PMC free article] [PubMed] [Google Scholar]
- Vargas-Roig L.M., Fanelli, M.A., Lopez, L.A., Gago, F.E., Tello, O., Aznar, J.C., and Ciocca, D.R. 1997. Heat shock proteins and cell proliferation in human breast cancer biopsy samples. Cancer Detect. Prev. 21: 441-451. [PubMed] [Google Scholar]
- Vargas-Roig L.M., Gago, F.E., Tello, O., Aznar, J.C., and Ciocca, D.R. 1998. Heat shock protein expression and drug resistance in breast cancer patients treated with induction chemotherapy. Intl. J. Cancer 79: 468-475. [DOI] [PubMed] [Google Scholar]
- Vayssier M., Banzet, N., Francois, D., Bellmann, K., and Polla, B.S. 1998. Tobacco smoke induces both apoptosis and necrosis in mammalian cells: Differential effects of HSP70. Am. J. Physiol. 275: L771-L779. [DOI] [PubMed] [Google Scholar]
- Volloch V.Z. and Sherman, M.Y. 1999. Oncogenic potential of Hsp72. Oncogene 18: 3648-3651. [DOI] [PubMed] [Google Scholar]
- Wei Y., Zhao, X., Kariya, Y., Teshigawara, K., and Uchida, A. 1995. Inhibition of proliferation and induction of apoptosis by abrogation of heat-shock protein (HSP) expression in tumor cells. Cancer Immunol. Immunother. 40: 73-78. [DOI] [PMC free article] [PubMed] [Google Scholar]
- Wilson L.C., Baek, S.J., Call, A., and Eling, T.E. 2003. Nonsteroidal anti-inflammatory drug-activated gene (NAG-1) is induced by genistein through the expression of p53 in colorectal cancer cells. Intl. J. Cancer 105: 747-753. [DOI] [PubMed] [Google Scholar]
- Xanthoudakis S. and Nicholson, D.W. 2000. Heat-shock proteins as death determinants. Nat. Cell Biol. 2: E163-E165. [DOI] [PubMed] [Google Scholar]
- Zhu D., Dix, D.J., and Eddy, E.M. 1997. HSP70-2 is required for CDC2 kinase activity in meiosis I of mouse spermatocytes. Development 124: 3007-3014. [DOI] [PubMed] [Google Scholar]