

ABSTRACT
Mice expressing reduced levels of ERCC1‐XPF (Ercc1 −/Δ mice) demonstrate premature onset of age‐related changes due to decreased repair of DNA damage. Muscle‐derived stem/progenitor cells (MDSPCs) isolated from Ercc1 −/Δ mice have an impaired capacity for cell differentiation. The mammalian target of rapamycin (mTOR) is a critical regulator of cell growth in response to nutrient, hormone, and oxygen levels. Inhibition of the mTOR pathway extends the lifespan of several species. Here, we examined the role of mTOR in regulating the MDSPC dysfunction that occurs with accelerated aging. We show that mTOR signaling pathways are activated in Ercc1 −/Δ MDSPCs compared with wild‐type (WT) MDSPCs. Additionally, inhibiting mTOR with rapamycin promoted autophagy and improved the myogenic differentiation capacity of the Ercc1 −/Δ MDSPCs. The percent of apoptotic and senescent cells in Ercc1 −/Δ MDSPC cultures was decreased upon mTOR inhibition. These results establish that mTOR signaling contributes to stem cell dysfunction and cell fate decisions in response to endogenous DNA damage. Therefore, mTOR represents a potential therapeutic target for improving defective, aged stem cells. © 2016 The Authors. Journal of Orthopaedic Research Published by Wiley Periodicals, Inc. on behalf of Orthopaedic Research Society. J Orthop Res 35:1375–1382, 2017.
Keywords: biology, muscle, ERCC1‐XPF, mTOR, stem cells, aging, progeria, senescence
Aging can be viewed as a progressive decline in the function of cells, tissues, and organs. The molecular basis underlying aging and age‐related degenerative changes remains unclear1; however, it is believed that these changes are driven by time‐dependent accumulation of stochastic molecular and cellular damage.1, 2 Consistent with this theory, the majority of human progeroid syndromes, or diseases of accelerated aging, are caused by defects in mechanisms required for genome maintenance.3 This suggests that DNA damage is one type of stochastic molecular instability that promotes age‐related degenerative changes.
Murine models of progeroid syndromes have been studied extensively, with the aim of elucidating the relationship between DNA damage and age‐related functional decline. Excision repair cross‐complementation group 1 (ERCC1) and xeroderma pigmentosum complementation group F (XPF) form a heterodimeric endonuclease that is required for numerous DNA repair mechanisms.4, 5 XPF encodes the catalytic subunit of the endonuclease, while ERCC1 serves as an essential binding partner that enables the repair of damaged DNA.6 Reduced expression of XPF due to a mutation in the XPF gene causes XFE progeroid syndrome.7 This was recapitulated in the mouse by a mutation of the mErcc1 locus to titrate the expression of ERCC1‐XPF.8 Ercc1 −/Δ mice, harboring one knock‐out and one hypomorphic allele of Ercc1, express 5–10% of the normal level of the nuclease and have a maximum lifespan of 28 weeks.9 These mice demonstrate spontaneous and premature onset of age‐related changes in the epidermal, hematopoietic, endocrine, hepatobiliary, renal, nervous, and musculoskeletal systems, identical to XFE progeroid syndrome.9, 10, 11, 12, 13 In addition, the alterations in histopathology, pathophysiology, and genome‐wide transcriptional reprogramming observed in this animal model correlate with those observed in naturally aged mice.14
Muscle‐derived stem/progenitor cells (MDSPCs) are multipotent cells isolated from postnatal skeletal muscle through an established preplate technique.15, 16, 17 They exhibit many important stem cell characteristics including long‐term proliferation, resistance to oxidative and inflammatory stresses, multi‐lineage differentiation, and self‐renewal capacities. MDSPCs can improve the regeneration of bone, and skeletal and cardiac muscle, mainly through the induction of neovascularization.15, 18, 19, 20 A recent study demonstrated that cell proliferation and multi‐lineage differentiation of MDSPCs isolated from progeroid Ercc1 −/Δ mice were comparable to those of MDSPCs isolated from old WT mice, but considerably impaired relative to those of MDSPCs isolated from young‐WT mice.21 Furthermore, fewer cells expressing stem/progenitor cell markers were found in the skeletal muscle of these progeroid mice compared to young‐WT mice.21 The reduction in number and increased dysfunction of MDSPCs contributes to age‐related loss of tissue function since the transplantation of functional young‐WT MDSPCs into progeroid mice extends their lifespan and healthspan.21 This is also the case with naturally aged normal rodents; transplantation of mesenchymal stem cells extends the health and lifespan of old rats.22
It has been proposed that the mammalian target of rapamycin (mTOR) signaling pathways play a role in the progression of aging,23 and it has been shown that inhibiting mTOR in yeast, worms, and flies extends their life‐spans.24, 25 Notably, rapamycin, an inhibitor of mTOR, administered at a late stage in the life of genetically heterogeneous mice, significantly extends their lifespan.26 Downstream factors in the mTOR pathway including the 70‐kDa ribosomal protein S6 kinase (p70S6K) and eIF4‐Ebinding protein 1 (4E‐BP1) bind to mRNA and regulate translation, thereby controlling the rate of protein synthesis and consequently cell growth.27 Increased lifespan could also be explained by increased autophagy in response to mTOR inhibition. Autophagy is the controlled self‐degradation of damaged, redundant, or hazardous cellular components, ranging from individual proteins (microautophagy) to entire organelles (macroautophagy). Both protein synthesis and autophagy are considered to be critical in the regulation of lifespan by mTOR.28
The purpose of this study was to determine if mTOR signaling also plays a role in stem cell dysfunction as it relates to aging. We hypothesized that inhibiting mTOR would rescue the defect, at least in part, in Ercc1 −/Δ MDSPCs, and could represent a target to delay aging. Our study not only demonstrates a correlation between MDSPC dysfunction and mTOR activity, but also shows that exposing progeroid MDSPCs to rapamycin promoted myogenic differentiation, while attenuating apoptosis and cellular senescence.
MATERIALS AND METHODS
Isolation of MDSPCs
All animal experiments were performed with the approval of the University of Pittsburgh's Institutional Animal Care and Use Committee. MDSPCs were isolated via a modified preplate technique, as previously described,15, 16, 21 from adult WT (19‐week‐old) and progeroid Ercc1 −/Δ (19‐week‐old) mice (n = 4 per strain), which were bred at the University of Pittsburgh's Division of Laboratory Animal Research. MDSPCs were cultured in proliferation medium (PM), which contains Dulbecco's modified Eagle's medium (DMEM), 10% fetal bovine serum (FBS), 10% horse serum, 1% penicillin/streptomycin (all from Invitrogen,, Waltham, MA), and 0.5% chick embryo extract (Accurate Chemical and Scientific Corporation, Westbury, NY). The isolated MDSPCs were plated on collagen type I‐coated 25 cm2 flasks at a density of 3 × 10⁵ cells per well in PM. At 70% confluence, the cells were dissociated with trypsin/EDTA, replated at a cell density of 1.0–2.5 × 10³ cells/cm2, and cultured for 3–4 weeks before performing the cell treatments described below.
Rapamycin Treatment
Rapamycin was obtained from LC Laboratories (Woburn, MA), dissolved in dimethyl sulphoxide (DMSO) at 50 mg/ml, and stored at −20°C. MDSPCs from Ercc1 −/Δ and WT mice were treated with 10 nM rapamycin in order to inhibit mTOR. As a control, the same amount of DMSO was used to treat MDSPCs from these two populations.
Proliferation Assay
MDSPCs were plated on collagen type I‐coated 25 cm2 flasks at a density of 2,000 cells per well. Live‐cell imaging was performed using an imaging system equipped with a 20× objective lens (Automated Cell Technologies, Pittsburgh, PA). Images were obtained at 10 min intervals over a period of 72 h, and 10 of these images were randomly selected for analysis at four separate time points during the experiment (0, 24, 48, and 72 h).
Apoptosis Assay
Apoptotic cell death was evaluated in cultured cells using the In situ Cell Death Detection kit containing fluorescein (Roche Applied Science, Penzberg, Germany) for TUNEL detection according to the manufacturer's protocol. To visualize the nuclei, the cultures were incubated with 4′,6‐diamidino‐2‐phenylindole (DAPI) for 10 min. The presence of fluorescein as a cell death marker was visualized using a Leica DMIRB microscope. The number of cells that were TUNEL‐positive was calculated and averaged across 15 fields each from three replicate plates for each of four independent experiments. The percentage of apoptotic cells was calculated as TUNEL‐positive cells divided by the total number of cells, and then multiplied by 100.
Cellular Senescence Assay
Cellular senescence was evaluated in cultured cells using a Senescence β‐Galactosidase Staining Kit (Cell Signaling Technology, Danvers, MA) to measure SA‐β‐gal activity, according to the manufacturer's protocol. Images were captured using a Leica DMIRB microscope. The number of cells that were SA‐β‐gal‐positive was calculated and averaged across 15 fields each from three replicate plates for each of four independent experiments. The percentage of senescent cells was calculated as SA‐β‐gal‐positive cells divided by the total number of cells and then multiplied by 100.
Myogenic Differentiation Assay
MDSPCs were plated in PM at a density of 1,000 cells/cm2 and cultured for 3 days. The cells were then placed in DMEM supplemented with 2% FBS for an additional 4 days to induce myogenic differentiation, as described previously,21 with or without 10 nM rapamycin. On day 7, immunostaining was performed to detect fast myosin heavy chain (f‐MyHC) expression, a marker of terminal myogenic differentiation. Cold methanol‐fixed cultures were blocked with 5% goat serum and incubated with f‐MyHC mouse monoclonal antibody (1:250; Sigma–Aldrich, St. Louis, MO), secondary biotinylated IgG (1:250; Vector Laboratories, Burlingame, CA) for 1 h, and streptavidin‐594 (1:500; Sigma–Aldrich) for 15 min to fluorescently label the myotubes. Nuclei were counter stained with DAPI (100 ng/ml; Sigma–Aldrich) for 10 min. The presence of fluorescein was visualized using a Leica DMIRB microscope equipped with a Retiga digital camera and evaluated using Northern Eclipse software (v. 6.0; Empix Imaging). Myogenic differentiation was calculated as the percentage of cells expressing f‐MyHC. Data from three replicate plates from each of four independent experiments were analyzed. Total RNA was also extracted as described below for quantitative reverse transcription polymerase chain reaction (qRT‐PCR) analysis. Expression of the myogenic genes MyHC and Desmin were also analyzed.
SDS–PAGE and Immunoblotting
Cells were lyzed in Laemmli Sample Buffer (Bio‐Rad Laboratories, Hercules, CA), boiled for 5 min, and centrifuged at 4,000 rpm for 5 min. The samples were loaded on a 4–12% SDS–polyacrylamide gel, transferred to an Immobilon polyvinyl difluoride (PVDF) transfer membrane (Merck Millipore, Billerica, MA) and probed with primary antibodies followed by horseradish peroxidase (HRP)‐conjugated secondary antibody. Proteins were visualized with ECL Plus reagent (GE Healthcare, Chicago, IL), and the chemical luminescent reaction visualized using a FOTO/Analyst Luminary/Fx CCD imaging system (Fotodyne, Inc., Hartland, WI). The following antibodies were used in this study: Rabbit anti‐mTOR, rabbit anti‐phospho‐mTOR (p‐mTOR), rabbit anti‐phospho‐4E‐BP1 (p‐4E‐BP1) (Thr37/46), rabbit anti‐phospho‐p70‐S6 (p‐p70‐S6) kinase (Thr389), rabbit anti‐LC3, rabbit anti‐poly (ADP‐ribose) polymerase (PARP), rabbit anti‐p16, rabbit anti‐p21, rabbit anti‐glyceraldehyde phosphate dehydrogenase (GAPDH), HRP‐conjugated goat anti‐rabbit IgG, and HRP‐conjugated goat anti‐mouse IgG (all antibodies were from Cell Signaling Technology). The intensities of the bands were quantified using image analysis software, ImageJ version (NIH Image). Values were normalized relative to GAPDH expressions.
RNA Isolation and Quantitative RT‐PCR
Total RNA was extracted using the QIAshredder homogenizer and the RNeasy Mini kit (Qiagen; Venlo, Netherlands) according to the manufacturer's protocol. One microgram of total RNA was used for random hexamer‐primed cDNA synthesis using a Super Script II pre‐amplification system (Invitrogen). Quantitative RT‐PCR reactions were performed in triplicate using iQ5 (Bio‐Rad) and Maxima SYBR Green/ROX qPCR Master Mix (Thermo Fisher Scientific, Waltham, MA) and 300 nM of each of the primers. The primers were designed based on the sequences in the GenBank database. The primer pairs used for this study are shown in Table 1. Electrophoretic separation on a 2.5% agarose gel was performed to ensure accurate outcomes of the reactions.
Table 1.
Primer Sequences and Product Side for Real‐Time PCR
| Gene | 5′ DNA Sequence 3′ | Amplicon Length (bp) | |
|---|---|---|---|
| MyHC | Forward | 5′‐CCAGGCTGCGGAGGCAATCA‐3′ | 115 |
| Reverse | 5′‐GGCCAGCTGCTCTTTCAGGTCG‐3′ | ||
| Desmin | Forward | 5′‐TTCCCTCGAGCAGGCTTCGG‐3′ | 147 |
| Reverse | 5′‐GCCATAGGATGGCGCTCGGG‐3′ | ||
| GAPDH | Forward | 5′‐CCGTCGTGGATCTGACGTG‐3′ | 146 |
| Reverse | 5′‐GTTGCTGTTGAAGTCGCAGG‐3′ |
Statistical Analysis
The data were expressed as the mean ± standard deviation (SD). For multiple comparisons, one‐way ANOVA or the Kruskal–Wallis tests were applied. Pair‐wise multiple comparisons were performed using the Tukey–Kramer or Scheffe's post hoc test. Data analyses were performed using PASW Statistics 21 (SPSS, Chicago, IL). Statistical significance was accepted at p < 0.05.
RESULTS
mTOR Signaling Is Elevated in MDSPCs Isolated From Progeroid Ercc1 −/Δ Mice
To test the hypothesis that mTOR signaling contributes to the age‐related dysfunction seen in MDSPCs isolated from progeroid Ercc1 −/Δ mice, the phosphorylation of downstream signaling components of the mTOR pathway was examined by immunoblotting (Fig. 1A). The expression of p‐mTOR, p‐4E‐BP1, and p‐p70‐S6 kinase in Ercc1 −/Δ MDSPCs was increased compared with WT MDSPCs (p‐mTOR: p < 0.001, p‐4E‐BP1: p < 0.001, p‐p7‐S6: p < 0.001). Rapamycin treatment significantly decreased the expression of p‐mTOR and p‐p70‐S6 kinase in Ercc1 −/Δ MDSPCs (p‐mTOR: p < 0.001, p‐p7‐S6: p < 0.001). However, p‐4E‐BP1 was not significantly reduced upon rapamycin treatment (p = 0.506) (Fig. 1B). Of note, rapamycin had no significant effect on the baseline activity of mTOR in WT MDSPCs.
Figure 1.
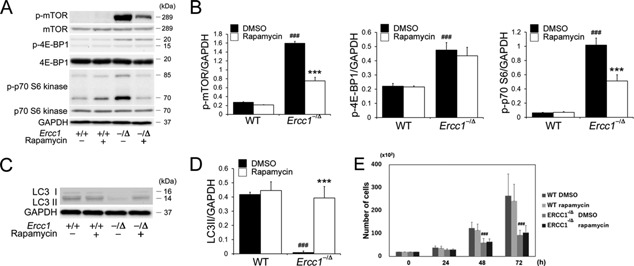
Measuring mTOR activity and autophagy in MDSPCs isolated from progeroid Ercc1 −/Δ mice. (A) Shown is a representative image of immunoblotting to measure mTOR, p‐mTOR, p‐4E‐BP1, and p‐p70 S6 expression in MDSPCs isolated from Ercc1 −/Δ and WT mice cultured with and without rapamycin. (B) Quantification of p‐mTOR, p‐4E‐BP1, and p‐p70 S6 expression relative to GAPDH. Error bars indicate the standard deviation. Statistical significance was determined using one‐way ANOVA or the Kruskal–Wallis test with Tukey–Kramer or Scheffe's post hoc test (n = 4). ### p < 0.001 versus WT‐DMSO, ***p < 0.001 versus ERCC1 −/Δ‐DMSO. (C) Representative image of immunoblotting to measure autophagy markers LC3 I and II expression in MDSPCs isolated from Ercc1 −/Δ and WT mice cultured with and without rapamycin. (D) Quantification of LC3II expression relative to GAPDH expression. Error bars indicate the standard deviation. Statistical significance was determined using the Kruskal–Wallis test with Scheffe's post hoc test (n = 4). ### p < 0.001 versus WT‐DMSO, ***p < 0.001 versus Ercc1 −/Δ‐DMSO. (E) Proliferation of MDSPCs measured using live‐cell imaging. Error bars indicate the standard deviation. Statistical significance was determined using one‐way ANOVA with Tukey–Kramer post hoc test (n = 4). ### p < 0.001 versus WT‐DMSO.
Rapamycin Increases Autophagy in MDSPCs Isolated From Progeroid Ercc1 −/Δ Mice
Recent studies have provided evidence that a decline in autophagy, which is regulated by mTOR, contributes to aging.29, 30 We next measured LC3 expression, which correlates with autophagic activity.31 Immunoblotting analysis revealed that the amount of LC3‐II was significantly lower in Ercc1 −/Δ MDSPCs compared to WT MDSPCs (p < 0.001) (Fig. 1C and D). Treatment with rapamycin significantly increased the amount of LC3‐II in the Ercc1 −/Δ MDSPC population (p < 0.001) (Fig. 1D).
Rapamycin Increases the Proliferation Capacity of MDSPCs From Progeroid Mice
Proliferation of MDSPCs, measured by live cell imaging, was significantly lower in isolates from Ercc1 −/Δ mice, compared to MDSPCs from WT mice, at both 48 and 72 h (p < 0.001). Treatment of the cells with rapamycin had no effect on the proliferation capacity of MDSPCs of either genotype (Fig. 1E).
Rapamycin Decreases Apoptosis of MDSPCs From Progeroid Mice
Some adult stem cell populations are dramatically affected by stress, leading to increased apoptosis.32 We next determined the level of apoptosis in MDSPCs using the TUNEL assay. The percent of TUNEL‐positive cells was significantly higher among Ercc1 −/Δ MDSPCs than among WT MDSPCs (p < 0.001) (Fig. 2A and B). Rapamycin treatment significantly (p < 0.001) reduced the percentage of TUNEL‐positive cells among Ercc1 −/Δ MDSPCs (Fig. 2B). Furthermore, an increase in the expression of cleaved PARP (apoptosis marker) was detected in MDSPCs from progeroid Ercc1 −/Δ mice relative to WT MDSPCs, and rapamycin treatment of the cells attenuated the expression of this apoptotic marker (Fig. 2C).
Figure 2.

Measuring the effect of rapamycin on apoptosis in MDSPCs isolated from progeroid Ercc1 −/Δ mice. (A) Representative images of TUNEL assay. Live cells (DAPI: blue), apoptotic cells (yellow–green), and merged figures. Scale bar = 100 µm. (B) The percentage of TUNEL‐positive cells was counted from images obtained from four independent MDSPC populations per genotype and treatment group. Error bars indicate the standard deviation. ### p < 0.001 versus WT‐DMSO, ***p < 0.001 versus ERCC1 −/Δ‐DMSO. Statistical significance was determined using the Kruskal–Wallis test with Scheffe's post hoc test. (C) Immunoblotting to measure the expression of cleaved PARP, an apoptosis‐related marker, in MDSPCs isolated from Ercc1 −/Δ and WT mice cultured with and without rapamycin.
Rapamycin Decreases Premature Senescence of MDSPCs From Progeroid Mice
Cellular senescence is characterized by cell cycle arrest, which leads to an irreversible loss of the self‐renewal and differentiation capacities of stem cells.33 To determine the extent of senescence in MDSPCs isolated from Ercc1 −/Δ mice, senescence‐associated beta‐galactosidase (SA‐β‐gal) activity was measured. The percentage of SA‐β‐gal‐positive cells was significantly higher in Ercc1 −/Δ MDSPCs than in WT MDSPCs (p < 0.001) (Fig. 3A). However, rapamycin treatment reduced the percentage of SA‐β‐gal‐positive Ercc1 −/Δ MDSPCs (p < 0.001) (Fig. 3A). Moreover, increased expression of p16 and p21 were detected in the progeroid Ercc1 −/Δ MDSPCs compared to WT MDSPCs, and rapamycin treatment resulted in the lowered expression of these cell senescence markers in Ercc1 −/Δ MDSPCs (Fig. 3B).
Figure 3.
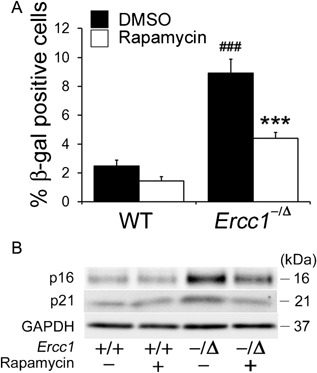
Measuring the effect of rapamycin on senescence in MDSPCs isolated from progeroid Ercc1 −/Δ mice. (A) The histogram indicates the percent of SA β‐gal‐positive cells from four independent MDSPC populations from each genotype and treatment group. Error bars indicate the standard deviation. ### p < 0.001 versus WT‐DMSO, ***p < 0.001 versus Ercc1 −/Δ‐DMSO. Statistical significance was determined using one‐way ANOVA test with Scheffe's post hoc test. (B) Immunoblotting to measure the expression of senescence‐related markers p16 and p21 in MDSPCs isolated from Ercc1 −/Δ and WT mice cultured with and without rapamycin.
Rapamycin Improves the Myogenic Differentiation Capacity of MDSPCs From Progeroid Mice
To determine whether the myogenic differentiation capacity of MDSPCs isolated from progeroid Ercc1 −/Δ mice is affected by mTOR signaling, the cells were cultured to confluence and then switched to differentiation medium. In the presence or absence of rapamycin, WT MDSPCs fused to form multinucleated myotubes expressing f‐MyHC, a marker of terminal myogenic differentiation (Fig. 4A and B). In contrast, cultures of MDSPCs isolated from the progeroid Ercc1 −/Δ mice had significantly fewer f‐MyHC expressing cells, indicating an impairment in their differentiation capacity (p < 0.001) (Fig. 4B). Interestingly, rapamycin significantly improved the myogenic differentiation capacity of the Ercc1 −/Δ MDSPCs (p < 0.001) (Fig. 4A and B). Impaired differentiation of Ercc1 −/Δ MDSPCs was confirmed by measuring the expression of the myogenic differentiation markers myosin heavy chain (MyHC) and desmin. The expression levels of MyHC and desmin were significantly lower in MDSPCs isolated from the progeroid mice than in WT MDSPCs (MyHC: p < 0.001, desmin: p < 0.001). The expression levels of both proteins were increased upon rapamycin treatment (MyHC: p < 0.001, desmin: p = 0.002, respectively) (Fig. 4C and D).
Figure 4.
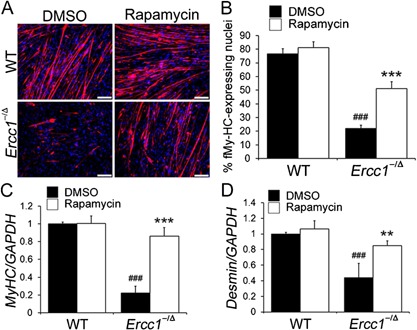
Measuring the effect of rapamycin on the myogenic differentiation of MDSPCs isolated from progeroid Ercc1 −/Δ mice. (A) Images of in vitro myogenic differentiation. Cells were immunostained for the terminal differentiation marker, f‐MyHC (red). Scale bar = 50 µm. (B) Quantification of myogenic differentiation was calculated as the fraction of cells (DAPI, blue) expressing f‐MyHC (red) from four independent MDSPC populations. Error bars indicate the standard deviation. Statistical significance was determined using one‐way ANOVA test with Tukey–Kramer post hoc test. ### p < 0.001 versus WT‐DMSO, ***p < 0.001 versus Ercc1 −/Δ‐DMSO. (C and D). Quantitative RT‐PCR to measure the expression levels of the myogenic differentiation markers MyHC and desmin after myogenic differentiation of MDSPCs isolated from Ercc1 −/Δ and WT mice, cultured with and without rapamycin. Error bars indicate the standard deviation. Statistical significance was determined using one‐way ANOVA test with Tukey–Kramer or Scheffe's post hoc test (n = 4). ### p < 0.001 versus WT‐DMSO, **p < 0.01, ***p < 0.001 versus Ercc1 −/Δ‐DMSO.
DISCUSSION
In this study, we examined the role that mTOR plays in the myogenic differentiation, apoptosis, and senescence of MDSPCs isolated from a murine model of a human progeroid syndrome. Previous studies established that the cell proliferation and myogenic differentiation capacities of MDSPCs isolated from progeroid Ercc1 −/Δ mice are similar to MDSPCs isolated from naturally aged mice and were significantly impaired relative to that of MDSPCs isolated from young‐WT mice.21 Furthermore, fewer cells expressing stem/progenitor cell markers could be isolated from the skeletal muscle of these progeroid Ercc1 −/Δ mice than from young‐WT mice.21 Here, we demonstrate that MDSPCs isolated from this murine model of accelerated aging exhibit increased mTOR expression and a reduction in autophagy. Inhibiting mTOR in this adult stem cell population improved the myogenic capacity of the progeroid MDSPCs.
mTOR is a protein kinase that helps to integrate cellular activities in response to nutrients, stress, and extra‐cellular signals, including hormones and locally produced growth factors.34 The mTOR signaling pathways play multiple roles in adult animals that are involved in cell growth, aging, cancer, and metabolic disorders.35 Hyperactivation of mTOR signaling has been reported in the cardiac and skeletal muscles of progeroid Lmna−/− mice.36 In accordance with these observations, hematopoietic stem cells (HSCs) from old mice have elevated mTOR activity, and increasing mTOR signaling in young mice induces premature aging.37 Here, we show that mTOR activity is higher in MDSPCs isolated from progeroid mice than in WT MDSPCs (Fig. 1). These observations suggest that abnormally increased activation of the mTOR pathway could be involved in stem cell exhaustion/depletion, which has been linked with an accelerated aging phenotype.38
mTOR regulates protein synthesis through the phosphorylation of 4E‐BP1 and p70‐S6.27 Our results demonstrate that the phosphorylation of 4E‐BP1 and p70‐S6 is increased in MDSPCs isolated from progeroid mice, and that the phosphorylation of p70‐S6 is decreased following treatment with rapamycin. However, phosphorylation of the mTOR target 4E‐BP1 does not change significantly following rapamycin treatment. Consistent with our findings, previous studies have reported that rapamycin has a greater effect on p70‐S6 kinase phosphorylation than on 4E‐BP1 phosphorylation.39 p70‐S6 is among the major downstream targets of the mTOR pathway; deletion of the p70‐S6 gene increases lifespan in mice40 and retards the aging of bone, the immune system, and skeletal muscle.41
Another important function of the mTOR signaling pathway is the regulation of autophagy, a process in which the cell degrades damaged or excess cellular components, ranging from individual proteins and protein aggregates to whole organelles, through the lysosomal machinery of the cell. Recent studies have provided evidence that insufficient autophagy is implicated in normal aging.29, 30, 42, 43 Stem cells lose their capacity to self‐renew and differentiate when autophagy is disrupted; hence, the cells essentially lose their “stemness.”44 Interestingly, rapamycin treatment activates the clearance of progerin and consequently slows down the accelerated aging process.45 In MDSPCs from progeroid Ercc1 −/Δ mice, autophagy is significantly impaired relative to MDSPCs isolated from WT mice, but significantly increased in the presence of rapamycin. Therefore, it is possible that the loss of the differentiation potential of the MDSPCs is partially due to insufficient autophagy.
MDSPCs isolated from progeroid Ercc1 −/Δ mice have significantly fewer f‐MyHC expressing cells, consistent with their reduced myogenic differentiation capacity. However, inhibition of mTOR using rapamycin restores, at least in part, the myogenic differentiation capacity of MDSPCs. These results suggest that autophagy plays a crucial role in differentiation by regulating the efficient removal of sets of transcription factors, enzymes, adhesion molecules, or secreted factors.46 Recent studies reported that the inhibition of mTOR with rapamycin triggers a negative feedback loop that results in the activation of Akt signaling.47, 48, 49 Sandri et al. demonstrated that phosphoinositide 3 (PI‐3) kinase‐Akt signaling inhibits Forkhead box O (Foxo) and atrogin‐1 expression, which causes atrophy of myotubes and muscle fibers.50 Akt signaling in skeletal muscle increases the production of MyHC isoforms and improves muscle mass and function.51
Apoptosis and senescence are well‐documented cellular responses to DNA damage.52, 53 MDSPCs isolated from progeroid Ercc1 −/Δ mice display significantly greater amounts of apoptosis and cellular senescence compared to MDSPCs isolated from WT mice. This finding is consistent with previous studies in which cells isolated from progeroid Ercc1 −/Δ mice showed higher rates of apoptosis and cellular senescence.11, 54 The apoptosis and senescence of MDSPCs isolated from progeroid mice are reduced when mTOR is inhibited with rapamycin. Hence, the decreased capacity for myogenic differentiation of MDSPCs could be due in part to an increase in the levels of apoptosis and cellular senescence.55 The proliferation ability of Ercc1 −/Δ MDSPCs was significantly lower than that of WT‐MDSPCs, a result similar to that of a previous study from our laboratory.21 However, rapamycin did not appear to influence the proliferation capacity of Ercc1 −/Δ MDSPCs (Fig. 1E).
This study has several limitations that should be noted. First, we did not evaluate the effects of rapamycin treatment using an in vivo model. We would like to pursue this line of in vivo research in the future, but it is clear that the dosage and timing of rapamycin treatment will need to be optimized prior to determining the effect of rapamycin on the accelerated aging phenotype displayed by Ercc1 −/Δ mice. Second, we did not evaluate the effects of rapamycin treatment on the osteogenic differentiation capacities of Ercc1 −/Δ MDSPCs. In terms of age‐related functional decline, it is well known that reduced bone mineral density is a common feature of the aging skeleton. In a previous study, we showed that MDSPCs from Ercc1 −/Δ mice have limited osteogenic potential.21 The effect of rapamycin on the multi‐lineage differentiation potential of MDSPCs beyond myogenesis requires further investigation. Finally, musculoskeletal tissues are highly adaptable and many signaling pathways, such as Akt signaling and Wnt signaling, among others, regulate muscle remodeling; therefore, the implication of these signaling pathways on the beneficial effect of rapamycin on progeria MDSPCs remains to be elucidated.
In conclusion, our results demonstrate that inhibiting mTOR with rapamycin improves the myogenic differentiation potentials of progeroid Ercc1 −/Δ MDSPCs by decreasing the percentage of cells undergoing apoptosis, attenuating the rate of senescence, and promoting autophagy. The results from our current study provide novel insights into the spontaneous and premature onset of age‐related changes associated with progeria, and the role of mTOR on the accelerated aging of adult stem cells.
AUTHORS’ CONTRIBUTIONS
KT, YK, and JH designed the research; KT, YK, ML, XM, and TY conducted the research; KT, YK, ML, PDR, and LJN analyzed the data; KT, YK, ML, JHC, RK, MK, FHF, and JH interpreted the data and drafted the manuscript; JH had primary responsibility for the final content. All authors have read and approved the final submitted manuscript.
ACKNOWLEDGMENTS
This project was funded in part by two NIH grants: R21 AG033907 (JH) and PO1 AG043376 (PR, JH, LN) and the Henry J. Mankin Endowed Chair at the University of Pittsburgh. The authors are grateful for the technical and scientific advice provided by Jessica Tebbets and Haizi Cheng, and the editorial assistance of Lavanya Rajagopalan, Bria King, and Ryan Warth.
[Correction added on 29 September 2016, after first online publication: Correct version of the manuscript presented here.]
Koji Takayama and Yohei Kawakami contributed equally to this work.
Conflicts of interest: Johnny Huard wishes to disclose that he has received remuneration as a consultant and royalties from Cook Myosite, Inc. PR and LN receive research support from Aldabra Biosciences, of which they are cofounders.
REFERENCES
- 1. Kirkwood TB. 2005. Understanding the odd science of aging. Cell 120:437–447. [DOI] [PubMed] [Google Scholar]
- 2. Vijg J. 2008. The role of DNA damage and repair in aging: new approaches to an old problem. Mech Ageing Dev 129:498–502. [DOI] [PubMed] [Google Scholar]
- 3. Vermeij WP, Hoeijmakers JH, Pothof J. 2016. Genome integrity in aging: human syndromes, mouse models, and therapeutic options. Annu Rev Pharmacol Toxicol 56:427–445. [DOI] [PubMed] [Google Scholar]
- 4. Ahmad A, Robinson AR, Duensing A, et al. 2008. ERCC1‐XPF endonuclease facilitates DNA double‐strand break repair. Mol Cell Biol 28:5082–5092. [DOI] [PMC free article] [PubMed] [Google Scholar]
- 5. Niedernhofer LJ, Odijk H, Budzowska M, et al. 2004. The structure‐specific endonuclease Ercc1‐Xpf is required to resolve DNA interstrand cross‐link‐induced double‐strand breaks. Mol Cell Biol 24:5776–5787. [DOI] [PMC free article] [PubMed] [Google Scholar]
- 6. Sijbers AM, de Laat WL, Ariza RR, et al. 1996. Xeroderma pigmentosum group F caused by a defect in a structure‐specific DNA repair endonuclease. Cell 86:811–822. [DOI] [PubMed] [Google Scholar]
- 7. Niedernhofer LJ, Garinis GA, Raams A, et al. 2006. A new progeroid syndrome reveals that genotoxic stress suppresses the somatotroph axis. Nature 444:1038–1043. [DOI] [PubMed] [Google Scholar]
- 8. Weeda G, Donker I, de Wit J, et al. 1997. Disruption of mouse ERCC1 results in a novel repair syndrome with growth failure, nuclear abnormalities and senescence. Curr Biol 7:427–439. [DOI] [PubMed] [Google Scholar]
- 9. Dolle ME, Kuiper RV, Roodbergen M, et al. 2011. Broad segmental progeroid changes in short‐lived Ercc1(‐/Delta7) mice. Pathobiol Aging Age Relat Dis 1. doi: 10.3402/pba.v1i0.7219 [DOI] [PMC free article] [PubMed] [Google Scholar]
- 10. Gregg SQ, Robinson AR, Niedernhofer LJ. 2011. Physiological consequences of defects in ERCC1‐XPF DNA repair endonuclease. DNA Repair (Amst) 10:781–791. [DOI] [PMC free article] [PubMed] [Google Scholar]
- 11. Cho JS, Kook SH, Robinson AR, et al. 2013. Cell autonomous and nonautonomous mechanisms drive hematopoietic stem/progenitor cell loss in the absence of DNA repair. Stem Cells 31:511–525. [DOI] [PMC free article] [PubMed] [Google Scholar]
- 12. Harkema L, Youssef SA, de Bruin A. 2016. Pathology of mouse models of accelerated aging. Vet Pathol 53:366–389. [DOI] [PubMed] [Google Scholar]
- 13. Gregg SQ, Gutierrez V, Robinson AR, et al. 2012. A mouse model of accelerated liver aging caused by a defect in DNA repair. Hepatology 55:609–621. [DOI] [PMC free article] [PubMed] [Google Scholar]
- 14. Schumacher B, van der Pluijm I, Moorhouse MJ, et al. 2008. Delayed and accelerated aging share common longevity assurance mechanisms. PLoS Genet 4:e1000161. [DOI] [PMC free article] [PubMed] [Google Scholar]
- 15. Qu‐Petersen Z, Deasy B, Jankowski R, et al. 2002. Identification of a novel population of muscle stem cells in mice: potential for muscle regeneration. J Cell Biol 157:851–864. [DOI] [PMC free article] [PubMed] [Google Scholar]
- 16. Gharaibeh B, Lu A, Tebbets J, et al. 2008. Isolation of a slowly adhering cell fraction containing stem cells from murine skeletal muscle by the preplate technique. Nat Protoc 3:1501–1509. [DOI] [PubMed] [Google Scholar]
- 17. Lavasani M, Lu A, Thompson SD, et al. 2013. Isolation of muscle‐derived stem/progenitor cells based on adhesion characteristics to collagen‐coated surfaces. Methods Mol Biol 976:53–65. [DOI] [PMC free article] [PubMed] [Google Scholar]
- 18. Peng H, Wright V, Usas A, et al. 2002. Synergistic enhancement of bone formation and healing by stem cell‐expressed VEGF and bone morphogenetic protein‐4. J Clin Invest 110:751–759. [DOI] [PMC free article] [PubMed] [Google Scholar]
- 19. Payne TR, Oshima H, Okada M, et al. 2007. A relationship between vascular endothelial growth factor, angiogenesis, and cardiac repair after muscle stem cell transplantation into ischemic hearts. J Am Coll Cardiol 50:1677–1684. [DOI] [PubMed] [Google Scholar]
- 20. Oshima H, Payne TR, Urish KL, et al. 2005. Differential myocardial infarct repair with muscle stem cells compared to myoblasts. Mol Ther 12:1130–1141. [DOI] [PubMed] [Google Scholar]
- 21. Lavasani M, Robinson AR, Lu A, et al. 2012. Muscle‐derived stem/progenitor cell dysfunction limits healthspan and lifespan in a murine progeria model. Nat Commun 3:608. [DOI] [PMC free article] [PubMed] [Google Scholar]
- 22. Kim D, Kyung J, Park D, et al. 2015. Health span‐extending activity of human amniotic membrane‐ and adipose tissue‐derived stem cells in F344 rats. Stem Cells Transl Med 4:1144–1154. [DOI] [PMC free article] [PubMed] [Google Scholar]
- 23. Blagosklonny MV. 2008. Aging: ROS or TOR. Cell Cycle 7:3344–3354. [DOI] [PubMed] [Google Scholar]
- 24. Kaeberlein M, Powers RW, 3rd , Steffen KK, et al. 2005. Regulation of yeast replicative life span by TOR and Sch9 in response to nutrients. Science 310:1193–1196. [DOI] [PubMed] [Google Scholar]
- 25. Vellai T, Takacs‐Vellai K, Zhang Y, et al. 2003. Genetics: influence of TOR kinase on lifespan in C. elegans. Nature 426:620. [DOI] [PubMed] [Google Scholar]
- 26. Harrison DE, Strong R, Sharp ZD, et al. 2009. Rapamycin fed late in life extends lifespan in genetically heterogeneous mice. Nature 460:392–395. [DOI] [PMC free article] [PubMed] [Google Scholar]
- 27. Ma XM, Blenis J. 2009. Molecular mechanisms of mTOR‐mediated translational control. Nat Rev Mol Cell Biol 10:307–318. [DOI] [PubMed] [Google Scholar]
- 28. Hansen M, Chandra A, Mitic LL, et al. 2008. A role for autophagy in the extension of lifespan by dietary restriction in C. elegans. PLoS Genet 4:e24. [DOI] [PMC free article] [PubMed] [Google Scholar]
- 29. Cavallini G, Donati A, Taddei M, et al. 2007. Evidence for selective mitochondrial autophagy and failure in aging. Autophagy 3:26–27. [DOI] [PubMed] [Google Scholar]
- 30. Ravikumar B, Vacher C, Berger Z, et al. 2004. Inhibition of mTOR induces autophagy and reduces toxicity of polyglutamine expansions in fly and mouse models of Huntington disease. Nat Genet 36:585–595. [DOI] [PubMed] [Google Scholar]
- 31. Mizushima N, Yoshimori T. 2007. How to interpret LC3 immunoblotting. Autophagy 3:542–545. [DOI] [PubMed] [Google Scholar]
- 32. Rossi DJ, Bryder D, Seita J, et al. 2007. Deficiencies in DNA damage repair limit the function of haematopoietic stem cells with age. Nature 447:725–729. [DOI] [PubMed] [Google Scholar]
- 33. Roobrouck VD, Ulloa‐Montoya F, Verfaillie CM. 2008. Self‐renewal and differentiation capacity of young and aged stem cells. Exp Cell Res 314:1937–1944. [DOI] [PubMed] [Google Scholar]
- 34. Martin DE, Hall MN. 2005. The expanding TOR signaling network. Curr Opin Cell Biol 17:158–166. [DOI] [PubMed] [Google Scholar]
- 35. Wullschleger S, Loewith R, Hall MN. 2006. TOR signaling in growth and metabolism. Cell 124:471–484. [DOI] [PubMed] [Google Scholar]
- 36. Ramos FJ. 2012. Rapamycin reverses elevated mTORC1 signaling in lamin A/C‐deficient mice, rescues cardiac and skeletal muscle function, and extends survival. Sci Transl Med 4. [DOI] [PMC free article] [PubMed] [Google Scholar]
- 37. Chen C, Liu Y, Zheng P. 2009. MTOR regulation and therapeutic rejuvenation of aging hematopoietic stem cells. Sci Signal 2:ra75. [DOI] [PMC free article] [PubMed] [Google Scholar]
- 38. Chen C, Liu Y, Liu R, et al. 2008. TSC‐mTOR maintains quiescence and function of hematopoietic stem cells by repressing mitochondrial biogenesis and reactive oxygen species. J Exp Med 205:2397–2408. [DOI] [PMC free article] [PubMed] [Google Scholar]
- 39. Feldman ME, Apsel B, Uotila A, et al. 2009. Active‐site inhibitors of mTOR target rapamycin‐resistant outputs of mTORC1 and mTORC2. PLoS Biol 7:e38. [DOI] [PMC free article] [PubMed] [Google Scholar]
- 40. Selman C, Tullet JM, Wieser D, et al. 2009. Ribosomal protein S6 kinase 1 signaling regulates mammalian life span. Science 326:140–144. [DOI] [PMC free article] [PubMed] [Google Scholar]
- 41. Miller RA, Harrison DE, Astle CM, et al. 2011. Rapamycin, but not resveratrol or simvastatin, extends life span of genetically heterogeneous mice. J Gerontol A Biol Sci Med Sci 66:191–201. [DOI] [PMC free article] [PubMed] [Google Scholar]
- 42. Hands SL, Proud CG, Wyttenbach A. 2009. MTOR's role in ageing: protein synthesis or autophagy? Aging (Albany NY) 1:586–597. [DOI] [PMC free article] [PubMed] [Google Scholar]
- 43. Morselli E, Galluzzi L, Kepp O, et al. 2009. Autophagy mediates pharmacological lifespan extension by spermidine and resveratrol. Aging (Albany NY) 1:961–970. [DOI] [PMC free article] [PubMed] [Google Scholar]
- 44. Salemi S, Yousefi S, Constantinescu MA, et al. 2012. Autophagy is required for self‐renewal and differentiation of adult human stem cells. Cell Res 22:432–435. [DOI] [PMC free article] [PubMed] [Google Scholar]
- 45. Blagosklonny MV. 2011. Progeria, rapamycin and normal aging: recent breakthrough. Aging (Albany NY) 3:685–691. [DOI] [PMC free article] [PubMed] [Google Scholar]
- 46. Takano‐Ohmuro H, Mukaida M, Kominami E, et al. 2000. Autophagy in embryonic erythroid cells: its role in maturation. Eur J Cell Biol 79:759–764. [DOI] [PubMed] [Google Scholar]
- 47. Sun SY, Rosenberg LM, Wang X, et al. 2005. Activation of Akt and eIF4E survival pathways by rapamycin‐mediated mammalian target of rapamycin inhibition. Cancer Res 65:7052–7058. [DOI] [PubMed] [Google Scholar]
- 48. Wan X, Harkavy B, Shen N, et al. 2007. Rapamycin induces feedback activation of Akt signaling through an IGF‐1R‐dependent mechanism. Oncogene 26:1932–1940. [DOI] [PubMed] [Google Scholar]
- 49. O'Reilly KE, Rojo F, She QB, et al. 2006. MTOR inhibition induces upstream receptor tyrosine kinase signaling and activates Akt. Cancer Res 66:1500–1508. [DOI] [PMC free article] [PubMed] [Google Scholar]
- 50. Sandri M, Sandri C, Gilbert A, et al. 2004. Foxo transcription factors induce the atrophy‐related ubiquitin ligase atrogin‐1 and cause skeletal muscle atrophy. Cell 117:399–412. [DOI] [PMC free article] [PubMed] [Google Scholar]
- 51. Blaauw B, Canato M, Agatea L, et al. 2009. Inducible activation of Akt increases skeletal muscle mass and force without satellite cell activation. FASEB J 23:3896–3905. [DOI] [PubMed] [Google Scholar]
- 52. Vazquez A, Bond EE, Levine AJ, et al. 2008. The genetics of the p53 pathway, apoptosis and cancer therapy. Nat Rev Drug Discov 7:979–987. [DOI] [PubMed] [Google Scholar]
- 53. Niedemhofer LJ, Robbins PD. 2008. Signaling mechanisms involved in the response to genotoxic stress and regulating lifespan. Int J Biochem Cell Biol 40:176–180. [DOI] [PMC free article] [PubMed] [Google Scholar]
- 54. Chen Q, Liu K, Robinson AR, et al. 2013. DNA damage drives accelerated bone aging via an NF‐kappaB‐dependent mechanism. J Bone Miner Res 28:1214–1228. [DOI] [PMC free article] [PubMed] [Google Scholar]
- 55. Villeda SA, Luo J, Mosher KI, et al. 2011. The ageing systemic milieu negatively regulates neurogenesis and cognitive function. Nature 477:90–94. [DOI] [PMC free article] [PubMed] [Google Scholar]