Abstract
Airway surface liquid hyper-absorption and mucus accumulation are key elements of cystic fibrosis (CF) lung disease that can be assessed in vivo using functional imaging methods. In this study we evaluated experimental factors affecting measurements of mucociliary clearance (MCC) and small-molecule absorption (ABS) and patient factors associated with abnormal absorption and mucus clearance.
Our imaging technique utilizes two radiopharmaceutical probes delivered by inhalation. Measurement repeatability was assessed in 10 adult CF subjects. Experimental factors were assessed in 29 adult and pediatric CF subjects (51 scans). Patient factors were assessed in a sub-group with optimal aerosol deposition (37 scans, 24 subjects). Pediatric subjects (n=9) performed initial and 2 year follow-up scans. Control subjects from a previously reported study are included for comparison.
High rates of central aerosol deposition influenced measurements of ABS and to a lesser extent MCC. Depressed MCC in CF was only detectable in subjects with previous Pseudomonas aeruginosa (PA) infection. CF subjects without PA had similar MCC to control subjects. CF subjects had consistently higher ABS rates.
We conclude that the primary experimental factor affecting MCC/ABS measurements is central deposition percentage. Depressed MCC in CF is associated with PA infection. ABS is consistently increased in CF.
INTRODUCTION
Cystic Fibrosis (CF) is caused by mutations in the Cystic Fibrosis Transmembrane Conductance Regulator (CFTR) gene which encodes an epithelial anion channel [1]. In the CF airway, absent or dysfunctional CFTR limits Cl- and HCO3- secretion into the airway surface liquid (ASL). Hyper-absorption of Na+ through the epithelial sodium channel (ENaC) also occurs, creating osmotic gradients that favor ASL and mucus dehydration [2–4]. The accumulation of dehydrated mucus is thought to lead to patterns of chronic infection, inflammation, bronchiectasis, and premature respiratory failure. Measurements of mucociliary clearance (MCC) using nuclear imaging techniques are used in CF therapeutics development [5–9]. Our center has developed a variation of this technique that includes a parallel measurement of small molecule absorption (ABS) [10–13]. In vitro studies have demonstrated a proportional relationship between ABS and ASL absorption rate [11]. ABS is increased in the CF lung, and the inhalation of hypertonic saline has been shown to decrease ABS (ASL absorption) and increase MCC (mucus clearance) [12]. In this study we evaluated experimental factors affecting measurements of MCC and ABS and patient factors associated with abnormal absorption and mucus clearance in adult and pediatric subjects with CF.
MATERIALS AND METHODS
Experimental factors affecting measurements of MCC/ABS
We assessed measurement repeatability in a group of 10 adult CF subjects who performed two MCC/ABS imaging measurements separated by 25–35 days, We determined the effects of aerosol deposition pattern using a combined analysis group including 51 scans from 29 CF subjects. This included measurements from: (1) the repeatability group (both measurements used), (2) a pediatric group of 9 subjects who performed two MCC/ABS scans separated by a period of 22–26 months, and (3) a therapy group of 14 adult CF subjects who performed 2 MCC/ABS study days separated by 5–24 days (only baseline measurements were used). The first measurement from the pediatric study has been previously reported along with outcomes from the therapy group [12]. Imaging procedures were identical during all studies. Approval was granted by the University of Pittsburgh Institutional Review Board, and the studies were registered through clinicaltrials.gov - NCT01486199, NCT01887197, NCT00541190, and NCT01223183.
Patient factors associated with abnormal MCC/ABS
We assessed correlations between MCC/ABS and patient factors in the combined analysis group and in a subset of this group that had 50% or less deposition in central lung zones, the optimal deposition group, which included 37 scans from 24 CF subjects. Comparisons were also made with healthy control subjects from a previous study (n=9). Patient factors included FEV1, FVC, and FEF25-75, which were assessed immediately prior to each imaging study. For the pediatric cohort, the slopes of FEV1, FEF25-75, and FVC % of predicted were also calculated by linear regression using available study and clinical PFTs recorded from 2 years prior to the first imaging visit through the second imaging visit. The slopes are represented as a % change in predicted value per year. Sputum and deep oropharyngeal culture results, obtained for routine CF longitudinal care, were surveyed for all subjects. We also assessed whether subjects had previously demonstrated colonization with Pseudomonas aeruginosa (PA). Subjects were considered to be PA positive if they had a single positive culture over the two year period before each imaging study.
Radiopharmaceutical Aerosol Inhalation and Imaging Protocol
Evaluation of ABS and MCC was performed as previously described [12]. Briefly, a liquid aerosol containing a non-absorbable radiolabeled particle probe (Technetium 99 m sulfur colloid; Tc-SC; 296 MBq) and an absorbable radiolabeled small-molecule (Indium 111 DTPA; In-DTPA; 55 MBq) was inhaled by the subjects using a fixed breathing pattern to achieve predominant airways deposition [9]. (More detail is included in the supplement.) Tc-SC is only cleared by MCC while In-DTPA is cleared by both MCC and absorption. Subtracting the MCC clearance rate from the total DTPA clearance rate provides an estimate of the absorptive component of DTPA clearance (ABS) [10, 12, 13]. Studies in epithelial cell cultures have demonstrated proportional relationships between ABS and ASL absorption. The transport of DTPA is mediated by paracellular liquid flows across the epithelium [11], however, and other factors such as changes in tight junction permeability or epithelial damage may also affect ABS. During the baseline measurement technique, subjects inhaled isotonic saline from t=10 through t=20 minutes, followed by 60 additional minutes of recumbent imaging.
Statistical Analysis
Stata 12.1 was used to perform all analysis (Stata Corp., College Station, TX). Non-parametric testing was utilized for group comparisons. For matched pair data, the Wilcoxon matched-pairs signed-ranks test was used (SIGNRANK in Stata). For unmatched data, Mann-Whitney testing was used (RANKSUM). Interclass correlation (ICC) was used to compare measures in the repeatability portion of the study. A one-way random-effects model was used. Linear regression was used to compare potentially correlated continuous variables (REGRESS).
RESULTS
Experimental factors affecting measurements of MCC/ABS
Characteristics of the 10 adult CF subjects who performed repeatability studies are summarized in Table 1. Subjects performed two studies within a 25–30 day window, except for one subject whose studies were separated by 44 days due to illness. Measures of pulmonary function were similar between testing days (FEV1%, p=0.30; FVC%, p=0.26; FEF25-75%, p=0.20; by Wilcoxon) though 3 subjects did have a >5% change in FEV1% predicted. There were no statistical differences in indicators of deposition pattern between study days: central deposition % (p=0.24) and c/p ratio (p=0.33).
Table 1.
Characteristics, pulmonary function, imaging outcomes, and deposition variables from 10 adult CF subjects enrolled in the repeatability study group.
| SUB | Age (yrs) | Gender | FEV1 d1 (%p) | FEV1 d2 (%p) | FEF25-75d1 (%p) | FEF25-75d2 (%p) | MCCd1 (%/80 min) | MCCd2 (%/80 min) | ABSd1 (%/80 min) | ABSd2 (%/80 min) | Cen% d1 % | Cen% d2 % | c/p d1 | c/p d2 |
|---|---|---|---|---|---|---|---|---|---|---|---|---|---|---|
| 1 | 20 | M | 53 | 60* | 24 | 28 | 16.6 | 31.2 | 26.0 | 33.4 | 50.4 | 42.9 | 2.6 | 2.0 |
| 2 | 35 | M | 61 | 55* | 30 | 28 | 28.3 | 45.6 | 10.4 | 7.9 | 53.7 | 57.7 | 3.1 | 3.4 |
| 3 | 30 | M | 81 | 78 | 56 | 52 | 14.4 | 11.4 | 40.2 | 43.3 | 39.7 | 37.8 | 1.8 | 1.7 |
| 4 | 57 | F | 93 | 93 | 89 | 112 | 44.8 | 28.8 | 27.1 | 36.8 | 33.8 | 41.2 | 1.4 | 2.0 |
| 5 | 32 | M | 50 | 50 | 28 | 26 | 51.1 | 49.7 | 13.6 | 20.9 | 51.7 | 53.0 | 2.4 | 2.5 |
| 6 | 24 | F | 79 | 80 | 67 | 69 | 38.1 | 26.4 | 24.0 | 24.5 | 44.5 | 46.1 | 2.0 | 2.1 |
| 7 | 24 | M | 70 | 73 | 38 | 43 | 18.7 | 16.3 | 16.3 | 16.7 | 45.9 | 43.2 | 1.8 | 1.7 |
| 8 | 24 | M | 92 | 101* | 80 | 91 | 43.9 | 26.1 | 9.1 | 34.1 | 51.5 | 42.1 | 2.5 | 1.8 |
| 9 | 33 | M | 54 | 56 | 24 | 27 | 21.2 | 18.6 | 28.0 | 35.8 | 56.3 | 50.1 | 2.8 | 2.2 |
| 10 | 25 | F | 71 | 71 | 40 | 37 | 57.3 | 65.2 | 15.4 | 10.3 | 66.8 | 59.5 | 4.2 | 3.4 |
| Average | 30 | 70 | 72 | 48 | 51 | 33.4 | 31.9 | 21.0 | 26.4 | 49.4 | 47.4 | 2.5 | 2.3 | |
| STD | 11 | 16 | 15 | 24 | 30 | 15.6 | 16.8 | 9.7 | 12.1 | 9.2 | 7.4 | 0.8 | 0.6 |
d1=study day 1, d2=study day 2, MCC=mucociliary clearance, ABS=DTPA absorption, Cen%= central lung deposition %, c/p=central to peripheral deposition ratio,
FEV1%p change > 5% between testing days.
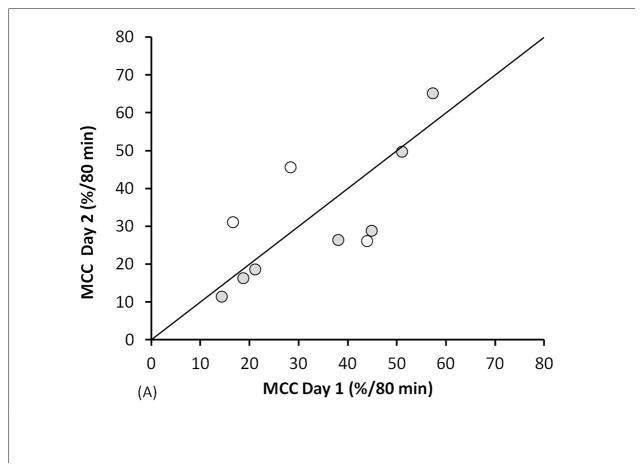
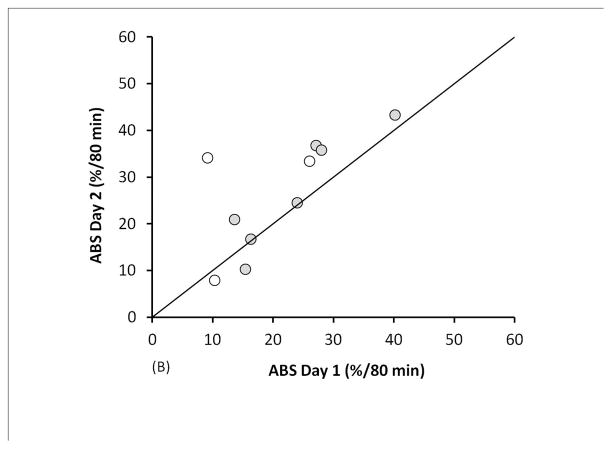
The ABS average including all 20 measurements was 23.7 ± 11.0 %/80 min; MCC average: 32.7 ± 15.8 %/80 min. ABS and MCC values are compared in Figure 1. Bland-Altman plots are included as supplementary figures. The mean intra-subject difference between ABS measurements (day 2-day 1) was 5.4%/80 min with a standard deviation of the differences (SDD) = 8.4, and an intraclass correlation coefficient (ICC) = 0.63. Excluding data from the 3 subjects with a >5% change in FEV1%p between testing days reduced the mean difference and SDD to 3.4%/80 min and 5.2, respectively, and increased ICC to 0.85. The mean intra-subject difference between MCC measurements was −1.5%/80 min with an SDD=12.0% and ICC=0.75. Excluding data from the subjects with a >5% FEV1%p change between visits changed the mean difference to −4.2%/80 min, decreased SDD to 7.7, and increased ICC to 0.90.
FIGURE 1.
Measurement repeatability of (A) MCC and (B) ABS in 10 CF subjects. Unfilled circles are subjects who had a >5% change in FEV1%p between testing days.
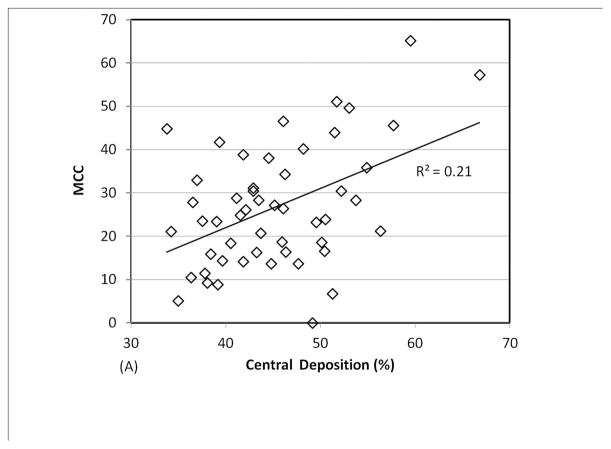
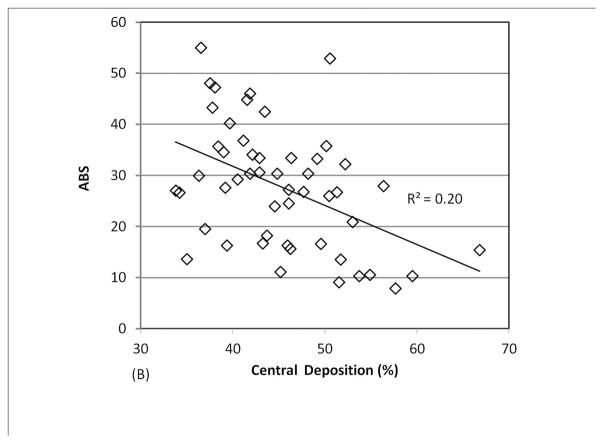
We analyzed a combined dataset including data from 3 different studies in which 29 patients with CF (9 pediatric and 20 adult) performed 1–3 measurements each (a total of 51 measurements). As shown in Figure 2, there was a positive linear correlation between central lung deposition and MCC and a negative linear correlation between central lung deposition and ABS. Very high central deposition favors rapid MCC and prevents accurate measurement of ABS, as the small molecule probe is cleared through MCC before it can absorb. The confounding effect of central deposition on ABS becomes less significant if 14 studies with central deposition > 50% are removed (p value for linear regression increases to 0.10). The confounding effect on MCC becomes statistically insignificant if studies with central deposition > 55% are removed (4 measurements). We generated an optimal deposition dataset by applying a conservative 50% central deposition threshold to all 51 imaging measurements. This dataset included 37 measurements from 24 subjects. No healthy control subjects demonstrated central deposition % > 50%.
FIGURE 2.
Comparing central lung deposition percentage to measurements of (A) MCC and (B) ABS
Patient factors associated with abnormal MCC/ABS
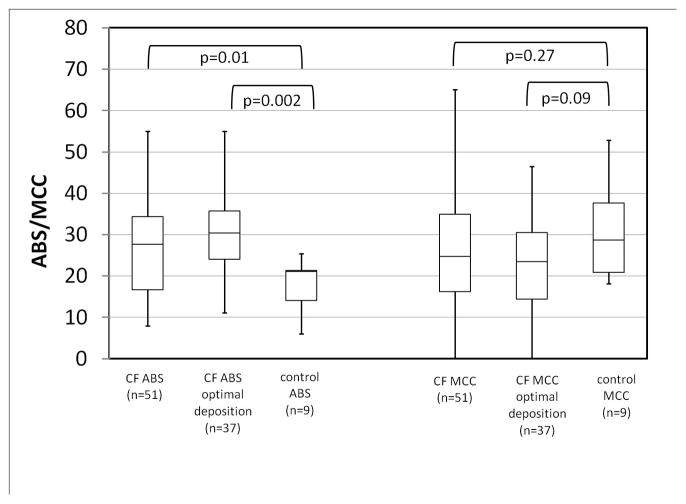
In Figure 3 measurements of ABS and MCC from our combined (51 measurement) and optimal deposition (37 measurement) CF groups are compared to data from control subjects [12]. Our previous studies, which included these control subjects and a portion of the current CF subjects, concluded that ABS was significantly increased in CF and that MCC rates were similar in CF and control subjects [12]. The present result corroborates that ABS is increased in CF with increased significance when the optimized deposition group is considered. MCC differences between CF and non-CF approach significance only when the CF group with optimized deposition is considered (p=0.09). The average FEV1 in the optimal deposition group was 82 ± 17% of predicted, vs. 77 ± 19% in the combined dataset.
FIGURE 3.
Multi-study comparison of measurements of ABS and MCC in CF and non-CF subjects (p-values by Mann-Whitney).
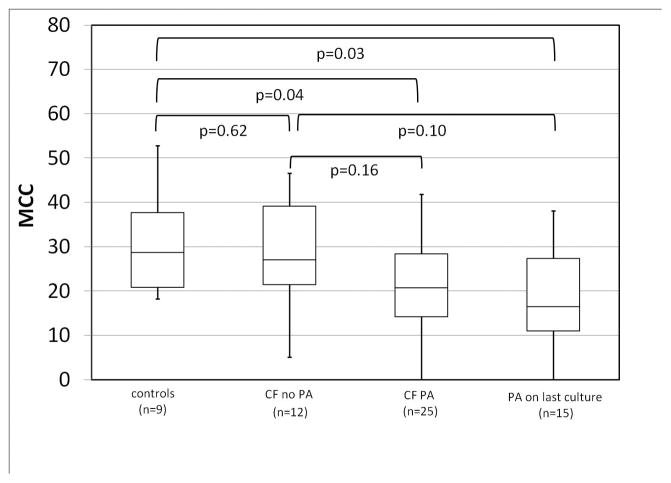
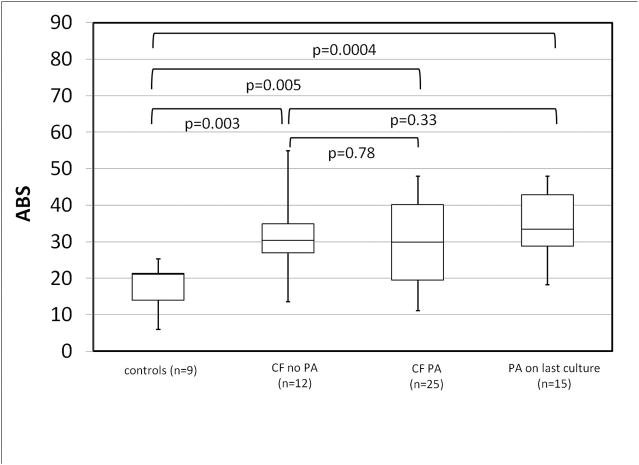
Based on previous studies linking airway bacterial colonization to impaired MCC [14], we categorized CF subjects according to whether or not they had had a PA positive sputum or throat culture in the two years prior to the imaging study. Of the 37 studies from 24 subjects in the optimal deposition group, 25 of them were from 16 PA+ subjects. Table 2 compares PA− and PA+ subjects. Figure 4 compares MCC in PA+ and PA− groups and healthy controls. PA+ CF subjects had significantly lower MCC rates than healthy controls (p=0.04) especially those who were PA+ at their last culture (p=0.03). PA− CF subjects had MCC rates similar to healthy controls (p=0.62). Comparisons between PA+ and PA− CF subjects did not demonstrate significant differences but trended towards decreased MCC, especially with recent PA. ABS measurements for the same groups are shown in Figure 5. ABS was increased in all CF groups when compared to healthy controls and did not vary significantly with PA colonization.
TABLE 2.
Comparing CF subjects who were PA−, PA+ (during last 2 years), and PA+ at last sputum or throat culture. P-values are by Mann-Whitney.
| PA− | PA+ | PA+ at last culture | PA + vs. PA− (p value) | PA+ at last culture vs. PA− (p value) | |
|---|---|---|---|---|---|
| MCC | 27.9 ± 12.9 | 21.3 ± 10.2 | 18.9 ± 10.5 | 0.16 | 0.10 |
| ABS | 30.7 ± 10.5 | 30.0 ± 11.2 | 34.8 ± 9.3 | 0.78 | 0.33 |
| FEV1 | 90 ± 11 | 78 ± 18 | 65 ± 30 | 0.04 | 0.03 |
| FEF 25-75 | 81 ± 30 | 55 ± 25 | 46 ± 25 | 0.02 | 0.02 |
| Central Deposition % | 41.6 ± 5.3 | 41.9 ± 3.8 | 42.0 ± 3.8 | 0.82 | 0.77 |
| age | 21 ± 17 | 20 ± 7 | 21 ± 8 | 0.31 | 0.25 |
| n (studies) | 12 | 25 | 15 | ||
| n (subjects) | 8 | 16 | 12 |
FIGURE 4.
Mucociliary clearance (MCC) in healthy controls and CF subjects with or without PA infection. CF PA = positive sputum or throat culture in the last 2 years.
FIGURE 5.
ABS in healthy controls and CF subjects with or without PA infection. CF PA = positive throat or sputum culture in the last 2 years.
Table 3 considers other correlations between ABS and MCC and patient related variables, measures of clinical condition, and imaging procedure related measurements. As previously described, central deposition can influence measurements of both MCC and ABS. The use of the optimal deposition group which excludes subjects with high central levels of deposition lessens this influence but does not completely negate it for ABS (p=0.10).
TABLE 3.
Gender comparison and linear regression analysis of imaging outcomes
| Gender | Male (n=22) | Female (n=15) | p |
|---|---|---|---|
| MCC | 21.0 ± 11.0 | 27.0 ± 11.4 | 0.14 |
| ABS | 31.4 ± 11.9 | 28.4 ± 9.1 | 0.26 |
| Univariate Linear Regression - MCC vs. | p | Coefficient | 95% confidence interval | |
|---|---|---|---|---|
| ABS | 0.32 | −0.18 | −0.53 | 0.18 |
| c/p (central/peripheral deposition) | 0.62 | −2.74 | −13.86 | 8.38 |
| central deposition % * | 0.66 | 0.20 | −0.71 | 1.11 |
| age | 0.20 | 0.22 | −0.12 | 0.56 |
| FEV1 | 0.51 | 0.078 | −0.159 | 0.316 |
| FEF2575 | 0.21 | 0.087 | −0.051 | 0.224 |
| starting Tc99 m counts | 0.44 | −0.0013 | −0.005 | 0.002 |
| starting In111 counts | 0.99 | −0.000084 | −0.02 | 0.02 |
| Univariate Linear Regression - ABS vs. | p | Coefficient | 95% confidence interval | |
|---|---|---|---|---|
| c/p (central/peripheral deposition) | 0.12 | −7.47 | −17.1 | 2.16 |
| central deposition % * | 0.10 | −0.7 | −1.54 | 0.13 |
| age | 0.73 | 0.06 | −0.28 | 0.39 |
| FEV1 | 0.44 | 0.09 | −0.14 | 0.31 |
| FEF2575 | 0.14 | 0.1 | −0.03 | 0.23 |
| starting Tc99 m counts | 0.32 | 0.0015 | −0.002 | 0.005 |
| starting In111 counts | 0.57 | 0.0041 | −0.01 | 0.02 |
Based on 37 measurements from 24 adult and pediatric CF subjects. P-values for gender comparison by Mann-Whitney. Other p-values based on linear regression.
Subjects with high central deposition percentages (>50%) are not included in this group.
Ten pediatric CF patients were recruited to perform two measurements of ABS and MCC separated by 2 years. Subject data is presented in Tables 4 and 5. One subject was excluded from all analyses based on poor inhalation technique (not listed). Another subject failed to deposit a sufficient radiopharmaceutical lung dose during their second study visit and data from that visit was excluded (subject 7). One subject (subject 3) was able to perform ABS/MCC tests but was unable to perform repeatable pulmonary function tests. One subject (subject 4) had more than 50% central lung deposition on their second day and day 2 was excluded from the analysis. MCC/ABS data was therefore available from all 9 subjects on visit 1 and 7 subjects on visit 2.
TABLE 4.
Characteristics of pediatric subjects performing 2 yr longitudinal studies
| subject | age d1 | age d2 | Gender | FEV 1 d1 | FEV1 d2 | FEF25-75 d1 | FEF25-75 d2 | FEV1%p 4 yr | FEV1%p 2 yr |
|---|---|---|---|---|---|---|---|---|---|
| 1 | 13.4 | 15.6 | M | 88 | 105 | 65 | 86 | −1.1 | 8.4 |
| 2 | 9.1 | 11.2 | F | 106 | 126 | 82 | 135 | −2.8 | 6.1 |
| 3 | 9.6 | 11.8 | F | NA | NA | NA | NA | NA | NA |
| 4 | 12 | 14.1 | F | 103 | 94 | 134 | 120 | 2.1 | 0.6 |
| 5 | 11.6 | 13.7 | M | 78 | 68 | 45 | 35 | −3.0 | −3.9 |
| 6 | 10.6 | 12.6 | M | 94 | 89 | 91 | 63 | −4.0 | −2.8 |
| 7 | 9.2 | 11.2 | F | 100 | 104 | 111 | 113 | −1.3 | −2.1 |
| 8 | 12.3 | 14.3 | M | 80 | 76 | 56 | 53 | −0.3 | −2.6 |
| 9 | 11.1 | 13.3 | M | 93 | 73 | 80 | 47 | −2.4 | −3.7 |
| Average | 11.0 | 13.1 | 93 | 92 | 83 | 82 | −1.6 | 0.0 | |
| SD | 1.5 | 1.5 | 10 | 20 | 29 | 38 | 1.9 | 4.7 |
d1=day 1, d2=day 2, FEV1=forced expiratory volume % of predicted, FEF25-75=mean exhalation flowrate between 25–75% of forced vital capacity, FEV1%p 4 yr = 4 year slope of FEV1%p, FEV1%p 2 yr = 2 year slope of FEV1%p
NA=not available
TABLE 5.
Imaging outcomes of pediatric subjects performing 2 yr longitudinal studies
| subject | MCC d1 | MCC d2 | ABS d1 | ABS d2 | cen% d1 | cen% d2 |
|---|---|---|---|---|---|---|
| 1 | 24.9 | 16.4 | 44.8 | 33.4 | 41.6 | 46.3 |
| 2 | 33.0 | 13.7 | 19.5 | 30.4 | 37.0 | 44.8 |
| 3 | 10.5 | 20.7 | 30.0 | 18.2 | 36.3 | 43.7 |
| 4 | 27.9 | EX | 55.0 | EX | 36.5 | 51.3 |
| 5 | 13.6 | 5.1 | 26.8 | 13.6 | 47.7 | 35.0 |
| 6 | 38.8 | 46.5 | 30.3 | 27.2 | 41.9 | 46.1 |
| 7 | 40.2 | EX | 30.4 | EX | 48.2 | EX |
| 8 | 0.0 | 28.3 | 33.3 | 42.5 | 49.2 | 43.5 |
| 9 | 15.9 | 23.4 | 35.7 | 34.6 | 38.4 | 39.0 |
| Average | 22.8 | 22.0 | 34.0 | 28.6 | 41.9 | 43.7 |
| SD | 13.7 | 13.1 | 10.4 | 9.9 | 5.3 | 4.9 |
d1=day 1, d2=day 2, MCC=mucociliary clearance, ABS=DTPA absorption, EX=excluded (see text).
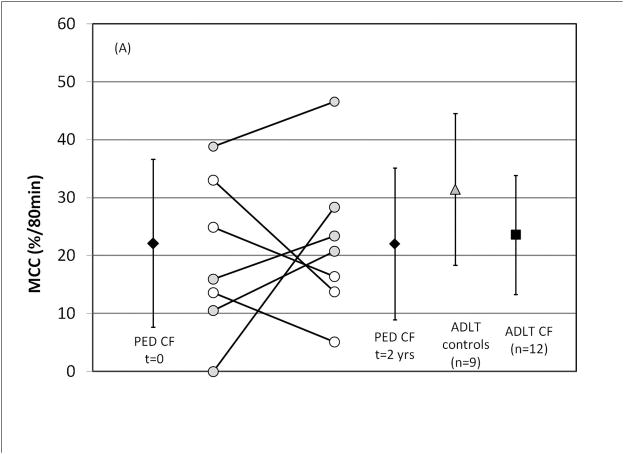
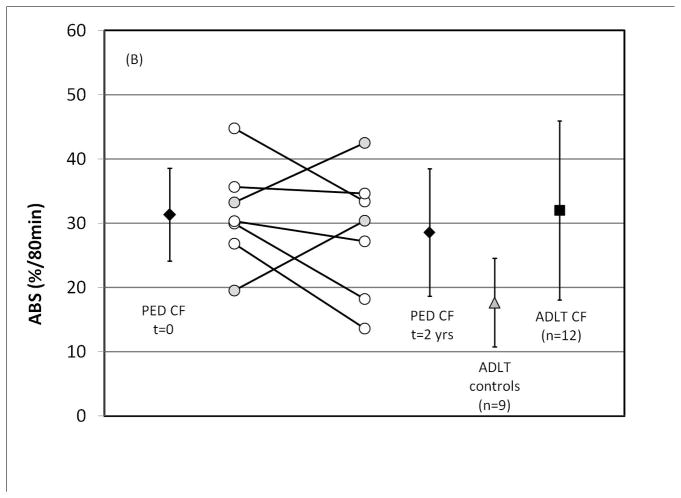
As shown in Figures 6 A and B, there were no statistical differences between day 1 and day 2 values for MCC (p=0.87) or ABS (p=0.24). Central lung deposition % was similar between visits (p = 0.33). On average, FEV1%p declined by 0.9 ± 14% in this group while FEF25-75%p declined by 1.5 ± 27% between study visits.
FIGURE 6.
Longitudinal measures of (A) MCC and (B) ABS in pediatric CF patients over a two-year period. Previous data from adult CF and adult control subjects is included for comparison (Ref. 12) All ± SD. For paired symbols gray fill represents an increase and white fill a decrease.
To determine whether MCC or ABS measurements were associated with subsequent clinical course, a number of associations were evaluated. Day 1 MCC measurements were not predictive of 2 or 4 year slopes in FEV1, FVC, or FEF25-75, nor were they predictive of the number of oral or IV antibiotics received during the 2 year period between visits. Day 1 ABS measurements were not predictive of 2 year slopes in FEV1, FVC, FEF25-75, or antibiotic treatments. They did predict 4 year slopes in FEV1 and FEF25-75 (p=0.02 and 0.04 by linear regression). Subject age was positively correlated with ABS on study day 1 (p=0.05) but not on study day 2. Age did not correlate with MCC, central deposition %, or c/p on either study day. Gender was not associated with differences in MCC or ABS.
Average MCC in studies of pediatric subjects with previous PA colonization was 18.4 ± 10.6%/80 min (n=8 measurements from 5 subjects) vs. 26.4 ± 14.6%/80 min in never infected subjects (n=8 measurements from 4 subjects; p=0.34 by Mann-Whitney). Average ABS values in these groups were similar (p=0.87). FEV1 and FEF25-75 were 96 ±17 and 85 ± 32%p for PA+ subjects vs.89 ±11 and 80 ± 35%p for PA− subjects (p=0.34 and 0.56 for FEV1 and FEF25-75, respectively). Pediatric subject data is included in the results shown in Figures 4 and 5.
DISCUSSION
ASL dehydration is a key defect of CF lung disease that is directly linked to CFTR dysfunction. Dehydrated ASL is thought to cause defective MCC, linking CFTR dysfunction to the opportunistic bacterial infections often associated with CF lung disease. The key finding of our study is that defective MCC is present only in CF subjects with a previous history of PA infection. Non-colonized subjects demonstrated MCC rates similar to healthy controls. In addition, CF subjects were found to have consistently increased ABS which may be associated with ASL dehydration. Our studies also indicated potential confounding effects for both MCC and ABS measurements with high central lung aerosol deposition.
Our first goal was to determine the repeatability of the ABS and MCC measurements. Using values for the standard deviation of the intra-subject measurement differences for subjects with similar pulmonary function on both testing days (ABS σ = 5.2; MCC σ = 7.7) we can consider power. For comparison purposes, the inhalation of 7% hypertonic saline caused a 9.8%/80 min decrease in ABS and an 18.8%/80 min increase in MCC vs. the inhalation of isotonic saline [12]. For a crossover study using parametric statistics to estimate power, a group size of 11 is needed to demonstrate a 5%/80 min change in ABS through a paired t-test, assuming that σ=5.2, Δ=5, α=0.05, and β=0.2. Group sizes of 7 and 21 are needed to demonstrate 10 and 5%/80 min changes in MCC respectively, assuming σ=7.7, Δ=10, α=0.05, and β=0.2 [15]. These group sizes are very attractive and feasible for proof of concept studies with ASL modulating drugs.
Aerosol deposition pattern has been previously shown to affect MCC measurements [9] and most current techniques use controlled breathing to promote consistency between studies and deliver aerosols primarily to the large airways [8]. However, obstructive lung disease may cause extremely high rates of central lung aerosol deposition in some subjects [16]. Excessive deposition in the highly ciliated proximal airways will result in very high MCC measurements that make accurate measurement of ABS impossible as the In-DTPA probe clears through MCC too rapidly to absorb. Here, in order to determine the specific patient and disease factors affecting baseline MCC/ABS, we utilized an analysis group with a central deposition percentage <50%. This is not intended to be a general limit to be applied to other studies. In particular, crossover studies involving only MCC measurement, where deposition is well matched between study days, may allow for the evaluation of therapeutic effect even with high central deposition percentages.
We generated a combined baseline data set of MCC/ABS measurements that included measurements from several recent and previous studies [12]. Previously reported trends were confirmed in this larger group. Specifically, baseline ABS is significantly increased in CF subjects vs. healthy controls and baseline MCC is not detectably lower in CF. When analysis was restricted to subjects with optimal deposition (central deposition % <50%, 37/51 measurements), MCC differences between CF and control subjects approached significance and the significance of ABS differences increased.
The effect of PA colonization on MCC was previously considered by Laube et al [14]. In that study, MCC with included cough clearance was depressed in children with PA colonization when compared to those without. Controversy has existed about whether CF subjects demonstrate baseline deficits in 60–90 min measurements of MCC with some studies demonstrating no differences vs. healthy controls [6, 12] and others demonstrating clear deficits [17, 18]. These differences are likely related to PA status since the latter group of studies enrolled only PA+ subjects. (This was also the case for several other studies utilizing MCC to evaluate therapeutics [7, 19].) One of these studies did identify 2 PA− subjects as having normal clearance but did not include them in the final analysis [18]. Some studies have noted an MCC defect in CF using techniques designed to assess peripheral lung MCC such as 24 hr measurements) [6]. Shorter measurement periods, including those used here, are dominated by large airway clearance. Our results indicate that PA− CF subjects have MCC rates very similar to healthy controls while PA+ CF subjects have MCC rates that are significantly decreased vs. controls. MCC differences between the PA+ and PA− CF groups were not statistically significant but trends indicated a likely association between MCC depression and recent PA infection.
MCC may be depressed by PA by multiple mechanisms. Ciliary beat frequency can be reduced after exposure to PA [20, 21], potentially mediated by virulence factors such as pyocyanin [22] and rhamnolipids [23]. Previous studies have demonstrated that mucus production, composition, and rheology could be affected by PA [24] and pyocyanin in particular is associated with goblet cell hyperplasia and mucus hypersecretion [25]. As a host response to pathogens in healthy airways, CFTR facilitates ASL secretion increasing the transportability of mucus. The failure of this mechanism in CF, compounded by infection-driven increases in mucus production, could defeat otherwise normal rates of MCC in the CF lung. Acute impairments of clearance may extend beyond PA. We can hypothesize that other bacterial or viral infections may depress MCC in CF leading to vulnerability to secondary infections, including PA or other CF pathogens. In support of this, previous studies have associated initial PA infection with RSV and other upper respiratory infections [26, 27]. However the cause and effect relationship between PA and depressed clearance cannot be clearly determined from our data. Depressed MCC could be the direct cause of PA infection, in line with classic descriptions of CF lung pathophysiology, Loss of this host defense would certainly make subjects more vulnerable to infection. Another possibility is that airway conditions, such as mucus plugging and associated local hypoxia, could independently predispose subjects to both depressed MCC and PA infection.
In longitudinal studies of MCC/ABS in pediatric subjects, there was no indication that ABS or MCC predicted clinical outcomes over a two year interval. Infection status and age may have confounded our ability to determine these relationships. The role of PA infection has already been described and trends within the pediatric group matched those of the larger analysis group in this regard. Ultimately the small sample size and the use of only a single follow-up measurement likely decreased our ability to detect any subtle effects with these measurements.
Many of the limitations of the current studies are associated with the inherent variability of the aerosol-based techniques applied. We have confirmed the previously described potential for confounding based on changes in aerosol deposition pattern [9]. Our techniques also rely on two dimensional planar imaging of an inherently complex three dimensional organ that contains large and small airways, and alveoli. Our aerosol delivery techniques are intended to target deposition primarily to large airways but some alveolar contribution to outcomes is likely. Limitations to consider with regard to our analysis of baseline relationships between MCC/ABS and disease state include the use of multiple measures from some subjects. Our primary analysis group included 37 measurements from 24 subjects obtained through several different protocols that utilized identical techniques. The time between measurements varied from a minimum of approximately 30 days to 2 years or more. Since each of these studies was associated with a unique set of variables describing patient condition and ABS/MCC, we opted to utilize all measurements. The study was also limited by having only a small group of control subjects to compare to.
In summary, measurements of MCC and ABS demonstrated good repeatability. The primary experimental factor affecting the measurements is the extent of central deposition. Excluding subjects with high central deposition appeared to increase the statistical significance of observed trends. The primary patient factor associated with depressed MCC is PA infection. PA− CF subjects had MCC rates similar to healthy controls while PA+ CF subjects had depressed MCC, apparently more so with recent infection. Neither ABS nor MCC predicted the clinical course of disease in a small number of pediatric CF subjects though a two-year follow up. Multiple longitudinal measurements may provide more comprehensive information on disease evolution and the factors leading to initial PA colonization. We hypothesize that defects in ASL secretion in the CF airway result in clearance that is not depressed at baseline, but rather is vulnerable to depression by factors such as infection that in turn might lead to cycles of secondary infection and disease progression.
Supplementary Material
Take home message.
Depressed mucus clearance in cystic fibrosis was only detectable in subjects with Pseudomonas aeruginosa (PA) infection
Acknowledgments
This project was supported by: NIH R01 HL108929, NIH P30 DK072506, Cystic Fibrosis Foundation RDP to the University of Pittsburgh.
This work was funded through NIH R01 HL108929, P30 DK72506, and the Cystic Fibrosis Foundation Research Development Program. The content is solely the responsibility of the authors and does not necessarily represent the official views of the National Heart, Lung, and Blood Institute or the National Institutes of Health.
References
- 1.Collins FS. Cystic fibrosis: molecular biology and therapeutic implications. Science (New York, NY. 1992;256(5058):774–779. doi: 10.1126/science.1375392. [DOI] [PubMed] [Google Scholar]
- 2.Matsui H, Grubb BR, Tarran R, Randell SH, Gatzy JT, Davis CW, Boucher RC. Evidence for periciliary liquid layer depletion, not abnormal ion composition, in the pathogenesis of cystic fibrosis airways disease. Cell. 1998;95(7):1005–1015. doi: 10.1016/s0092-8674(00)81724-9. [DOI] [PubMed] [Google Scholar]
- 3.Boucher RC. Evidence for airway surface dehydration as the initiating event in CF airway disease. Journal of internal medicine. 2007;261(1):5–16. doi: 10.1111/j.1365-2796.2006.01744.x. [DOI] [PubMed] [Google Scholar]
- 4.Blouquit S, Regnier A, Dannhoffer L, Fermanian C, Naline E, Boucher R, Chinet T. Ion and fluid transport properties of small airways in cystic fibrosis. Am J Respir Crit Care Med. 2006;174(3):299–305. doi: 10.1164/rccm.200506-987OC. [DOI] [PubMed] [Google Scholar]
- 5.Rowe SM, Heltshe SL, Gonska T, Donaldson SH, Borowitz D, Gelfond D, Sagel SD, Khan U, Mayer-Hamblett N, Van Dalfsen JM, Joseloff E, Ramsey BW. Clinical Mechanism of the Cystic Fibrosis Transmembrane Conductance Regulator Potentiator Ivacaftor in G551D-mediated Cystic Fibrosis. Am J Respir Crit Care Med. 2014;190(2):175–184. doi: 10.1164/rccm.201404-0703OC. [DOI] [PMC free article] [PubMed] [Google Scholar]
- 6.Donaldson SH, Bennett WD, Zeman KL, Knowles MR, Tarran R, Boucher RC. Mucus clearance and lung function in cystic fibrosis with hypertonic saline. N Engl J Med. 2006;354(3):241–250. doi: 10.1056/NEJMoa043891. [DOI] [PubMed] [Google Scholar]
- 7.Robinson M, Daviskas E, Eberl S, Baker J, Chan HK, Anderson SD, Bye PT. The effect of inhaled mannitol on bronchial mucus clearance in cystic fibrosis patients: a pilot study. Eur Respir J. 1999;14(3):678–685. doi: 10.1034/j.1399-3003.1999.14c30.x. [DOI] [PubMed] [Google Scholar]
- 8.Bennett WD, Laube BL, Corcoran T, Zeman K, Sharpless G, Thomas K, Wu J, Mogayzel PJ, Jr, Pilewski J, Donaldson S. Multisite comparison of mucociliary and cough clearance measures using standardized methods. Journal of aerosol medicine and pulmonary drug delivery. 2013;26(3):157–164. doi: 10.1089/jamp.2011.0909. [DOI] [PubMed] [Google Scholar]
- 9.Donaldson SH, Corcoran TE, Laube BL, Bennett WD. Mucociliary clearance as an outcome measure for cystic fibrosis clinical research. Proc Am Thorac Soc. 2007;4(4):399–405. doi: 10.1513/pats.200703-042BR. [DOI] [PubMed] [Google Scholar]
- 10.Corcoran TE, Thomas KM, Myerburg MM, Muthukrishnan A, Weber L, Frizzell R, Pilewski JM. Absorptive clearance of DTPA as an aerosol-based biomarker in the cystic fibrosis airway. Eur Respir J. 2010;35(4):781–786. doi: 10.1183/09031936.00059009. [DOI] [PMC free article] [PubMed] [Google Scholar]
- 11.Corcoran TE, Thomas KM, Brown S, Myerburg MM, Locke LW, Pilewski JM. Liquid hyper-absorption as a cause of increased DTPA clearance in the cystic fibrosis airway. EJNMMI research. 2013;3(1):14. doi: 10.1186/2191-219X-3-14. [DOI] [PMC free article] [PubMed] [Google Scholar]
- 12.Locke LW, Myerburg MM, Markovetz MR, Parker RS, Weber L, Czachowski MR, Harding TJ, Brown SL, Nero JA, Pilewski JM, Corcoran TE. Quantitative imaging of airway liquid absorption in cystic fibrosis. Eur Respir J. 2014;44(3):675–684. doi: 10.1183/09031936.00220513. [DOI] [PMC free article] [PubMed] [Google Scholar]
- 13.Markovetz MR, Corcoran TE, Locke LW, Myerburg MM, Pilewski JM, Parker RS. A physiologically-motivated compartment-based model of the effect of inhaled hypertonic saline on mucociliary clearance and liquid transport in cystic fibrosis. PloS one. 2014;9(11):e111972. doi: 10.1371/journal.pone.0111972. [DOI] [PMC free article] [PubMed] [Google Scholar]
- 14.Laube BL, Sharpless G, Benson J, Carson KA, Mogayzel PJ., Jr Mucus Removal Is Impaired in Children with Cystic Fibrosis Who Have Been Infected by Pseudomonas aeruginosa. The Journal of pediatrics. 2014;164(4):839–845. doi: 10.1016/j.jpeds.2013.11.031. [DOI] [PubMed] [Google Scholar]
- 15.Dupont WD, Plummer WD., Jr Power and sample size calculations. A review and computer program. Controlled clinical trials. 1990;11(2):116–128. doi: 10.1016/0197-2456(90)90005-m. [DOI] [PubMed] [Google Scholar]
- 16.Ilowite JS, Gorvoy JD, Smaldone GC. Quantitative deposition of aerosolized gentamicin in cystic fibrosis. Am Rev Respir Dis. 1987;136(6):1445–1449. doi: 10.1164/ajrccm/136.6.1445. [DOI] [PubMed] [Google Scholar]
- 17.Regnis JA, Robinson M, Bailey DL, Cook P, Hooper P, Chan HK, Gonda I, Bautovich G, Bye PT. Mucociliary clearance in patients with cystic fibrosis and in normal subjects. Am J Respir Crit Care Med. 1994;150(1):66–71. doi: 10.1164/ajrccm.150.1.8025774. [DOI] [PubMed] [Google Scholar]
- 18.Robinson M, Eberl S, Tomlinson C, Daviskas E, Regnis JA, Bailey DL, Torzillo PJ, Menache M, Bye PT. Regional mucociliary clearance in patients with cystic fibrosis. J Aerosol Med. 2000;13(2):73–86. doi: 10.1089/089426800418604. [DOI] [PubMed] [Google Scholar]
- 19.Robinson M, Hemming AL, Regnis JA, Wong AG, Bailey DL, Bautovich GJ, King M, Bye PT. Effect of increasing doses of hypertonic saline on mucociliary clearance in patients with cystic fibrosis. Thorax. 1997;52(10):900–903. doi: 10.1136/thx.52.10.900. [DOI] [PMC free article] [PubMed] [Google Scholar]
- 20.Wilson R, Roberts D, Cole P. Effect of bacterial products on human ciliary function in vitro. Thorax. 1985;40(2):125–131. doi: 10.1136/thx.40.2.125. [DOI] [PMC free article] [PubMed] [Google Scholar]
- 21.Mallants R, Jorissen M, Augustijns P. Beneficial effect of antibiotics on ciliary beat frequency of human nasal epithelial cells exposed to bacterial toxins. The Journal of pharmacy and pharmacology. 2008;60(4):437–443. doi: 10.1211/jpp.60.4.0005. [DOI] [PubMed] [Google Scholar]
- 22.Rada B, Leto TL. Pyocyanin effects on respiratory epithelium: relevance in Pseudomonas aeruginosa airway infections. Trends in microbiology. 2013;21(2):73–81. doi: 10.1016/j.tim.2012.10.004. [DOI] [PMC free article] [PubMed] [Google Scholar]
- 23.Read RC, Roberts P, Munro N, Rutman A, Hastie A, Shryock T, Hall R, McDonald-Gibson W, Lund V, Taylor G, et al. Effect of Pseudomonas aeruginosa rhamnolipids on mucociliary transport and ciliary beating. J Appl Physiol (1985) 1992;72(6):2271–2277. doi: 10.1152/jappl.1992.72.6.2271. [DOI] [PubMed] [Google Scholar]
- 24.Henke MO, John G, Germann M, Lindemann H, Rubin BK. MUC5AC and MUC5B mucins increase in cystic fibrosis airway secretions during pulmonary exacerbation. Am J Respir Crit Care Med. 2007;175(8):816–821. doi: 10.1164/rccm.200607-1011OC. [DOI] [PubMed] [Google Scholar]
- 25.Hao Y, Kuang Z, Walling BE, Bhatia S, Sivaguru M, Chen Y, Gaskins HR, Lau GW. Pseudomonas aeruginosa pyocyanin causes airway goblet cell hyperplasia and metaplasia and mucus hypersecretion by inactivating the transcriptional factor FoxA2. Cellular microbiology. 2012;14(3):401–415. doi: 10.1111/j.1462-5822.2011.01727.x. [DOI] [PubMed] [Google Scholar]
- 26.Petersen NT, Hoiby N, Mordhorst CH, Lind K, Flensborg EW, Bruun B. Respiratory infections in cystic fibrosis patients caused by virus, chlamydia and mycoplasma--possible synergism with Pseudomonas aeruginosa. Acta paediatrica Scandinavica. 1981;70(5):623–628. doi: 10.1111/j.1651-2227.1981.tb05757.x. [DOI] [PubMed] [Google Scholar]
- 27.Collinson J, Nicholson KG, Cancio E, Ashman J, Ireland DC, Hammersley V, Kent J, O’Callaghan C. Effects of upper respiratory tract infections in patients with cystic fibrosis. Thorax. 1996;51(11):1115–1122. doi: 10.1136/thx.51.11.1115. [DOI] [PMC free article] [PubMed] [Google Scholar]
Associated Data
This section collects any data citations, data availability statements, or supplementary materials included in this article.


