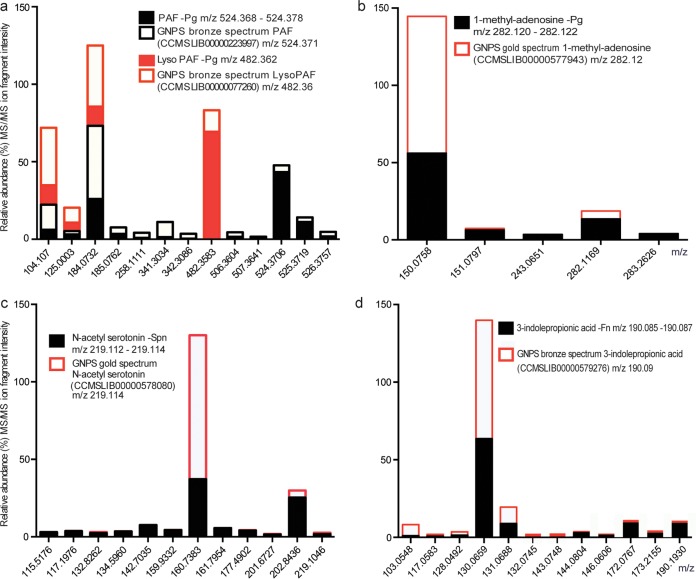
FIG 5 .
Comparisons of MS/MS ion fragmentation spectra derived from GNPS network annotations (see Table S4 posted at ftp://massive.ucsd.edu/MSV000079151/updates/2017-06-30_aedlund_64677506/other/) and from the GNPS library of benchmarked compounds. The x axis shows fragment ion peaks (m/z), and the y axis shows the percentage of relative abundance MS/MS ion fragment intensity. (a) MS/MS ion spectra showing major matching ion peaks for platelet activating factor (PAF) (parent mass for growth extract spectrum, m/z 524.368 to 534.378; parent mass for GNPS bronze spectrum, PAF, m/z 524.371) and the PAF precursor lyso-PAF (parent mass for growth extract spectrum, m/z 482.362; parent mass for GNPS bronze spectrum lyso-PAF, m/z 482.36). (b) MS/MS ion spectra showing major matching ion peaks for 1-methyladenosine (parent mass for growth extract spectrum, m/z 282.120 to 282.122; parent mass for GNPS bronze spectrum 1-methyladenosine, m/z 282.12). (c) MS/MS ion spectra showing major matching ion peaks for N-acetylserotonin (parent mass for growth extract spectrum, m/z 219.112 to 219.114; parent mass for GNPS gold spectrum N-acetylserotonin, m/z 282.12). (D) MS/MS ion spectra showing major matching ion peaks for 3-indolepropionic acid (parent mass for growth extract spectrum, m/z 190.085 to 190.087; parent mass for GNPS bronze spectrum 3-indolepropionic, m/z 219.085).

