Abstract
When infectious epidemics occur, they can be perpetuated within health care settings, potentially resulting in severe health care workforce absenteeism, morbidity, mortality, and economic losses. The ventilation system configuration of an airborne infection isolation room is one factor that can play a role in protecting health care workers from infectious patient bioaerosols. Though commonly associated with airborne infectious diseases, the airborne infection isolation room design can also impact other transmission routes such as short-range airborne as well as fomite and contact transmission routes that are impacted by contagion concentration and recirculation. This article presents a computational fluid dynamics study on the influence of the ventilation configuration on the possible flow path of bioaerosol dispersal behavior in a mock airborne infection isolation room. At first, a mock airborne infection isolation room was modeled that has the room geometry and layout, ventilation parameters, and pressurization corresponding to that of a traditional ceiling-mounted ventilation arrangement observed in existing hospitals. An alternate ventilation configuration was then modeled to retain the linear supply diffuser in the original mock airborne infection isolation room but interchanging the square supply and exhaust locations to place the exhaust closer to the patient source and allow clean air from supply vents to flow in clean-to-dirty flow paths, originating in uncontaminated parts of the room prior to entering the contaminated patient’s air space. The modeled alternate airborne infection isolation room ventilation rate was 12 air changes per hour. Two human breathing models were used to simulate a source patient and a receiving health care worker. A patient cough cycle was introduced into the simulation, and the airborne infection dispersal was tracked in time using a multi-phase flow simulation approach. The results from the alternate configuration revealed that the cough aerosols were pulled by the exhaust vent without encountering the health care worker by 0.93 s after patient coughs and the particles were controlled as the aerosols’ flow path was uninterrupted by an air particle streamline from patient to the ceiling exhaust venting out cough aerosols. However, not all the aerosols were vented out of the room. The remaining cough aerosols entered the health care worker’s breathing zone by 0.98 s. This resulted in one of the critical stages in terms of the health care worker’s exposure to airborne virus and presented the opportunity for the health care worker to suffer adverse health effects from the inhalation of cough aerosols. Within 2 s, the cough aerosols reentered and recirculated within the patient and health care worker’s surroundings resulting in pockets of old contaminated air. By this time, coalescence losses decreased as the aerosol were no longer in very close proximity and their movement was primarily influenced by the airborne infection isolation room airflow patterns. In the patient and health care worker’s area away from the supply, the fresh air supply failed to reach this part of the room to quickly dilute the cough aerosol concentration. The exhaust was also found to have minimal effect upon cough aerosol removal, except for those areas with high exhaust velocities, very close to the exhaust grill. Within 5–20 s after a patient’s cough, the aerosols tended to break up to form smaller sized aerosols of less than one micron diameter. They remained airborne and entrained back into the supply air stream, spreading into the entire room. The suspended aerosols resulted in the floating time of more than 21 s in the room due to one cough cycle. The duration of airborne contagion in the room and its prolonged exposure to the health care worker is likely to happen due to successive coughing cycles. Hence, the evaluated alternate airborne infection isolation room is not effective in removing at least 38% particles exposed to health care worker within the first second of a patient’s cough.
Introduction
Depending upon the pathogen, disease transmission can occur via direct contact with patients and contaminated surfaces or by exposure to bio-aerosols generated by actions such as sneezing and coughing. A patient’s cough is one of the primary sources of pathogen dispersal due to its high velocity and its large quantity of infectious aerosols originating from a patient’s mouth. Indoor environments can play a substantial role in the transmission of aerosolized infectious pathogens that has the potential to travel via short-range, large-droplet aerosols, and long-range small airborne droplet aerosols (Tang et al. 2006; Li, Leung, and Tang 2007).
Use of an airborne infection isolation room (AIIR) is prescribed by various Federal and State Health Organizations, when health care workers (HCWs) have to conduct cough-generating procedures on panflu patients. In using an AIIR, infectious flu virus is contained within the room, and its concentration inside the room is reduced via dilution ventilation. This is done by following the Centers for Disease Control and Prevention (CDC 2005), ASHRAE (2013), and Facilities Guidelines Institute (FGI) guidelines (2014) on the construction of AIIRs and their ventilation system design. The alternate AIIR ventilation arrangement complying with these guidelines is maintained at negative pressure so as to allow the airflow into the room, with an airflow rate of 6–12 air changes per hour (ACH), and direct exhaust of contaminated room air to the outside of hospital building. The airflow and ventilation design parameters are controlled in AIIRs to reduce the potential for airborne migration of infectious aerosol into other areas of the hospital.
The CDC’s National Institute for Occupational Safety and Health (NIOSH) developed the National Occupational Research Agenda (NORA) for improving the health of workers in indoor work environments, such as AIIRs. It identified priority research areas to substantially decrease the work-related illnesses and deaths in the upcoming years (Rosenstock et al. 1998). The NORA Healthcare and Social Assistance (HCSA) Agenda is one element of the larger NORA endeavors. There are over 15 million health care-associated employees in the United States that are covered by the HCSA research agenda. One specific research priority within the HCSA research agenda is the prevention of occupationally acquired transmissions of infectious disease among HCSA workers. The research discussed in this article is in direct response to this HCSA research priority.
Health care settings, including waiting rooms, patient rooms (including AIIRs), and operating rooms, are primary places where infectious outbreaks can occur (Drinka et al. 2000; Patriarca et al. 1985; Sugaya et al. 1996; Zadeh et al. 2000). During the influenza season, active surveillance in hospital environments has effectively identified health care facility-acquired influenza outbreaks (Adal et al. 1996; Bean et al. 1983; Blumenfled 1959; Pachucki et al. 1989; Salgado et al. 2002; Strausbaugh et al. 2002; Weingarten et al. 1988; Zadeh et al. 2000). HCWs caring for flu-infected patients in such environments are at an increased risk of contracting influenza (Siegel et al. 2007). The research group Ghia et al. (2012) conducted a computational fluid dynamics (CFD) study to examine the effectiveness of an existing AIIR in controlling the distribution of airborne contagions throughout the AIIR and protecting HCWs from airborne-infection exposure. The results indicated that airborne contagions from an infected patient’s cough flowed toward the HCW during the air movement from the supply vents toward the main exhaust. It was concluded that the ventilation arrangement of the evaluated traditional AIIR configuration was a contributing factor affecting the transmission and control of contagion distribution and exposure to the HCWs.
The present study demonstrates the role of an alternate ventilation arrangement of a mock AIIR in preventing contagion distribution throughout the AIIR and subsequent transmission to an attending HCW. The main objective of this study is to evaluate the effect of air supply diffusers and exhaust locations on the airflow patterns and the possible flow path of infectious cough aerosols released from patient’s mouth in an alternate mock AIIR.
Methods
Problem statement
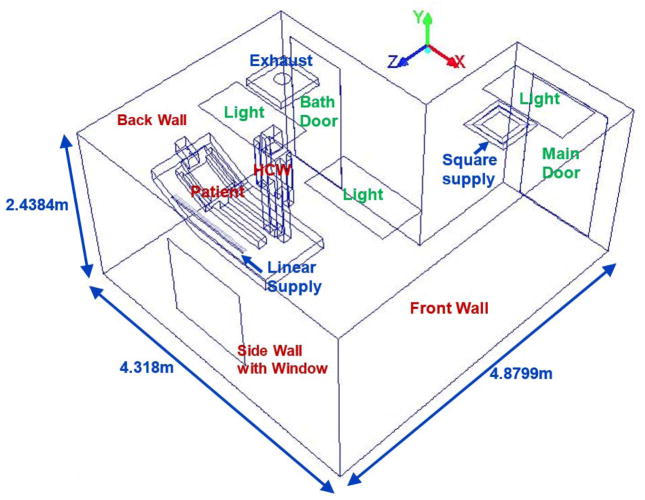
The mock alternate AIIR at NIOSH’s Alice Hamilton research laboratories at Cincinnati, Ohio is considered for the present study. Figure 1 presents the isometric view of the geometric model and the configuration details of the alternate mock AIIR modeled at the NIOSH facility. The modeled room dimensions were, length = 170 in (4.31 m), width = 96 in (2.43 m), and height = 192 in (4.87 m). The corresponding computer-aided design (CAD) model was constructed for the alternate mock AIIR, and a computational grid was generated using the ANSYS ICEM CFD software (ANSYS Inc. 2015). This alternate mock isolation room consists of two ceiling inlet supply vents (square and linear supply) and one ceiling exhaust grill, a bathroom with exhaust vent, the room entrance/exit main door for patients and HCWs.
Figure 1.
Schematic Layout of the Alternate mock AIIR ventilation configuration
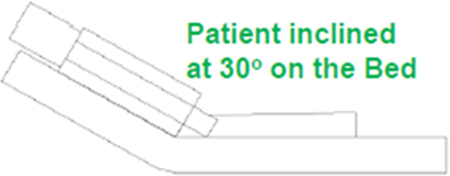
The patient and HCW are modeled using the NASA anthropometric data from the Human Integration Design Handbook, 2010. Table 1 gives the patient and HCW’s dimensions. The patient is lying on the bed inclined at 30o, and the HCW is facing the patient at a distance of 8.78 cm (or 3.46 in) from the patient on the side of the monitoring instrumentation location. The mouth diameter is taken to be 0.0980 ft (0.03 m; VanSciver et al. 2011) created at patient’s face for cough flow from patient’s mouth and the nose opening dimensions were modeled with an area of 0.11 in2 (7.5 × 10⁻⁵ m2; Gupta et al. 2009) at the patient and HCW’s face center for breathing. Figure 2 shows the two semi-circular nose openings and mouth opening at HCW’s face. The HCW’s exhaled air was at the normal body temperature of 36.51°C (97.71°F).
Table 1.
Patient and HCW dimensions (NASA 2010)
| Dimensions of HCW, Patient |

|
|||
| Part | Length (m) | Width (m) | Height (m) | |
| Head | 0.38 | 0.16 | 0.283 | |
| Trunk | 0.5 | 0.25 | 0.652 | |
| Hands | 0.1 | 0.1 | 0.783 | |
| Legs | 0.13 | 0.13 | 0.15 | |
| Mouth | 0.03m (diameter) | |||
| ||||
Figure 2.
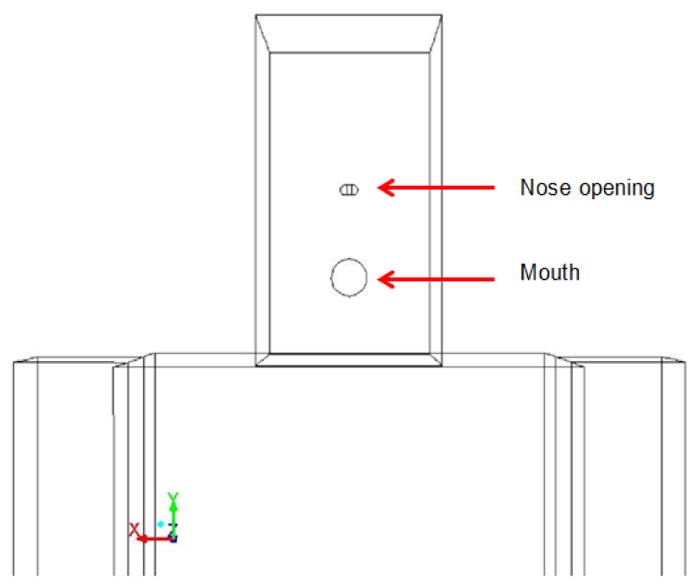
Patient and HCW’s face showing nose and mouth openings
Boundary and operating conditions
The supply diffusers for mock AIIRs are selected to provide minimum ventilation rates and indoor air quality with the fresh air inflow (Qin) of about 150 cubic feet per minute (CFM; or 148.16 CFM; 251.72 cubic meters per hour [CMH]) that is acceptable to patients and HCWs as per ANSI/ASHRAE/ASHE Standard 170 (2013).
A rectangular linear diffuser with two air slots is used for ceiling installation. The standard diffuser module length is 48 in (1.219 m). The length of each slot is 46.25 in (1.17 m) and the thickness of each slot is 0.718 in (0.018 m). The two slots are equipped with air deflectors so that the direction of air discharge can be adjusted. Supply air flows at an angle of 45° from the slot closest to the window and directly downwards (vertical air distribution) for the second slot furthest from window. The supply flow rate from the linear diffuser is set at 55% of Qin or 81.49 CFM (138.45 CMH).
A square diffuser with two slots is used for ceiling installation. The standard diffuser module length is 24 in (0.6 m). The thickness of outer and inner slots is 2.7 in (2.685 m) and 2.9 in (0.073 m), respectively. Supply air flows at an angle of 45° outward into the room. The total supply flow rate from the square diffuser is set at 45% of Qin or 66.67 CFM (113.27 CMH). The supply air temperature from the linear and square diffuser is 20.96°C (69.72°F).
The outflow of 225 CFM (382.27 CMH) is due to the airflow through the main exhaust and the leakage into the bathroom. The temperature of the supplied air into the AIIR is 20.96°C (69.72°F). The boundary and operating conditions of the ceiling-ventilated alternate mock AIIR is presented in the Table 2.
Table 2.
Alternate AIIR ventilation configuration – Operating Conditions
| No. | Boundary | Boundary Condition | Boundary value required |
|---|---|---|---|
| 1. | Linear Inlet diffuser | Number of slots in the Linear Diffuser | 2 |
| Flow rate | 55% of Qin = 81.49CFM (138.45 CMH) | ||
| Angle | 450 | ||
| Direction of flow: Towards the window (for the slot closest to window); Directly downwards for the 2nd slot furthest from window. | |||
| 2. | Square supply | Flow rate | 45% of Qin = 66.67CFM (113.27 CMH) |
| Angle | 450 | ||
| Direction of flow: Outward, air flows into the room. | |||
| 3. | Main Room Exhaust | Flow rate | 225 CFM (382.27 CMH) |
| Direction of flow: Into the exhaust vent, air extracted from the room. | |||
| 4 | Bath Room Exhaust | Flow rate | 80CFM (135.92 CMH) |
| 5 | Main Door Gaps | Pressure at the main door gaps | −0.01” W.G. |
| 6. | Bath Door Gaps (Assuming bath receives 10% of its exhaust makeup air from leaks other than bathroom entry door) | Flow rate | 72CFM (122.32 CMH) |
| Direction of flow: In to the bathroom, room air escapes through the bath door gaps | |||
| 7. | Overhead Lights | Power (Watts) | 0 |
| 8. | HCW lower body | Temperature | 20.96 °C (69.72 °F) (Room Temperature) |
| 9. | HCW head and face | 36.51 °C (97.71 °F) (Normal body Temperature) | |
| 10 | Patient head and mouth | 38.18 °C (100.72 °F) (Patient with Fever) | |
| 11 | Window near patient | 16.6 °C (61.88 °C) (Outside Temperature) | |
The bathroom exhaust flow rate was 80 CFM (135.92 CMH). It was assumed that the bath room received 10% of its exhaust makeup air from leaks other than bathroom entry door. Thus, a flow rate of 72 CFM (122.32 CMH) was specified at the gap around the bathroom door. A pressure of –0.01 in water gauge (WG) was specified as the boundary condition at the gaps around the AIIR’s main entry door.
The geometric model, ventilation parameters, and room pressurization of ceiling-ventilated alternate mock AIIR was numerically simulated along with contagion distribution within the AIIR and the HCW’s potential to inhale the patient’s cough aerosols.
At the patient’s and HCW’s body
To account for the fever, it was assumed that the patient’s head was at a temperature of 38.18°C (100.72°F) and the rest of body was assumed to be covered with a sheet at room temperature. For the HCW, a temperature of 36.51°C (97.71°F) was specified to the HCW’s head and the rest of the body was assumed to be covered with clothes at room temperature.
For furniture
The patient bed was modeled as wall boundary and maintained at normal room temperature of 20.96°C (69.72°F).
At window
The window in the room was considered as an isothermal wall. The temperature for the window facing outside was specified at the outside climatic conditions of a day at 16.6°C (61.88°F).
At the overhead lights
A heat flux of 0 Watts is specified at the boundary as the lights are shielded by plastic panel covers.
Materials
The materials used in the model and their properties are listed in Table 3.
Table 3.
Material properties
| Object | Material | Conductivity (W/m-K) | Specific Heat (J/kg-K) | Density (kg/m3) |
|---|---|---|---|---|
| Window | Window Glass | 0.96 | 840 | 2500 |
| Patient and HCW | Human Skin | 0.206 | 3558 | 1027 |
| Overhead Lights | Plastic | 1.005 | 1670 | 1250 |
| Doors | Wood | 0.173 | 2310 | 700 |
| Room Walls | Dry Wall | 3.1 | 1090 | 600 |
| Patient Bed | Cotton Fabric | 0.043 | 1162 | 1540 |
| Floor | PVC Flooring | 0.28 | 900 | 1450 |
Solution procedure
The transient, three-dimensional, incompressible Navier–Stokes equations including gravity were solved with the pressure-velocity coupling achieved using the semi-implicit pressure-linked equations (SIMPLE) algorithm given by Patankar and Spalding (1972). The energy equation was also solved to account for temperature variations. The transport equations were discretized using a second-order upwind scheme with second-order implicit discretization for the temporal terms. Turbulence was modeled using the realizable k-ε model. A numerical analysis is performed using commercial CFD code FLUENT based on the finite volume method. Over each control volume, the SIMPLE algorithm was used to iteratively solve for these governing equations.
Initially, the steady-state flow field in the AIIR was determined before the patient’s coughing and HCW’s breathing were initiated. The convergence criteria for the steady state flow field were set at 10−4 for all equations.
Next, the patient cough cycle consisted of a mixture of cough aerosol and air for 0.5 seconds cough cycle. The aerosol mixture had about 6000–7000 cough aerosols which was consistent with data showing that the number of aerosols ejected from a cough is of the order of 1000–10000 (Kowalski and Bahnfleth, 1998).
The Lagrangian discrete-phase model in the finite-volume solver ANSYS Fluent 17.0 (2015) was used to track infectious bio aerosols within the AIIR. The numerical implementation of this approach was first presented in 1980 by O’Rourke (1981a, 1981b, 1985) and Dukowicz (1980). Since then it has been developed and used in many applications including modeling droplet collision in indoor environments.
Hence, in the present study, O’Rourke’s stochastic algorithm was used to model droplet collision, and the Taylor analogy breakup (TAB) model was used for droplet breakup.
Droplet deposition was determined when the distance between the droplet center and the room surface was less than or equal to the droplet radius; the particle tracking is then terminated. Cough aerosols stuck to the surface when they fell to the ground or subsequently escaped when they reached a room exhaust. The patient coughed for the time period of 0.5 s (one cough cycle) while the HCW continued breathing. At the end of the cough cycle, the patient resumed a normal breathing cycle and the cough aerosols dispersal throughout the alternate mock AIIR were tracked in time until all these aerosols were exhausted from the room by the main exhaust or through bathroom door gaps. The results below present the cough aerosol dispersal behavior, their location at several time instants, and the analysis of the HCW’s risk of exposure to the infectious cough aerosols in the alternate mock AIIR.
The time step chosen for the transient simulation was 0.001 s. The solution is assumed to be converged when the convergence residuals changes by less than 10−4.
The evaluated AIIR was an alternate mock AIIR built within the Alice Hamilton research laboratory within the CDC’s NIOSH. The computational cells were mapped within the simulated alternate AIIR ventilation configuration with a total number of 1.61 million cells. The grid sensitivity study was performed for the original mock AIIR, to ensure both computational accuracy and efficiency. The results below present the influence of the alternate AIIR ventilation configuration on the possible flow path of infectious airborne cough aerosols.
Results and discussion
Investigation of airflow patterns based on alternate mock ventilation configuration
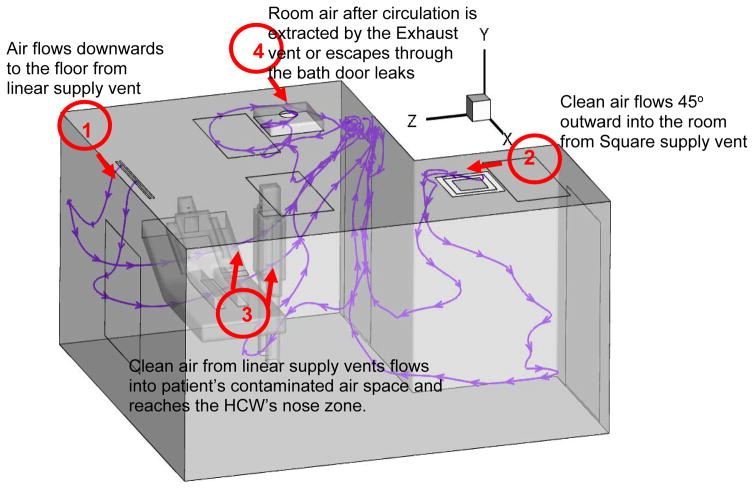
Figure 3 shows the air flow streamlines in the isometric view of the alternate AIIR ventilation configuration. The clean air jets flow throughout the room from linear and square supply vents, as shown at locations 1 and 2, respectively.
Figure 3.
Investigation of air flow patterns based on Alternate AIIR ventilation configuration
The ceiling supply vents are positioned at locations 1 and 2, in order to distribute fresh air throughout the room. However, it is observed that the clean air from linear supply vent flows into the patient’s air space, carrying the contaminated air toward the HCW’s breathing zone (at location 3). This suggests, even though the supply vent dilutes the contaminated air in the room, the rising air jets (particularly from the linear supply vent) flows in the direction of patient’s air space to the HCW’s space, resulting in HCW’s risk of exposure to infectious aerosol. The room air, after circulation throughout the room, is extracted by the exhaust vent (at location 4) or escapes through the bath door leaks.
Cough aerosol flow dynamics at 0.5 s
The patient’s cough consisting of a mixture of air and traditional cough aerosols size of 1 μm diameter, is ejected from patient’s mouth between the time interval of 0 and 0.5 s, for example, one cough cycle. A total number of 6000–7000 cough aerosols are ejected from the patient’s mouth. The typical droplet diameter from a human cough is 1 μm; hence, the 1 μm cough aerosol size is considered to be traditional size of cough aerosols. Furthermore, the previous study (Papineni and Rosenthal 1997) conducted on the size distribution of the cough droplets indicated a great majority (80%–90%) of the aerosols with ≤1 μm diameter. Only a few (10% to 20%) of the total droplet concentration consisted of particles greater than 1 μm in diameter.
The patient coughs for 0.5 s (Figure 4) while the HCW continues breathing. The patient’s single cough cycle profile (Gupta et al. 2009) and the HCW’s inhalation and exhalation phase of breathing (Guyton and Hall 2011) is shown in Figures 5 and 6, the corresponding cough and breathing parameters are shown in Tables 4 and 5, respectively.
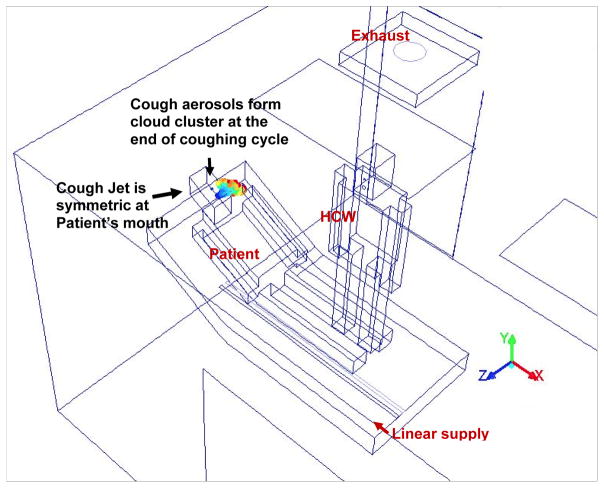
Figure 4.
Infected Patient’s Cough aerosol flow dynamics at 0.5s in Alternate AIIR ventilation configuration
Figure 5.
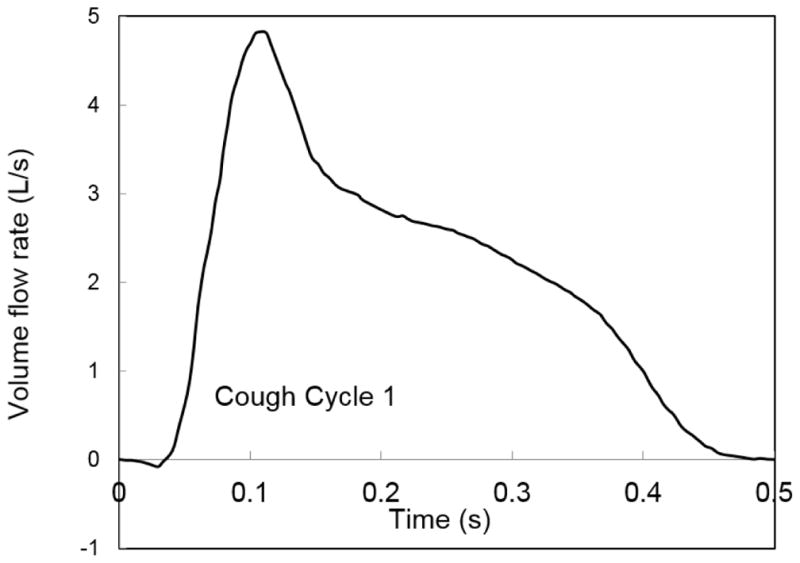
Single cough flow cycle from patient’s mouth
Figure 6.
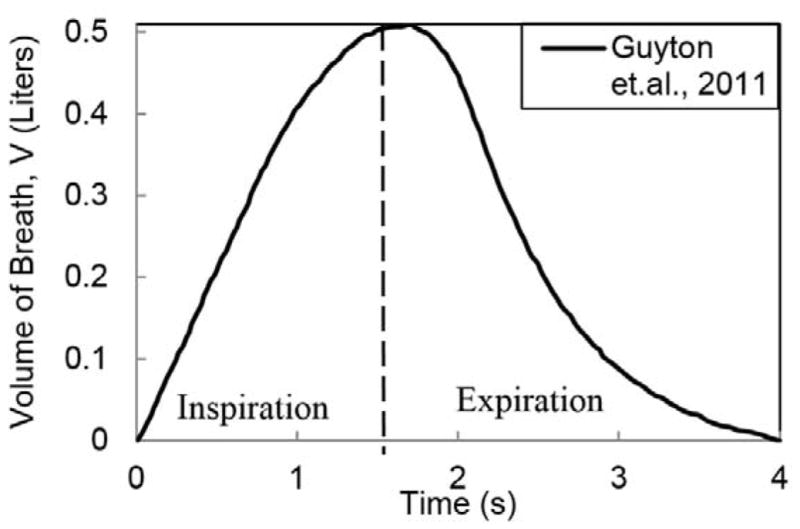
Normal Breathing Cycle
Table 4.
Patient-Cough Cycle profile parameters
| Time period (s) | Coughing time (s) | Average Cough Volume (L) | Cough aerosol Size (in microns) |
|---|---|---|---|
| 0.5 | 0s till 0.5s | 2.41 | 1 micron |
Table 5.
Breathing profile parameters
| Maximum volume flow of air (L) | 0.5 |
| Time period of Breath (s) | 4 |
| Time Period of Inspiration cycle (s) | 1.71 |
| Time Period of Expiration cycle (s) | 2.29 |
Figure 4 shows the zoom-in isometric view of the cough aerosol cloud cluster developed at the end of patient’s cough cycle, at the time instant of 0.5 s. The cough flow is symmetric about the patient’s mouth.
As the patient coughs, the cough aerosols remain airborne and form a cloud cluster before being dispersed in different directions throughout the room. This is because the cough velocity drives the group of cough aerosols forward, leading to their cloud cluster formation. The cough velocity is the average velocity of flow over mouth opening area generated from a patient’s cough over a period of time.
The cough flow process and the flow direction of cough predicted by the current numerical analysis (Figure 4) is verified with the experimental work by Gupta et al. (2009; Figure 7), showing the side view of a cough process from patient’s mouth.
Figure 7.
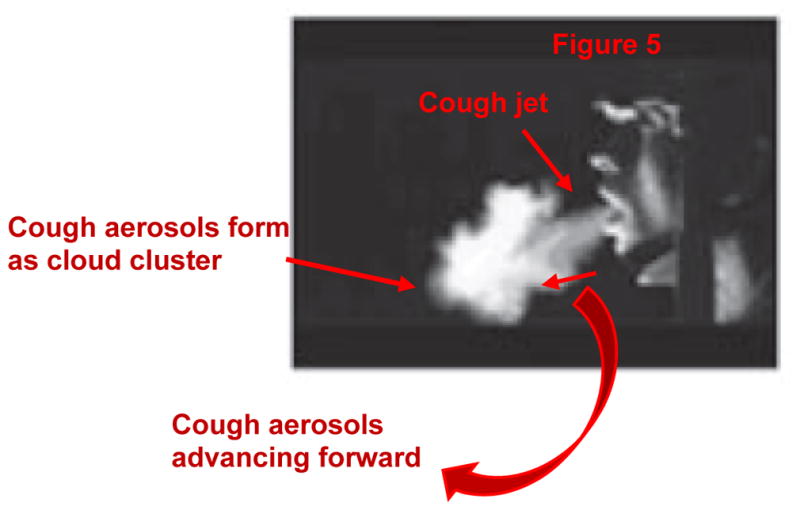
Comparison of the patient’s cough aerosols flow process to the experimental work by Gupta et al, 2009
Comparing the numerically obtained dispersal of cough aerosols from patient’s mouth (Figure 4) to the flow visualization of cough by Gupta et al. (2009; Figure 7), it can be observed that the cough aerosols are ejected as a jet from the person’s mouth and travel through the room air in the form of a cloud cluster.
The alternate AIIR square and linear supply as well as the ceiling-exhaust ventilation configuration and the airflow rates do not have significant influence on the patient cough aerosol flow until the end of coughing cycle, due to their relatively low velocities compared to the patient’s cough.
The cough aerosols remain the patient’s region and did not reach the HCW’s breathing zone by the end of coughing cycle. Hence, the HCW remains unaffected until the end of patient’s cough.
Tracking of cough aerosols flow in patient’s region at 0.81–0.85 s
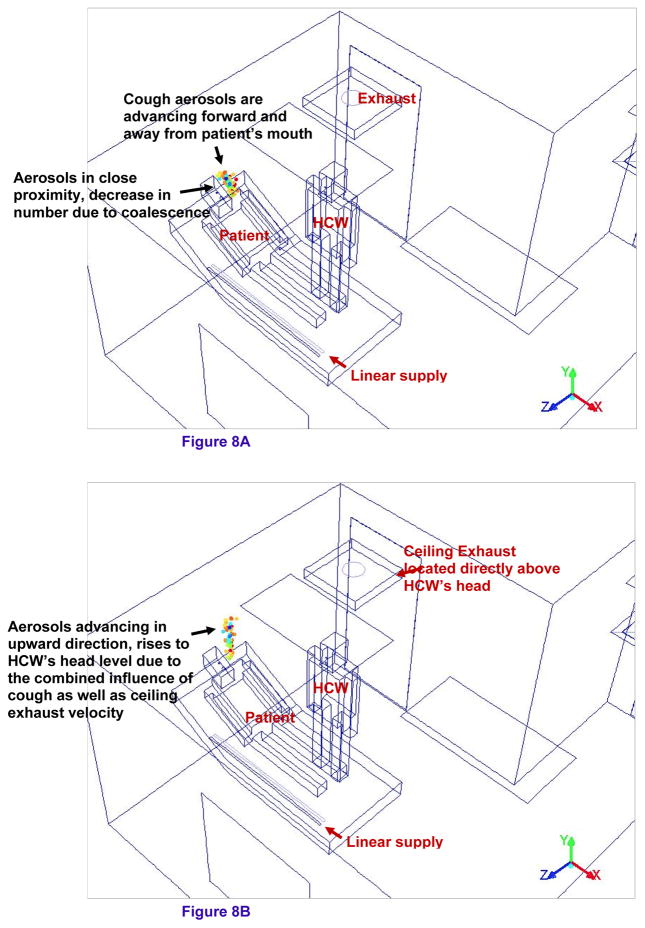
Figure 8a and 8b shows the zoom-in isometric view of the cough aerosols in the patient’s region of the alternate mock AIIR ventilation configuration at the time instants 0.8 and 0.85 s, respectively. The patient begins normal breathing cycle (Figure 4) after coughing. The patient and HCW are breathing out-of-phase through the nose openings.
Figure 8.
Figure 8A – Tracking of cough aerosols flow in patient’s region at 0.81s
Figure 8B – Tracking of cough aerosols flow in patient’s region at 0.85s
The cough aerosols are observed advancing forward and away from the patient’s mouth (Figure 8a). The cough aerosols remain in close proximity to each other during this time and decrease in number due to coalescence.
The cough aerosols are moving with the momentum gained from the velocity of the air ejected from the patient’s mouth. These aerosols are seen rising to the height of the HCW’s head level (Figure 8b).
In addition to the patient’s cough velocity, the ceiling exhaust vent located directly above the HCW’s head also plays an important role in advancing the aerosols in the upward direction.
Since the aerosols remain in the patients region, these aerosols have no impact on the HCW’s breathing zone. Hence, the HCW is protected from exposure to the contagious aerosol during these time instants in the alternate mock AIIR ventilation configuration.
Tracking the possible trajectory of cough aerosols toward the ceiling exhaust at 0.9–0.93 s
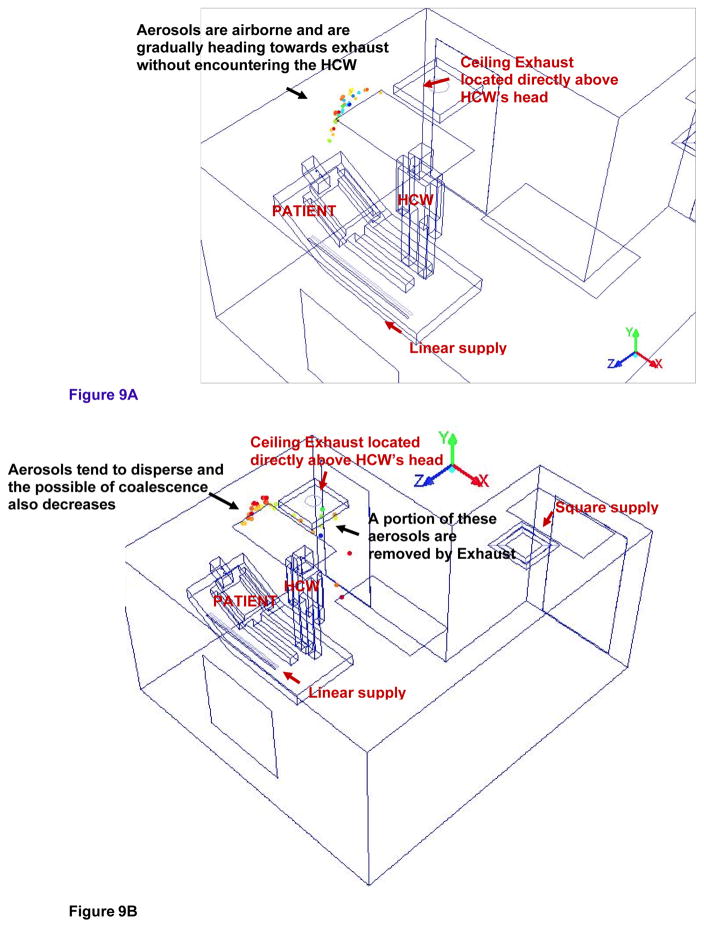
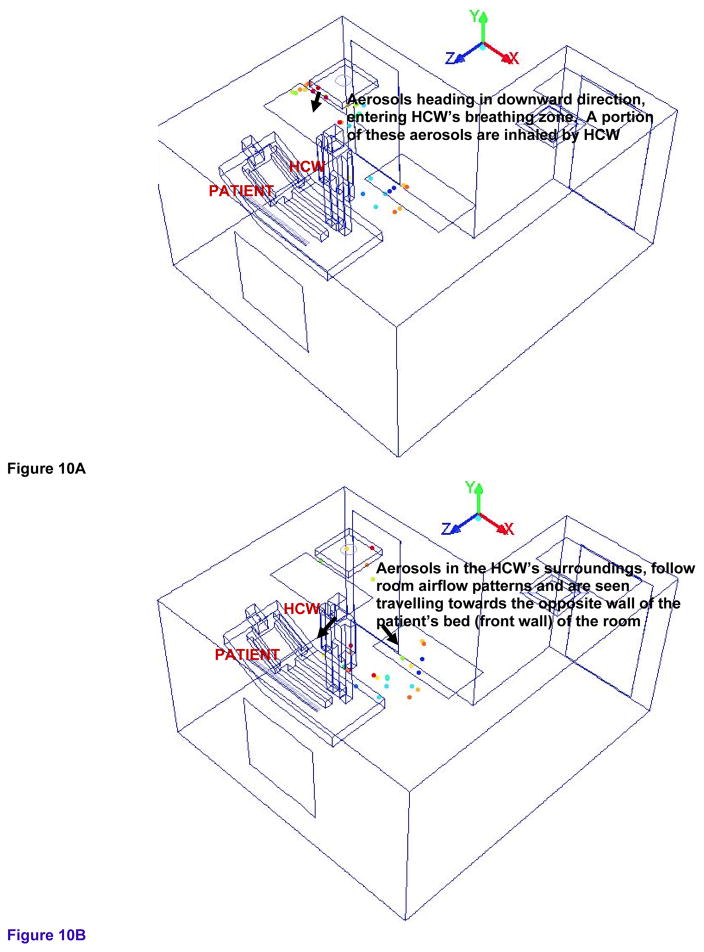
Figure 9a and 9b shows the isometric view of the possible trajectory and entrainment of cough aerosols toward the ceiling exhaust in the alternate mock AIIR ventilation configuration at the time instants 0.9 and 0.93 s, respectively. Figure 10a and 10b shows the isometric view of the cough aerosols dispersal in the HCW’s region of alternate mock AIIR ventilation configuration at the time instants of 0.95 and 0.98 s, respectively.
Figure 9.
Figure 9A – Tracking the possible trajectory of cough aerosols towards the ceiling exhaust at the time instant of 0.9s
Figure 9B – Tracking the possible trajectory and entrainment of cough aerosols towards the ceiling exhaust at the time instant of 0.93s
Figure 10.
Figure 10A – Tracking of cough aerosols dispersal in the HCW’s region at the time instant of 0.95s
Figure 10B – Tracking of cough aerosols dispersal in the HCW’s region at the time instant of 0.98s
The cough aerosols are airborne in the patient and HCW’s region and are gradually heading toward the exhaust vent as shown in Figure 9a.
At the time instant of 0.93 s (Figure 9b), the cough aerosols are starting to disperse and the possibility of the coalescence also decreases.
The cough aerosols are pulled by the exhaust vent without encountering the HCW. A portion of these cough aerosols are removed by the exhaust and the remaining aerosols that are deflected by the ceiling. These aerosols are seen moving in the downward direction, toward the lower part of the room height.
Even though the alternate mock AIIR removed 24% of the particles remaining in the room, this configuration is not effective in completely removing the cough aerosols from the room (as soon as the aerosols encountered the exhaust vent) at these time instants. In comparison, the original AIIR was only effective in removing 7% of the particles remaining in the room with in the first second.
Tracking of cough aerosols dispersal in the HCW’s region at the time instants of 0.95–0.98 s
Figure 10a and 10b shows the isometric view of the cough aerosols dispersal in the HCW’s region of alternate mock AIIR ventilation configuration at the time instants of 0.95 and 0.98 s, respectively.
Most of the cough aerosols close to the exhaust vent are removed from the room. However, the cough aerosols that escaped the exhaust vent present directly above the HCW, are seen moving in a downward direction, entering the HCW’s breathing zone. This results in a region of higher concentration where the cough aerosols deflected from the ceiling accumulates in the HCW’s surroundings. Since the HCW is in the inhalation phase of the normal breathing cycle, a portion of these aerosols are then inhaled by the HCW at 0.95 s (Figure 10a).
The HCW’s inhalation zone is the volume of 1 ft (0.0283 m) considered around the nose region of HCW’s body. Even though the inhalation zone is near the HCW’s nose region, the natural convection around the HCW’s body is an active transport media for the infectious aerosols generated within the occupied zone. During inhalation, the rising air stream near the HCW body pulls the air and the cough aerosols in lower areas up in to the HCW’s inhalation region and the HCW inhales these cough aerosols.
The remaining cough aerosols remain airborne within the HCW’s surroundings during these time instants. They follow room airflow patterns and are seen traveling away from the HCW’s zone, toward the opposite wall of the patient’s bed (front wall) of the room at 0.98 s (Figure 10b).
This is one of the critical stages in terms of the HCW’s exposure to airborne contagion, as the aerosols are inhaled and are in proximity of the HCW, and, while carrying out cough generating procedures, the HCW inhales 38% of the particles remaining in the room by 0.98 s. Hence, the alternate mock AIIR ventilation configuration is aiding in exposing the HCW to the airborne contagion.
Cough aerosol dispersal within the patient and HCW’s region at time instants of 1.2 and 2 s
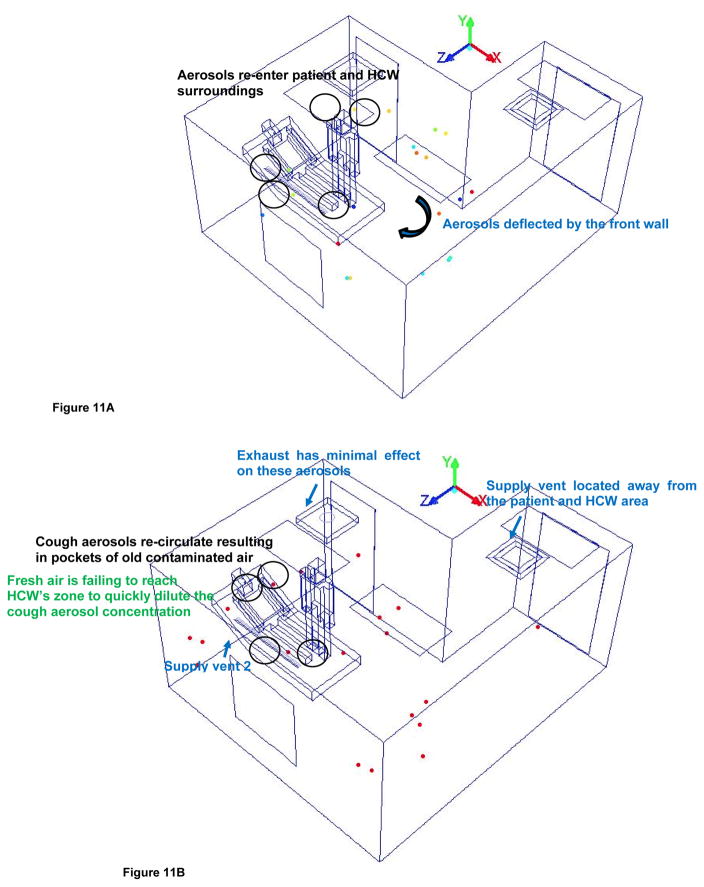
Figure 11a and 11b shows the isometric view of the cough aerosols dispersal in the patient and HCW’s region of alternate mock AIIR ventilation configuration at the time instants of 1.2 and 2 s, respectively.
Figure 11.
Figure 11A – Cough aerosol dispersal within the patient and HCW’s region at time instants 1.2s
Figure 11B – Cough aerosol dispersal within the patient and HCW’s region at time instants 2s
The cough aerosols disperse away from the patient and HCW’s region and being deflected by the front wall by 1.2 s as shown in Figure 11a.
The cough aerosols re-enter and re-circulate the patient and HCW’s surrounding area resulting in pockets of old contaminated air by 2 s (Figure 11b), after being bounced by the front wall.
By this time, coalescence losses have decreased as the aerosol are no longer in very close proximity and their movement is primarily influenced by the AIIR airflow patterns.
The airflow patterns are significantly determined by locations of supply. Because the supply vents are located at one end of the main entrance and near the side wall of the room, the result is that the velocities are higher at the end of the alternate mock AIIR where the supply is located. In the patient and HCW’s surrounding area away from the supply, the fresh air is failing to reach this part of the room to quickly dilute the cough aerosol concentration. It results in inadequate delivery of fresh air to the patient and HCW zone.
The exhaust was found to have minimal effect, except for those areas very close to the exhaust where high velocity is found.
The analysis shows, at 2 s, the HCW inhales 27% of the remaining particles in the room. This causes a potential risk of disease transmission to the HCW. Hence, the alternate mock AIIR ceiling ventilation is not effective in preventing the cough aerosols from entering the HCW’s inhaling zone.
Evaluation of cough aerosol dispersal behavior and impact of alternate mock AIIR ventilation configuration in the control of HCW exposure to infectious aerosol
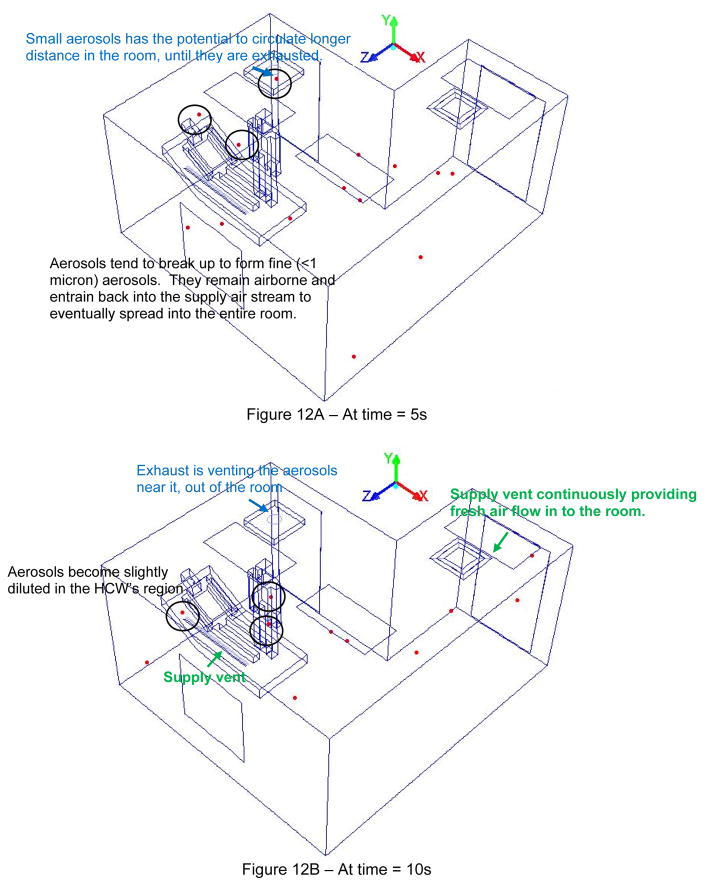
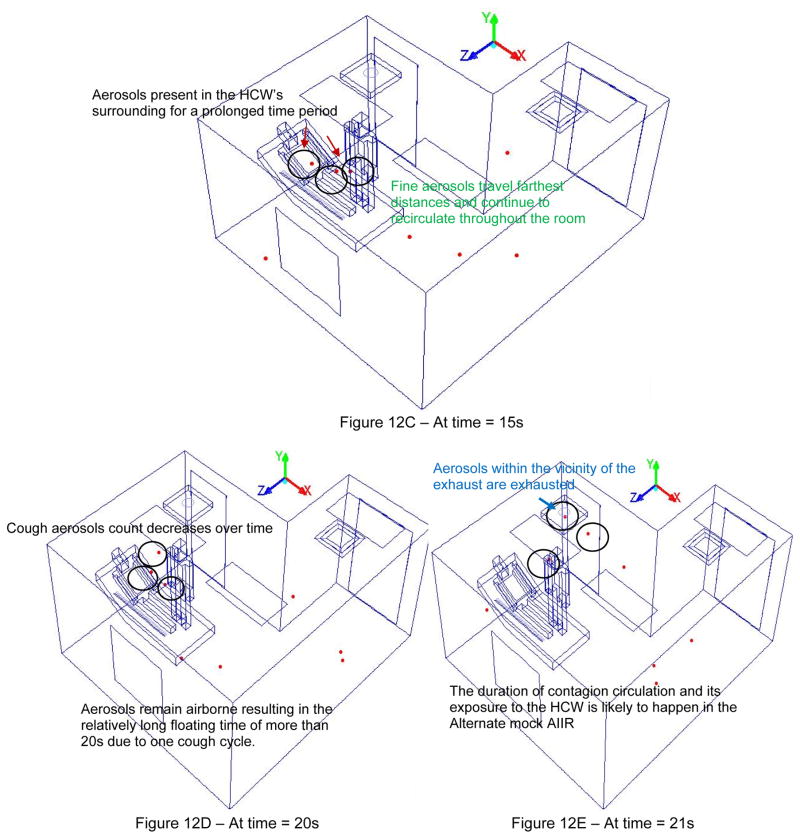
Figure 12a–12e presents the investigation of cough aerosol dispersal behavior and impact of the alternate mock AIIR ventilation configuration in preventing patient cough aerosols from entering the HCW’s breathing zone.
Figure 12.
Figure 12(A–E). Evaluation of cough aerosol dispersal behavior and impact of Alternate mock AIIR ventilation configuration in the control of HCW exposure to infectious aerosol
Within 5 s after patent’s cough is initiated, the distance between the cough aerosols increases and the occurrence of coalescence decreases and eventually stops. The cough aerosols tend to break up to form smaller sized aerosols of less than one micron diameter. They remain airborne and can entrain back into the supply air stream over a time period of 5 s and eventually spread throughout the entire room. These small aerosols have the potential to circulate longer times and distance within the room, until they are exhausted.
As the time progresses, by 10 s, the cough aerosols become slightly diluted in the HCW’s region. This is because the ceiling supply vents continue to provide fresh airflow into the room and the exhaust is venting the aerosols near it, out of the room.
However, the partition bath wall near the square supply vent makes it harder for the fresh air to enter and quickly dilute the aerosols in to the patient and HCW’s zone. This eventually resulted in cough aerosols being mixed with other airstreams and spreading into the entire room creating an unfavorable ventilation scheme for the HCW throughout their stay in the room. These airborne cough aerosols remain in the breathing vicinity of the HCW for prolonged periods and thus, have an increased potential to be inhaled by the HCW.
The cough aerosols that are in the vicinity of the main exhaust vent are exhausted from the room. This resulted in the decrease of the aerosol cough over time. However, the exhaust vent could not immediately remove the cough aerosols from portions of the room that outside the vicinity of the exhaust vent. Hence, the AIIR exhaust ventilation is not effective in immediately removing the aerosols in such a way as to prevent infectious exposures to the HCW.
The cough aerosols remain airborne resulting in the relatively long floating time of more than 21 s in the room due to one cough cycle. The duration of infectious exposure and potential disease transmission to the HCW is more likely to happen in the alternate AIIR ventilation configuration due to successive coughing cycles.
Even though the supply and exhaust vents played an important role in diluting these infectious aerosols in the HCW’s zone, the alternate AIIR ventilation is not sufficient to effectively prevent infectious exposures to the HCW.
Evaluation of original AIIR
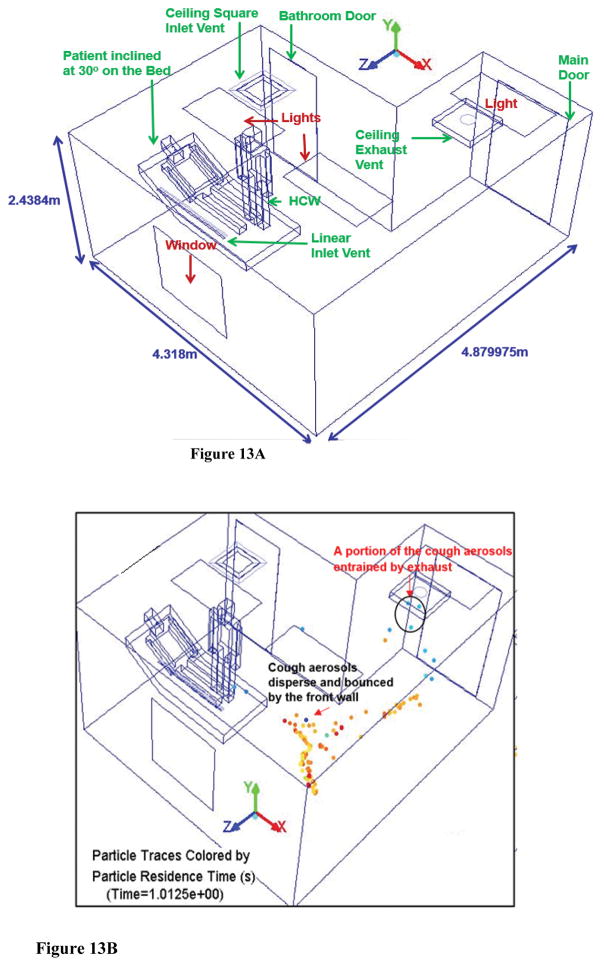
The original AIIR configuration is shown in Figure 1. The CFD analysis of the airflow patterns and the flu virus dispersal behavior in a mock original AIIR is conducted using the room geometries and layout (Figure 13a), ventilation parameters, diffuser design, thermal sources, etc.), and pressurization corresponding to that of a traditional ceiling-mounted ventilation arrangement observed in existing hospitals. A computational geometry model of the original AIIR constructed within the Industrial Ventilation Research Laboratory of the NIOSH Division of Applied Research and Technology (DART)/Engineering and Physical Hazards Branch (EPHB) at NIOSH’s Alice Hamilton research laboratories in Cincinnati is considered for the CFD study.
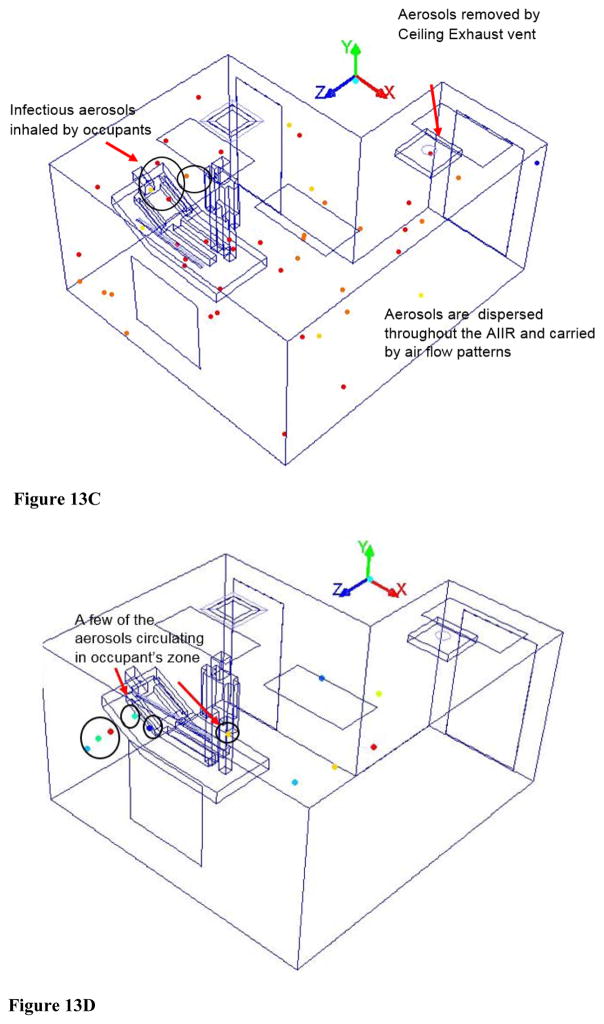
Figure 13.
Figure 13A - Schematic Layout of Original AIIR
Figure 13B – Cough aerosol dispersal in the Original AIIR at time = 1s
Figure 13C – Cough aerosol dispersal in Original AIIR at time = 5 seconds
Figure 13D - Cough aerosol dispersal in Original AIIR at time = 20 seconds
Comparison between the “alternative” to the “original” AIIR configuration
An alternate ventilation configuration (Figure 1) is then modeled to retain the linear supply diffuser in the original mock AIIR, but interchanging the square supply and exhaust locations to place the exhaust closer to the patient source and allow clean air from supply vents to flow in clean-to-dirty flow paths, originating in uncontaminated parts of the room prior to entering the contaminated patient’s air space. The alternate AIIR has the same operating conditions (the detailed description is provided in the methods section) as the original AIIR.
“Alternative” and “original” AIIR results comparison
As the patient cough cycle is introduced into the simulation, and the airborne infection dispersal is tracked in time in both original and alternate AIIR, it was found that the alternate mock AIIR removed 24% of the particles remaining in the room within the first second (Figure 9b). In comparison, the original AIIR was only effective in removing 7% of the particles remaining in the room with in the first second (Figure 13b). Within 5 s (Figure 13c), the aerosols re-enter the HCW region and recirculate throughout the original AIIR until 20 s (Figure 13d).
In comparison to original AIIR, the alternate AIIR could effectively reduce the overall number of suspended infectious aerosols in the room within the first second of patient’s cough. The alternate AIIR provides the relatively better means of controlling flows containing infectious aerosols.
Conclusions
This article presents the CFD study on the influence of an alternate ventilation configuration on the possible flow path of infectious aerosols in the NIOSH mock AIIR. This study simulated cough aerosol dispersal in the alternate NIOSH mock AIIR ventilation configuration. The NIOSH original mock AIIR has a traditional ceiling-mounted ventilation arrangement observed in existing hospitals. The alternate mock AIIR ventilation configuration is then modeled to retain the linear supply diffuser in the original mock AIIR, but interchanging the square supply and main exhaust locations. Clean air from supply vents flows from uncontaminated parts of the room and then into contaminated patient air space.
The most significant factor that affects the prevention and control of these infectious cough aerosols is the flow path between the contaminant source (patient) and the exhaust vent. The contagion is better controlled when the exhaust is placed closer to the patient source and the clean air from supply vents is allowed to flow in clean-to-dirty flow paths, originating in uncontaminated parts of the room prior to entering the contaminated patient’s air space. The cough aerosols are pulled by the exhaust vent without encountering the HCW by 0.93 s. However, not all the aerosols are vented out of the room. Therefore, even though the alternate mock AIIR ventilation configuration played a significant role in protecting the HCW from the risk exposure, this configuration is not effective in completely removing the cough aerosols from the room.
The remaining cough aerosols enter the HCW’s breathing zone. The HCW inhalation zone is large and can extend from nose to the lower part of the HCW’s body. During inhalation, the rising air stream near the HCW body pulls the air and the cough aerosols in lower areas up in to the HCW’s inhalation region and the HCW inhales these cough aerosols within 0.98 s. Hence, the alternate mock AIIR ventilation configuration provides a higher risk of transmitting the infectious disease to the HCW within the first second after patient coughs.
Within 2 s, the cough aerosols re-enter and recirculate the patient and HCW’s surrounding area resulting in pockets of old contaminated air. By this time, coalescence losses have decreased as the aerosol are no longer in very close proximity and their movement is primarily influenced by the AIIR airflow patterns. In the patient and HCW’s surrounding area away from the supply, the fresh air is failing to reach this part of the room to quickly dilute the cough aerosol concentration. It resulted in inadequate delivery of fresh air to patient and HCW zone. The exhaust was found to have minimal effect, except for those areas very close to the exhaust where high velocity is found. Hence, the alternate mock AIIR ceiling ventilation is not effective in preventing the cough aerosols from re-entering the HCW’s inhaling zone.
Within 5 s after patient’s cough, the aerosols tend to break up to form smaller sized aerosols of less than one micron diameter. They remain airborne and entrain back into the supply air stream and eventually spread into the entire room, until they are exhausted. As the time progresses, by 10s, the cough aerosols become slightly diluted in the HCW’s region. The ceiling supply vents continuously providing fresh airflow into the room and the exhaust is venting the aerosols near it, out of the room. However, the bathroom wall near the square supply vent makes it harder for the fresh air to enter and quickly dilute the aerosols in to the patient and HCW’s zone. This eventually resulted in cough aerosols being mixed with other airstreams and spreading into the entire room.
The airborne aerosols resulted in a floating time of more than 21 s in the room due to one cough cycle. The duration of contagion circulation and its potential transmission to the HCW is more likely to happen in the alternate AIIR ventilation configuration due to successive coughing cycles. Even though the supply and exhaust vents played an important role in removing and diluting these infectious aerosols in the HCW’s zone, the alternate AIIR ventilation configuration is not sufficient in controlling contagion exposures to the HCW.
Acknowledgments
The authors would like to thank Santosh Roopak Dungi, Santosh Konangi, Dr. Arvind Kishore, and are grateful for the assistance of NIOSH employee Dylan Neu and all the members at the CFD Research Laboratory at the University of Cincinnati.
The findings and conclusions in this report are those of the authors and do not necessarily represent the views of the National Institute for Occupational Safety and Health (NIOSH). Mention of product or company name does not constitute endorsement by the Centers for Disease Control and Prevention or NIOSH.
Funding
The authors express sincere gratitude for NIOSH sponsorship of this research, ASHRAE 2015–2016 Graduate Student Grant-in-Aid award support, and the high-performance computing resources of the Ohio Supercomputer Center.
References
- Adal KA, Flowers RH, Anglim AM, Hayden FG, Titus MG, Coyner BJ, Farr BM. Prevention of nosocomial influenza. Infection Control and Hospital Epidemiology. 1996;17:641–8. doi: 10.1086/647196. [DOI] [PubMed] [Google Scholar]
- ANSYS, Inc.; Release 17.0. Canonsburg, PA: ANSYS; 2015. ANSYS FLUENT User’s Guide. [Google Scholar]
- ASHRAE/ASHE. ASHRAE/ASHE Standard 170-2013, Ventilation of Health Care Facilities. Atlanta, GA: ASHRAE; 2013. [Google Scholar]
- Bean B, Rhame FS, Hughes RS, Weiler MD, Peterson LR, Gerding DN. Influenza B: Hospital activity during a community epidemic. Diagnostic Microbiology and Infectious Disease. 1983;1:177–83. doi: 10.1016/0732-8893(83)90016-0. [DOI] [PubMed] [Google Scholar]
- Blumenfled HL, Kilbourne ED, Louria DB, Rogers DE. Studies on influenza in the pandemic of 1957–1958. I. An epidemiologic, clinical and serologic investigation of an intra hospital epidemic, with a note on vaccination efficacy. Journal of Clinical Investigation. 1959;38:199–212. doi: 10.1172/JCI103789. [DOI] [PMC free article] [PubMed] [Google Scholar]
- CDC. Guidelines for preventing the transmission of tuberculosis; healthcare settings, 2005. MMWR. 2005;54:1–141. [PubMed] [Google Scholar]
- Drinka PJ, Gravenstein S, Krause P, Nest L, Dissing M, Shult P. Reintroduction of influenza A to a nursing building. Infection Control & Hospital Epidemiology. 2000;21:732–5. doi: 10.1086/501715. [DOI] [PubMed] [Google Scholar]
- Dukowicz JK. A particle-fluid numerical model for liquid sprays. Journal of Computational Physics. 1980;35:229–53. [Google Scholar]
- FGI. Guidelines for Design and Construction of Hospitals and Outpatient Facilities. Dallas, TX: Facilities Guidelines Institute; 2014. http://fgiguidelines.org/ [Google Scholar]
- FLUENT. Computational Fluid Dynamics Software, Version 16.1. Canonsburg, PA: Fluent Incorporated; 2015. [Google Scholar]
- Ghia U, Konangi S, Kishore A, Gressel M, Mead K, Earnest G. Assessment of healthcare worker exposure to pandemic flu in hospital rooms. ASHRAE Transactions. 2012;118(1):442–9. [PMC free article] [PubMed] [Google Scholar]
- Gupta JK, Lin C-H, Chen Q. Flow dynamics and characterization of a cough. Indoor Air. 2009;19(6):517–25. doi: 10.1111/j.1600-0668.2009.00619.x. [DOI] [PubMed] [Google Scholar]
- Guyton AC, Hall JE. Textbook of Medical Physiology. Philadelphia, PA: Elsevier Health Sciences; 2011. [Google Scholar]
- Kowalski WJ, Bahnfleth W. Airborne respiratory diseases and mechanical systems for control of microbes. Heating/Piping/Air Conditioning HPAC Engineering. 1998;70:34–48. [Google Scholar]
- Li Y, Leung GM, Tang JW, et al. Role of ventilation in airborne transmission of infectious agents in the built environment—A multidisciplinary systematic review. Indoor Air. 2007;17(2007):2–18. doi: 10.1111/j.1600-0668.2006.00445.x. [DOI] [PubMed] [Google Scholar]
- NASA/SP-2010-3407. Human Integration Design Handbook (HIDH) Vol. 1. Washington, DC: NASA; 2010. Man-Systems Integration Standard, “Anthropometrics and Biomechanics”. [Google Scholar]
- O’Rourke PJ. PhD Thesis. Princeton, New Jersey, USA: Princeton University; 1981a. Collective drop effects on vaporizing liquid sprays. [Google Scholar]
- O’Rourke PJ. Collective Drop Effects on Vaporizing Liquid Sprays. Los Alamos, N.M: Los Alamos National Lab; 1981b. [Google Scholar]
- O’Rourke PJ. Numerical simulation combustion phenomena. Los Alamos, NM: Springer; 1985. The KIVA Computer Program for Multidimensional Chemically Reactive Fluid Flows with Fuel Sprays; pp. 74–89. [Google Scholar]
- Pachucki CT, Pappas SA, Fuller GF, Krause SL, Lentino JR, Schaaff DM. Influenza A among hospital personnel and patients: Implications for recognition, prevention, and control. Arch Intern Med. 1989;149:77–80. [PubMed] [Google Scholar]
- Papineni RS, Rosenthal FS. The size distribution of droplets in the exhaled breath of healthy human subjects. Journal of Aerosol Medicine. 1997;10:105–61. doi: 10.1089/jam.1997.10.105. [DOI] [PubMed] [Google Scholar]
- Patankar S, Spalding D. A calculation procedure for heat, mass and momentum transfer in three-dimensional parabolic flows. Int J Heat Mass Transfer. 1972;15:1787–806. [Google Scholar]
- Patriarca PA, Weber J, Parker RA, Hall WN, Kendal AP, Bregman DJ, Schonberger LB. Efficacy of influenza vaccine in nursing homes: Reduction in illness and complications during an influenza A (H3N2) epidemic. JAMA. 1985;253:1136–9. [PubMed] [Google Scholar]
- Rosenstock L, Olenec C, Wagner GR. The national occupational research agenda: A model of broad stakeholder input into priority setting. American Journal of Public Health. 1998;88:353–6. doi: 10.2105/ajph.88.3.353. [DOI] [PMC free article] [PubMed] [Google Scholar]
- Salgado CD, Farr BM, Hall KK, Hayden FG. Influenza in the acute hospital setting. The Lancet Infectious Diseases. 2002;2(3):145–55. doi: 10.1016/s1473-3099(02)00221-9. [DOI] [PubMed] [Google Scholar]
- Siegel JD, Rhinehart E, Jackson M, Chiarello L Health Care Infection Control Practices Advisory Committee. Guideline for isolation precautions: Preventing transmission of infectious agents in health care settings. American Journal of Infection Control. 2007;35:S65–164. doi: 10.1016/j.ajic.2007.10.007. [DOI] [PMC free article] [PubMed] [Google Scholar]
- Strausbaugh LJ, Bridges CB, Jernigan DB, Liedtke LA. Influenza: Prevention and detection in acute care settings. Infections in Medicine. 2002;19:310–7. [Google Scholar]
- Sugaya N, Kusumoto N, Suzuki Y, Nerome R, Nerome K. Large sequential outbreaks caused by influenza A (H3N2) and B viruses in an institution for the mentally handicapped. Journal of Medical Virology. 1996;50:120. doi: 10.1002/(SICI)1096-9071(199610)50:2<120::AID-JMV4>3.0.CO;2-C. [DOI] [PubMed] [Google Scholar]
- Tang JW, Eames Y, Li I, Chan PK, Ridgway GL. Factors involved in the aerosol transmission of infection and control of ventilation in healthcare premises. Journal of Hospital Infection. 2006;64:100–14. doi: 10.1016/j.jhin.2006.05.022. [DOI] [PMC free article] [PubMed] [Google Scholar]
- VanSciver M, Miller S, Hertzberg J. Particle Image Velocimetry of Human Cough. Aerosol Science and Technology. 2011;45(3):415–22. [Google Scholar]
- Weingarten S, Friedlander M, Rascon D, Morgan AM, Meyer RD. Influenza surveillance in an acute-care hospital. Archives of Internal Medicine. 1988;148:113–6. [PubMed] [Google Scholar]
- Zadeh MM, Bridges CB, Thompson WW, Arden NH, Fukuda K. Influenza outbreak detection and control measures in nursing homes in the United States. Journal of the American Geriatrics Society. 2000;48:1310–5. doi: 10.1111/j.1532-5415.2000.tb02606.x. [DOI] [PubMed] [Google Scholar]


