Abstract
We propose using maximum a-posteriori (MAP) estimation to improve the image signal-to-noise ratio (SNR) in polarization diversity (PD) optical coherence tomography. PD-detection removes polarization artifacts, which are common when imaging highly birefringent tissue or when using a flexible fiber catheter. However, dividing the probe power to two polarization detection channels inevitably reduces the SNR. Applying MAP estimation to PD-OCT allows for the removal of polarization artifacts while maintaining and improving image SNR. The effectiveness of the MAP-PD method is evaluated by comparing it with MAP-non-PD, intensity averaged PD, and intensity averaged non-PD methods. Evaluation was conducted in vivo with human eyes. The MAP-PD method is found to be optimal, demonstrating high SNR and artifact suppression, especially for highly birefringent tissue, such as the peripapillary sclera. The MAP-PD based attenuation coefficient image also shows better differentiation of attenuation levels than non-MAP attenuation images.
OCIS codes: (170.4500) Optical coherence tomography, (110.4500) Optical coherence tomography, (100.2980) Image enhancement, (100.2000) Digital image processing, (110.4280) Noise in imaging systems, (170.4460) Ophthalmic optics and devices
1. Introduction
Standard OCT has been widely used for the imaging and diagnosis of the posterior eye for over 20 years [1, 2], due to its high resolution, speed, and sensitivity. There have been general improvements in both resolution, acquisition speed, and sensitivity over the past two decades, due to the development of spectral domain OCT, swept source lasers, fiber optic designs, and other hardware and software improvements. In addition, there have been many functional extensions to OCT [3], such as Doppler OCT [4–7], optical coherence angiography [7–10], polarization sensitive OCT [11–18], and spectroscopic OCT [19–22].
Although the contrast properties of these functional OCTs are well investigated, the property of the most basic contrast, i.e., OCT intensity, had not been extensively investigated. In a recent publication, we have highlighted a commonly encountered problem due to low SNR in standard OCT B-scans [23]. For example, in posterior eye imaging, the vitreous body appears with a weak random signal, where one expects a much lower signal because its purpose is to be transparent.
A conventional method to improve image quality involves repeatedly acquiring multiple B-scans at the same location, and then averaging the signal intensity [24, 25]. Although this intensity averaging is effective for reducing speckle contrast and/or improving image SNR, it does not reduce bias [23], which we denote as “noise-offset”. To compensate for this noise-offset, histogram equalization [26] or a simple intensity threshold may be applied, but this would sacrifice the quantitative nature of the signal.
Another commonly encountered problem is the appearance of polarization artifacts in standard OCT images, especially if the OCT system is equipped with a flexible fiber probe [27] or if it images highly birefringent tissue, such as the peripapillary sclera [24, 28]. Polarization diversity (PD) detection can remove polarization artifacts by summing the OCT signal intensities of the vertical and horizontal polarization detection channels [28, 29]. However, dividing the signal power into two detection channels inevitably reduces the sensitivity. This is because the noise power is doubled when using two detectors instead of one. Therefore, PD-detection still results in a reduction of image SNR, compared with standard OCT.
Hence, we have identified two problems in OCT imaging which we wish to solve, i.e, noise-offset and the corruption of images by polarization artifacts.
To solve these two problems, we present an image composition method based on PD-detection to suppress polarization artifacts along with a maximum a-posteriori (MAP) intensity estimation to reduce noise-offset while preserving the quantitative nature of the signal intensity.
MAP estimation has been applied to OCT intensity [23] and phase estimation [30], and to birefringence estimation in polarization sensitive OCT [31–33]. Among these, MAP OCT intensity estimation allows for estimation of signal intensity by utilizing the signal and noise statistics. If used on the image composition of repeatedly obtained B-scans, it provides an image with less noise-offset than images obtained from conventional intensity averaging methods [23]. In addition, because the estimated intensity has less noise-induced offset, it is suitable for further statistical analysis. The additional information provided by the precision and reliability of the MAP intensity and attenuation coefficient estimates also enhances the quantitative accuracy of further analysis of OCT signals. For example, we can rationally reject untrustable signals.
Here, we combine PD-OCT with MAP estimation. This combination will provide a more quantitative estimation of the total light energy. This method is compared with combinations of non-PD-OCT and intensity averaging, PD-OCT and intensity averaging, and non-PD-OCT and MAP estimation. Non-PD-OCT is emulated by the coherent composition of two PD-detection channels. These comparisons show the superiority of the MAP estimation methods.
In addition, we demonstrate depth-localized attenuation coefficient imaging [34] based on the OCT intensity estimated by MAP estimation. We show that the attenuation coefficient estimation from MAP intensity images results in a broader dynamic range and better differentiation of estimated attenuation levels compared with attenuation images derived from averaged intensity images.
2. Theory of high-contrast and polarization-artifact-free OCT composition
2.1. MAP estimation of OCT amplitude and intensity
In this section, we describe the theory of MAP estimation of OCT intensity. This theory was previously described in [23], but repeated for completeness. More details are also provided here on the implementation of the algorithm. We first describe a MAP estimation of the OCT amplitude, and then show that the square of the MAP estimate of the amplitude is equivalent to the MAP estimate of the OCT intensity.
2.1.1. MAP estimation of OCT amplitude
To reduce noise-offset and quantitative nature of the PD-OCT method, we utilize MAP estimation of the OCT signal intensity [23]. The MAP estimation method uses the statistics of the OCT signal and noise. It is assumed that both the real and imaginary parts of an OCT signal are affected by independent and identically distributed (i.i.d.) additive white Gaussian noise. Hence, the OCT signal amplitude is modeled by a Rice distribution. The probability density function of the observed OCT signal amplitude, a, given the “true” signal amplitude, α, is given by [35]
| (1) |
where σ2 is the variance of the real or imaginary parts of the additive white Gaussian noise, which are equal in value by assumption, and I0 is the 0-th order modified Bessel function of the first kind. In practice, the depth-dependent noise variance σ2 is estimated from the noise data, which is obtained by taking A-scans while obstructing the probe beam. The noise variance, σ2, is defined as the average of the variances of the real and imaginary parts. Note that in some of the existing literature, the symbol of σ2 denotes a noise energy which is the sum of the variances of the real and imaginary parts. In contrast, we follow the notation introduced by Goodman [35].
By treating the underlying true amplitude α as a variable, and the observed values a and σ2 as parameters, the likelihood of the true signal amplitude under specific observations of signal amplitude a and noise variance σ2 can be expressed as:
| (2) |
The combined likelihood function for a set of independent and identically distributed (i.i.d) measured amplitudes a = {a1, · · · , an, · · · , aN}, which were obtained from repeated B-scans at the same location, is given by
| (3) |
Therefore, MAP estimation of the true signal amplitude from this set of measurements is given as the value of α which maximizes the posterior distribution, l (α; a, σ2)π(α),
| (4) |
where π(α) is the prior distribution of the true amplitude. In our case, the prior distribution is assumed to be uniform (non-informative).
2.1.2. MAP estimation of OCT intensity
By defining the true value of the OCT intensity as υ = α2, the MAP estimation of the intensity is expressed as
| (5) |
where lυ (υ; i, σ2) is the likelihood function of the intensity and π(υ) is the prior distribution of the true intensity. The set of measured intensity is square of amplitudes .
If we assume a uniform prior π(υ), it can be shown that
| (6) |
A proof of this is given in Appendix A. For convenience of implementation, we first compute the MAP estimate of the amplitude, and then square it to obtain the MAP estimate of the intensity.
2.1.3. Reliability of MAP estimation
From the likelihood ratio statistics of the combined likelihood [Eq. (4)], one may also obtain the 68% credible interval of the amplitude estimation [36]. The likelihood ratio statistic T (α) is given by
| (7) |
Theory states that this test statistic has a -distribution (i.e., a χ2-distribution with one degree of freedom) [36], hence the 68% credible interval is given as the region of α where T (α) ≤ 0.99. Half of this interval is an approximate estimate for the standard deviation of the amplitude estimation σα, and the amplitude estimation error is defined as . The reciprocal of the estimation error is taken as the precision of the amplitude estimates. Note that this precision measure only accounts for the estimation variance, not the estimation bias.
A similar method of credible interval calculation was used in our earlier publication [23], but it was defined by a different threshold T (α) ≤ 3.84, which provides the 95% credible interval. We have changed the 95% credible interval to the 68% credible interval because it is a good approximation to the two standard deviation interval of the MAP amplitude estimate [37,38].
The precision of the MAP intensity estimation is then computed by error propagation, in which is propagated from the amplitude to the intensity. In particular, the uncertainty of the MAP intensity estimate (συ) is defined as συ ≡ 2 σα. The precision of the MAP intensity estimate is then defined as .
Higher intensity regions are expected to have higher fluctuations, and hence lower precision. However, this precision is mainly dominated by the intensity itself, and is not a good measure of the estimate reliability. Therefore, it is informative to also define an estimate reliability measure as a squared-intensity-to-error ratio . In decibel scale, it is expressed as 20 log10 ( /συ). It is also noteworthy that the intensity reliability is proportional to the squared-amplitude-to-error ratio according to: .
2.1.4. Numerical implementation of the probability density function
Note that because the zeroth order Bessel function of the first kind, I0(z), is of order 𝒪 (exp(z2)), it is numerically divergent and cannot be used in a numerical implementation. To overcome this problem, we use the exponentially-scaled modified Bessel function of the first kind. Therefore, in our numerical implementation, the probability density function, Eq. (1), is given by
| (8) |
where the final square-bracket component comes from the exponentially scaled modified Bessel function of the first kind. We numerically compute the first exponential part and the part in square brackets independently, then multiply them.
The same algorithms of lookup table generation and peak searching were used in this manuscript compared with our previously published method [23]. However, the algorithm was newly implemented in Python 2.7.11, while it was implemented in Matlab 2014b in [23].
The computation time for a 500-amplitude-level by 200-noise-level lookup table is 14.1 s for lookup table generation and 27.3 s for the MAP estimation using a Windows 10 PC, with an Intel Core i7-5930K processor and 32GB of RAM.
2.2. OCT image compositions
We assume that multiple, N, B-scans are obtained at the same location of the sample by a PD-detector, resulting in 2N frames. That is, N B-scans × 2 PD-detection channels. In this section, we describe four image composition methods used to create a single composite image from the 2N frames. The main purpose of this section is to present a polarization-artifact-free, high-contrast OCT image composition method by using PD-detection and MAP intensity estimation (MAP PD-OCT or MPD). This composition method is described in Section 2.2.2. In addition, the standard composition methods also presented are: first, a polarization-artifact-free OCT based on intensity averaging (standard PD-OCT or SPD, Section 2.2.1); second, intensity-averaging combined with coherently combined PD-detected signals (standard non-PD image or SnPD, section 2.2.3); third, MAP estimation combined with coherently combined PD-detected signals (MAP non-PD image or MnPD, Section 2.2.3).
2.2.1. Standard PD-OCT
The PD-detection method uses two complex OCT signals from two orthogonal detection-polarizations Eh (z) and Ev (z), where the subscripts h and v denote horizontal and vertical polarization, respectively. A standard PD-OCT (SPD) image is obtained by averaging N frames for each PD-detection channel and summing the averaged frames as:
| (9) |
where the over-line indicates averaging over the N frames, and the subscript SPD is for standard PD. Because the optical energies of the two detection polarizations are summed in this image, ISPD is free from polarization-artifacts. On the other hand, intensity averaging along the frames results in significant signal bias in low-signal-intensity regions, which is denoted by noise-offset in this manuscript.
2.2.2. High-contrast PD-OCT by MAP intensity estimation (MAP PD-OCT)
MAP intensity estimation can remove the noise-offset found in standard PD-OCT, while retaining the polarization-artifact-free state of PD-OCT. High-contrast polarization-artifact-free PD-OCT can be obtained by:
| (10) |
where the hat represents the MAP intensity estimate over frames [Eq. (5)], and the subscript MPD is for MAP-PD.
The estimation error of IMPD is the summation of the estimation errors of and , so the precision of IMPD is defined as its reciprocal, , where σ2υ,h and σ2υ,v are the intensity estimation errors of the horizontal and vertical detection polarizations (see the last paragraph of Section 2.1.3). The reliability is then defined as .
2.2.3. Standard and MAP non-PD-OCT
Non-PD OCT can be emulated using OCT signals obtained by PD-detection. A single frame of a pseudo-non-PD-OCT image is obtained by coherent composition [17] of OCT signals from the two orthogonal polarization channels according to:
| (11) |
where θ is a depth-independent relative phase offset, defined as , where z is the pixel depth. As is evident in this equation, the coherent composition is a complex average with adaptive phase correction. Because coherent composition is effectively complex averaging, it suppresses noise and improves the SNR.
The N frames from the non-PD-OCT can be combined either by intensity averaging (standard contrast) or MAP intensity estimation. The standard, non-PD-OCT contrast is obtained by averaging the non-PD-OCT frames in their intensity as:
| (12) |
where the subscript SnPD is for standard non-PD. This image suffers from noise-offset and polarization artifacts, but would have a higher SNR than would standard PD-OCT.
High-contrast non-PD-OCT is obtained by combining the non-PD-OCT frames using MAP intensity estimation:
| (13) |
where the subscript MnPD is for MAP non-PD. This image has a low noise-offset because of the MAP intensity estimation. Although it is affected by polarization artifacts, the noise-suppression effect of complex averaging provides a higher SNR in comparison to MAP PD-OCT.
The properties of the four composition methods are summarized in Table 1.
Table 1.
A summary of OCT composition methods.
3. Attenuation coefficient imaging
3.1. Attenuation coefficient calculation
Attenuation coefficient images are generated for each of the four types of composite images by applying a method previously presented by Vermeer et al. [34]. Here, the depth-dependent attenuation coefficient μ is computed as
| (14) |
where zi is the depth of i-th depth pixel, I (zi) is the intensity of the composite OCT image, Δ is the inter-pixel distance, and M is the number of pixels per A-line.
3.2. Signal-roll-off correction
For attenuation coefficient estimation, the OCT intensity is corrected to account for the depth-dependent sensitivity roll-off. The depth-dependent SNR (SNR(zi)) was measured using a mirror sample and a neutral density (ND) filter at approximately each 275-μm depth interval from 0 to 3 mm in air (or each 200-μm depth interval in tissue). The depth-dependent signal decay curve C(zi) is then computed from the SNR and the depth-dependent noise energy (σ2(zi)) as:
| (15) |
This signal decay curve is transformed to logarithmic scale, then fit by a quadratic function, and is used as a correction factor. Two correction factors are obtained independently for the two PD-detection channels, referred to as Ch (zi) and Cv (zi) for the horizontal and vertical channels, respectively. Another correction factor, CnPD(zi), is obtained from the coherent composite (non-PD) OCT signal.
The PD-OCT signals are corrected by using Ch (zi) and Cv (zi) in:
| (16) |
where and represents intensity averaging or MAP estimation of |Eh (zi)|2 and |Ev (zi)|2 respectively. That is, and or and are substituted into Eq. (16). From Eq. (16), we may then obtain (zi), which are the corrected standard or MAP PD-OCT intensities, and are substituted into I(zi) of Eq. (14). Note that this signal-roll-off correction was performed only for attenuation coefficient imaging, but not for standard OCT imaging.
It should be noted that an estimator with noise floor subtraction is applied in Ref [34]. However, the subtraction is not applied to the intensity averaging estimator here. To make consistent with intensity imaging comparison, attenuation calculations based on average-only and MAP estimates are used.
3.3. Precision and reliability of the attenuation coefficient estimation
As we obtain the error from the MAP intensity estimate, the error in intensity can be used to calculate the attenuation coefficient precision. This calculation is performed by the method of error propagation.
The estimation error of the attenuation coefficient is computed by using the error propagation method based on Eq. (14), which relates the MAP intensity estimation error, , to the attenuation coefficient error, , by
| (17) |
where is the estimation error of the OCT intensity defined in Section 2.1.3. According to Eq. (14), the partial derivatives in this equation are evaluated as ∂μ(zi)/∂I(zi) = μ(zi)/I(zi) and for i ≠ j. Therefore, the estimation error of the attenuation coefficient at depth zi can be expressed by
| (18) |
The first term in the equation can be interpreted as the error contribution from the pixel of interest, and the second term is the error contribution due to all of the pixels below it. Using this relation, one may calculate the attenuation coefficient precision, .
Because the precision is mainly dominated by the attenuation coefficient, it is also informative to calculate the squared-attenuation-to-error ratio . This may also be expressed according to decibel scale as 20 log10 (μ(zi)/σμ (zi)). This ratio can help determine the regions in which the attenuation image is not conveying any meaningful information, so it is a measure of the reliability of the attenuation estimation.
4. Methods
4.1. Jones-matrix OCT system
We used a 1.06-μm multifunctional Jones-matrix OCT for the experimental study. This system uses a wavelength swept laser light source (AXSUN 1060, Axsun Technology Inc., MA, USA) with a center wavelength of 1,060 nm, a scanning bandwidth of 123 nm, full-width-at-half-maximum bandwidth of 111 nm, and a scanning rate of 100 kHz. Two incident (probe) polarization states are multiplexed by a polarization-dependent delayer, in which one polarization travels a longer optical path than the other. As a result, the OCT signal of the delayed input polarization appears farther from the zero-delay position than does the input polarization which was not delayed. The interference signal detection is performed by a PD-detection module. In this way, the orthogonal output polarizations are measured by two independent dual-balanced photodetectors, and we obtain four OCT images which correspond to each entry of the Jones matrix.
The axial resolution and axial pixel separation in tissue are 6.2 μm and 4.0 μm, respectively. The system sensitivity was measured to be 91 dB. 490 A-lines are taken per B-scan and the image is truncated into 480 depth-pixels per line.
More details of the hardware and software of this system are described in Refs. [17] and [18], respectively.
4.2. PD and non-PD image formation from Jones-matrix OCT
The PD image composition methods described in Section 2.2 are based on PD-detection, which provides two OCT signals with two orthogonal output (detection) polarizations. On the other hand, the JM-OCT system provides four OCT signals, because it also multiplexes the two input polarization states. To apply the image composition methods, we need to create two OCT signals, that emulate the PD-detection signals from the four OCT signals.
To emulate non-Jones matrix PD-detection, we combine the two multiplexed incident polarization signals. The mutual phase difference between two incident polarizations is first estimated by:
| (19) |
where the summation is over all pixels in an A-line. This equation represents two independent equations for θh and θv as identified by the subscript. For θh, the subscripts “h, v” should be read as h, while for θv it should be read as v. We use the same convention in the subsequent equations. and represent OCT signals obtained from the first and the second incident polarizations, as indicated by the superscripts (1) and (2), respectively. The reconstructed polarization diversity signals are then given by:
| (20) |
In Section 2.2.3, we describe that the pseudo-non-PD-OCT is obtained as a complex composition of two PD-OCT signals [Eq. (11)]. However, in this particular study, the pseudo-non-PD-OCT is obtained by directly applying the complex composition of the four OCT signals of JM-OCT, as described in Section 3.6 of Ref. [17], rather than Eq. (11). The reason is that these two methods are theoretically equivalent, and the latter is computationally less intensive.
4.3. Measurement and validation protocol
To evaluate and compare the performances of the composition methods, the (right) optic nerve head (ONH) and (right) macula of a 29-year-old male subject were imaged. This subject was without any marked disorders except non-pathological myopia (−7.45D spherical equivalent). Four repeated B-scans, with lateral widths of 6.0 mm, were taken at a single position, and the four types of compositions were created. We have previously shown that a four-fold scan is a good compromise between image quality and acquisition speed for systems of this sensitivity range and acquisition rate [23].
The compositions were generated by a custom-made program written in Python 2.7.11 with numerical computation packages Numpy 1.9.2-1 and Scipy 0.15.1-2. The signal intensity ratio (SIR) between the retinal pigment epithelium and the vitreous were computed as a metric for the performance evaluation of the composition methods.
The data acquisition protocol adhered to the tenets of the Declaration of Helsinki, and was approved by the institutional review board of the University of Tsukuba.
5. Results and discussions
5.1. Intensity imaging
Figure 1 shows the intensity images from the macula and ONH. The images are composed using intensity averaging in Fig. 1(a)–1(d) (first row, standard non-PD- and PD-OCT in Table 1) and MAP estimation in Figs. 1(e)–1(h) (second row, MAP non-PD- and PD-OCT in Table 1). The four images on the left [Figs. 1(a), 1(b), 1(e), and 1(f)] are non-PD-OCT, and the four images on the right [Figs. 1(c), 1(d), 1(g), and 1(h)] are PD-OCT. Zero dB is set as the 99.9th percentile intensity for each image.
Fig. 1.
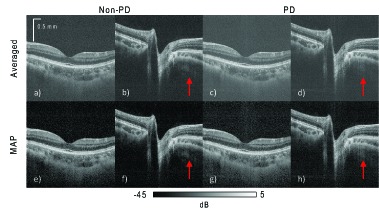
Intensity images of the macula and ONH. The four images on the left-hand side, (a), (b), (e), and (f), use non-PD OCT. The four on the right (c), (d), (g), and (h), are PD-OCT images. The images in the first row are composed by intensity averaging four repeated B-scans. Images in the second row are composed by MAP estimation from the same four repeated B-scans. Zero dB corresponds to the 99.9th percentile intensity in each image. The SIRs between the retinal pigment epithelium and vitreous, calculated from the macula images, are 31.1 dB for the MAP non-PD-OCT (e), 24.5 dB for averaging non-PD-OCT (a), 28.4 dB for MAP PD-OCT (g), and 21.7 dB for averaged PD-OCT (c).
By comparing the images made by intensity averaging (first row) and the MAP images (second row), it can be seen that the intensity averaged images show a higher noise-offset in the low intensity regions, and have lower contrast compared with the corresponding MAP images. The SIR is measured to be 6.7 dB higher in the MAP PD-OCT image [Fig. 1(h)] than in the corresponding averaged image [Fig. 1(d)]. This indicates that MAP estimation over repeated frames is more effective in improving image contrast than intensity averaging over the same number of repeated frames. This is also evident qualitatively, as the MAP-estimated images in the second row appear with better contrast than the averaged images in the first row. Hence, we conclude that MAP estimation provides better contrast than intensity averaging.
By comparing non-PD (left four) and PD (right four) images, it is evident that PD-detection and image composition suppresses polarization artifacts significantly. For example, non-PD images show polarization artifacts in the peripapillary sclera of the ONH, denoted by red arrows in Figs. 1(b) and 1(f), while they are strongly suppressed in the PD images [Figs. 1(d) and 1(h)]. On the other hand, the non-PD-OCT images show slightly better contrast than the corresponding PD-OCT images.
The non-PD MAP macula image [Fig. 1(e)] has a SIR around 2.7 dB higher than the PD-OCT MAP image [Fig. 1(g)]. The greater SIR of the non-PD image is due to the complex averaging of four Jones elements, rather than just two Jones elements as in PD-OCT.
For PD-OCT, the probe beam power is split into two polarization detection channels, while in standard (non-PD) OCT, it is not. Dividing the power evenly into two detection channels results in a 3-dB sensitivity loss, because the noise power is doubled when using two detectors instead of one.
Hence, PD-OCT suffers from a SNR penalty compared with non-PD-OCT, although it can effectively suppress polarization artifacts.
Figure 2 shows contour plots of 2D histograms of MAP and average intensities of corresponding pixels in non-PD [Fig. 2(a)] and PD [Fig. 2(b)] images of the ONH. The red line is the line of equal intensities for MAP estimation and intensity averaging. MAP estimation intensity is broadly spread at low averaged intensity. It indicates that the MAP composition method can estimate far lower intensities than the intensity averaging. The cluster of pixels at the MAP intensity of −85.8 dB in Fig. 2(a) and of −87.5 dB in Fig. 2(b) correspond to the lowest possible MAP estimable value in their respective estimation schemes, and correspond to the single peaks in histograms [Figs. 3(f) and 3(h)].
Fig. 2.
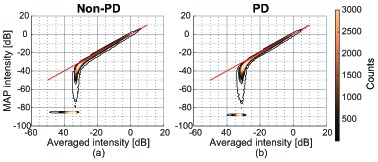
Contour plots of 2D histograms of MAP and average intensities of corresponding pixels in non-PD (a) and PD (b) images of the ONH. The red line is the line of equal intensities for MAP and averaging.
Fig. 3.
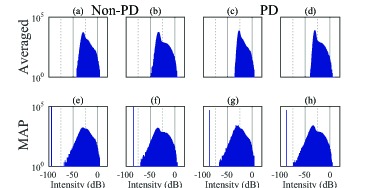
Histograms of the intensity images from the macula and ONH, corresponding to the images in Fig. 1. The same labels are assigned to the corresponding sub-figures in Fig. 1. Zero dB corresponds to the 99.9th percentile intensity in each image. The histograms on the left-hand side, (a), (b), (e), and (f), correspond to non-PD images. The histograms on the right-hand side, (c), (d), (g), and (h), correspond to PD images. The first row corresponds to intensity-averaged images. The second row corresponds to MAP images.
The histograms in Fig. 3 also confirm the observations in Fig. 1. That is, significantly lower signal intensity is found with MAP estimation (second row), compared with averaging (first row). As shown in Fig. 4, when back-projecting the low intensity pixels (pixels with intensities less than −50 dB) to their spatial locations, we find that the low intensity pixels in the MAP intensity images are broadly distributed in the vitreous and deep regions. According to the histograms of the averaged images (Fig. 3, first row), the low intensities appear to be shifted up. This suggests that a large estimation noise-offset exists in the low intensity regions in the averaged images. Among the averaged images (first row), the upward shift was slightly higher in PD-OCT (right two) than in non-PD-OCT (left two). This is because the number of intensity-averaged frames used to form a PD-OCT image is twice the number for non-PD-OCT. Namely, each of the two frames of the non-PD-OCT image is formed by the complex averaging (coherent composition) of two frames, rather than intensity averaging. Complex averaging does not result in a signal shift in low intensity regions.
Fig. 4.
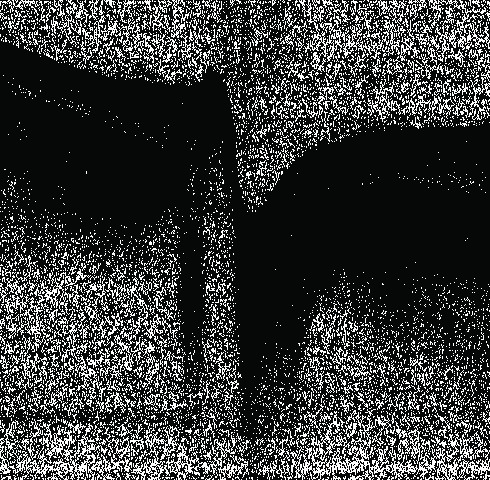
Binary map represents the location of pixels where intensities less than −50 dB in Fig. 1(h). Black means pixel has intensity larger than or equal to −50 dB and white means less than −50 dB. There are many pixels in the MPD ONH image with intensities less than −50 dB. They are located in both the vitreous and deep regions.
The single peaks seen in the histograms of the MAP intensity images at the low intensity values are situated at the lowest possible estimable value in that particular numerical estimation scheme. For our purposes, those corresponding pixels can be considered to have zero intensity. The same issue has also been discussed in our previous publication [23].
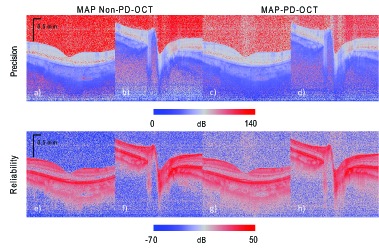
When examining the maps of intensity estimation precision [Figs. 5(a)–5(d)], it can be seen that high intensity regions, such as the retinal pigment epithelium (RPE) have low precision (with large error), while the low intensity regions, such as the vitreous, have a high precision (and small errors). This is logical, because the higher intensity regions are expected to have higher intensity fluctuations. On the other hand, the reliability of estimation, as measured by the squared-intensity-to-error ratio, [Figs. 5(e)–5(h)] shows that the estimation reliability is usually higher in the higher intensity regions.
Fig. 5.
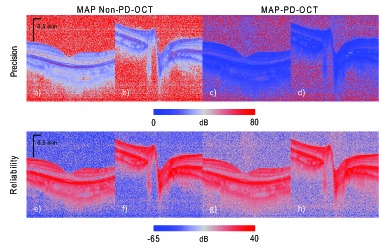
Maps of MAP intensity precision (first row) and the reliability (squared-intensity-to-error ratio, second row). The first and second columns are for MAP non-PD-OCT estimation, and the third and fourth columns are for MAP-PD-OCT. The first and third columns are of the macula, while the second and fourth columns are of the ONH.
Figure 6 shows contour plots of 2D histograms of MPD intensity and reliability [Fig. 6(a)], and MPD intensity and precision [Fig. 6(b)] of the macula. In general, there is positive correlation between intensity and reliability, and negative correlation between intensity and precision. There is a large cluster of pixels with the intensity of −86.7 dB (red arrows). −86.7 dB is the predefined minimum value of the estimation, i.e., all pixels having an intensity equal or lower than this value are regarded as having this minimum value. Because of the low SNR, these pixels also have a low reliability. However, as the intensity values are low, the fluctuation of the original OCT intensity is low, so the estimated precision is high.
Fig. 6.
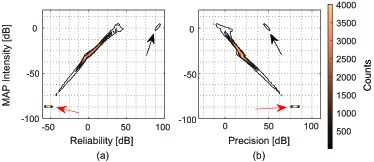
Contour plots of 2D histograms of MPD intensity and reliability (a), and MPD intensity and precision (b) of the macula.
There are also 98 pixels that have high intensity (around 0 dB of MAP intensity), high reliability (greater than 70 dB), and intermediate precision (50 dB) as indicated by the black arrows in Fig. 6. By back-projecting these pixels in the original image, it was found that these are isolated high intensity pixels located at the retinal surface and RPE.
5.2. Attenuation imaging
Attenuation coefficient imaging provides information of the light-scattering properties of the tissue, rather than the back-scattered intensity information obtained from standard OCT intensity images. We computed the attenuation coefficient images from the ONH and the macula (Fig. 7) from the composite intensity images described in Section 2.2 by the method described in Section 3 [34].
Fig. 7.
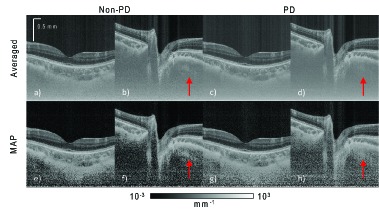
Attenuation images of the macula and ONH. The four images on the left-hand side, (a), (b), (e), and (f), are for non-PD OCT. The four images on the right-hand side, (c), (d), (g), and (h), are for PD-OCT. The images in the first row are composed using the intensity averaging of four repeated B-scans. Images in the second row are composed by MAP estimation from the same B-scans.
It can be seen that, for the images of the vitreous shown, the MAP attenuation images (Fig. 7 second row) have lower estimated attenuation coefficients than the intensity averaged attenuation images (Fig. 7, first row). Hence, the MAP attenuation images show higher contrast and dynamic range than do averaged attenuation images.
Among the MAP attenuation coefficient images (Fig. 7, second row), the non-PD images [Figs. 7(e) and 7(f)] appear with the lowest attenuation coefficient at the vitreous. However, there are evident polarization artifacts seen as alternating dark and light bands in depth in the peripapillary sclera region [arrow in Fig. 7(f)], while in the PD-OCT images [Figs. 7(g) and 7(h)], these artifacts are suppressed [particularly in Figs. 7 (h)]. Hence, MAP PD-OCT is the optimal image composition method for imaging regions with high birefringence, while MAP non-PD-OCT can be a good choice for imaging regions with no or little birefringence.
There appears to be vertical line artifacts in the averaged images (first row). These line artifacts are less apparent in the MAP images.
Figure 8 shows contour plots of 2D histograms of attenuation coefficient values from the MAP estimation and intensity averaging at corresponding pixels in the ONH images. The red line indicates the pixels of equal attenuation between the MAP and averaging estimation methods. It can be seen that the MAP attenuation images have a wider dynamic range than the attenuation images calculated from intensity averaged images.
Fig. 8.
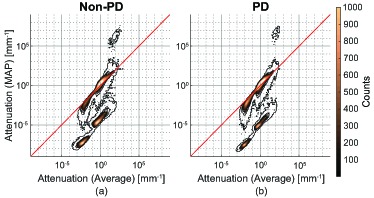
Contour plots of 2D histgrams of attenuations of corresponding pixels in MAP and averaged images of the ONH. Sub-figure (a) is from comparing attenuations of corresponding pixels in Fig. 7(f) and Fig. 7(b). Sub-figure (b) is from comparing attenuations of corresponding pixels in Fig. 7(h) and Fig. 7(d). The red line represents the location of equal attenuation.
In both Non-PD [Fig. 8(a)] and PD [Fig. 8(b)] image composition methods, there is a high number of pixels in agreement, as shown by the large counts on the equi-attenuation line. However, there is also a large cluster of pixels that the MAP estimation method estimates lower attenuations, indicated by the region below the equi-attenuation line. For a large number of pixels in the vitreous and deep region, the MAP estimator estimated values less than 100 times lower than the intensity averaged method.
In Fig. 8(a), there is a small cluster of 274 pixels that have a MAP estimated attenuation coefficient values greater than 104 mm−1 and intensity averaged attenuation coefficient values greater than 1 mm−1. These pixels come from the deepest location in the attenuation images [Figs. 7(b) and 7(f)]. The estimated attenuation coefficients at this location are larger than those of above region. This overestimation is pointed out by Vermeer et al. [34] as violation of the assumption of the attenuation reconstruction theory. Because MAP estimation estimates lower intensity compared to averaging as presented in Section 5.1, this probably makes the overestimation of attenuation more prominent. As shown in Figs. 10(b) and 10(f), MAP estimation precisions and reliability are low at the deepest location. Hence, the MAP estimation precision and reliability may be able to treat this estimation error. There is a similar number of artifactual pixels (160 pixels) as shown in Fig. 8(b), which also come from the deepest location in the PD attenuation images, [Figs. 7(d) and 7(h)].
Fig. 10.
Attenuation estimation precision (first row) and reliability (squared-attenuation-coefficient-to-error ratio). The first and second columns are for MAP non-PD-OCT, while the third and fourth columns are for MAP PD-OCT. The first and third columns are of the macula, and the second and fourth columns are of the ONH.
The histograms, Fig. 9, do not show a significant difference between the non-PD (left four) and PD-OCT images (right four). However, it is evident that the averaged images (first row) have a reduced dynamic range and poor discrimination between attenuation coefficient levels, compared with the MAP images (second row). The MAP image histograms show a broader dynamic range of attenuation coefficients, and more numerous and better defined peaks.
Fig. 9.
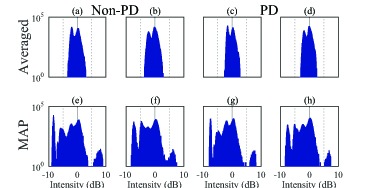
Histograms of attenuation images of the macula and ONH, corresponding to Fig. 7. The same labels are assigned to the corresponding sub-figures in Fig. 7. The four histograms on the left-hand side, (a), (b), (e), and (f), are from the non-PD OCT images, and those on the right-hand side, (c), (d), (g), and (h), are from the PD-OCT images. The histograms in the first row are from the intensity averaged images and those in the second row are from the MAP images. It is clear that the attenuation images based on MAP in the first row have broader dynamic ranges and better attenuation coefficient differentiation than the attenuation images based on averaging (second row).
The precision of the images [Figs. 10(a)–10(d)] suggests that the non-PD images [Figs. 10(a) and 10(b)] have a slightly higher precision than the PD images [Figs. 10(c) and 10(d)], especially in the low intensity regions, such as the vitreous. The precision decreases with depth due to the reduced number of pixels used for estimation, and the increasing error contribution from the second term in Eq. (18). The reliability (squared-attenuation-coefficient-to-error ratio) [Figs. 10(e)–10(h)] maps show that the reliability is higher where the signal strength and signal SNR are higher. By using these reliability maps, we can conclude that the attenuation coefficients in the deep regions are not reliable.
6. Conclusion
PD-detection and image composition removed polarization artifacts that were apparent in OCT images of the peripapillary sclera. On the other hand, non-PD-OCT images show a slightly higher SIR than PD-OCT images, but also contained polarization artifacts. The images composed by MAP estimation always show better image contrast than the corresponding intensity averaged images. The combination of MAP composition and PD-detection is successful because it can compensate for the reduction in SNR caused by the division of probe power during PD detection, while still suppressing polarization artifacts. In light of these results, we conclude that the combination of MAP and PD-OCT is the best choice for birefringent samples, such as the ONH. In contrast, the combination of MAP and non-PD-OCT is a good option for less birefringent regions, such as the macula.
One of the important purposes of this study is to obtain accurate attenuation coefficient values, which is a quantitative measure of the optical property of tissue. As the attenuation coefficient is based on the backscattered light intensity, quantitative light intensity information is required. Two problems then arise that hinder the acquisition of quantitative light intensity: noise-offset in low OCT intensity regions and polarization artifacts.
In this paper we described an image composition method that combines polarization diversity detection and MAP estimation, to remove noise-offset and polarization artifacts. By applying model-based attenuation coefficient reconstruction to quantitative light intensity [34], one may obtain fully quantitative attenuation.
The resulting quantitative intensity images, with noise-offset and polarization artifact correction, provide superior contrast for subjective observation compared with conventional OCT. Moreover, the quantitative attenuation images computed from the quantitative light intensity provide a more accurate estimation of the tissue optical properties. This is especially important for quantitative or automated diagnosis.
Disclosures
ACC, YJH, SM, YY: Topcon (F), Tomey Corp (F), Nidek (F), Canon (F); MM: Allergan (F), Alcon (F), Santen (F), Bayer (F), Novartis (F)
Appendix
A. Proof of the equivalence of MAP intensity and MAP amplitude estimation
Here, we show that the MAP estimate of the intensity is equal to the square of the MAP estimate of the amplitude.
From Bayes’ theorem, the posterior distribution, a kind of probability density function, of the true amplitude, α, is proportional to the likelihood of α times the prior distribution,
| (21) |
where a is a set of measured values of the random variable A, in this case, the observed amplitude. If the prior distribution is assumed to be uniform, then the MAP estimate is equivalent to the maximum likelihood estimate (MLE):
| (22) |
According to the literature [39–41], the MLE of a function of a parameter is equal to the function of the MLE of the parameter. This property is known as the functional invariance of the MLE. Hence, MLE(υ) = MLE2(α) where υ = α2. If we assume that the both of prior distributions of the amplitude and intensity, π(α) and π(υ), are uniformly distributed, MAP(υ) = MAP2(α).
The other issue is a conversion of data. In this paper, measured amplitudes a were used for estimation, but it could be transformed into intensity before estimation. In general, it results in different estimate, because the data transformation changes the shape of probability density function (PDF) [Eq. (1)]. However, if the conversion is based on a bijective function, the likelihood function [Eq. (2)] and also the combined likelihood function [Eq. (3)] do not change their shape.
Let X be a random variable and its conditional probability density function parametrized by θ is pX (x|θ). Also, let Y be the variable converted from X through a function g(); y = g(x). If g() is a bijective function, the PDF of Y is then given by [35]
| (23) |
Here, |∂x/∂y| does not depend on the parameter θ of the distribution. Hence, MLE of θ using l(θ; x) = pX (x|θ) and l(θ; y) = pY (y|θ) are the same
| (24) |
The difference of likelihood functions is only scaling by the Jacobian . Because the conversion from the amplitude to intensity i = a2(a ≥ 0) is a bijective function, MAP estimates based on measured amplitudes or intensities are the same. Hence Eq. (6) holds.
Funding
This research was supported in part by The Japan Society for the Promotion of Science (JSPS, KAKENHI 15K13371), The Japanese Ministry of Education, Culture, Sports, Science and Technology (MEXT) through Regional Innovation Ecosystem Development Program, and Korea Evaluation Institute of Industrial Technology.
References and links
- 1.Huang D., Swanson E. A., Lin C. P., Schuman J. S., Stinson W. G., Chang W., Hee M. R., Flotte T., Gregory K., Puliafito C. A., Fujimoto J. G., “Optical coherence tomography,” Science 254(5035), 1178–1181 (1991). 10.1126/science.1957169 [DOI] [PMC free article] [PubMed] [Google Scholar]
- 2.Drexler W., Fujimoto J. G., “State-of-the-art retinal optical coherence tomography,” Prog. Retin. Eye Res. 27(1), 45–88 (2008). 10.1016/j.preteyeres.2007.07.005 [DOI] [PubMed] [Google Scholar]
- 3.Kim J., Brown W., Maher J. R., Levinson H., Wax A., “Functional optical coherence tomography: principles and progress,” Phys. Med. Biol. 60(10), 211–237 (2015). 10.1088/0031-9155/60/10/R211 [DOI] [PMC free article] [PubMed] [Google Scholar]
- 4.Chen Z., Milner T. E., Srinivas S., Wang X., Malekafzali A., van Gemert M. J. C., Nelson J. S., “Noninvasive imaging of in vivo blood flow velocity usingoptical doppler tomography,” Opt. Lett. 22(14), 1119–1121 (1997). 10.1364/OL.22.001119 [DOI] [PubMed] [Google Scholar]
- 5.Leitgeb R. A., Schmetterer L., Drexler W., Fercher A. F., Zawadzki R. J., Bajraszewski T., “Real-time assessment of retinal blood flow with ultrafast acquisition by color Doppler Fourier domain optical coherence tomography,” Opt. Express 11(23), 3116–3121 (2003). 10.1364/OE.11.003116 [DOI] [PubMed] [Google Scholar]
- 6.White B. R., Pierce M. C., Nassif N., Cense B., Park B. H., Tearney G. J., Bouma B. E., Chen T. C., de Boer J. F., “In vivo dynamic human retinal blood flow imaging using ultra-high-speed spectral domain optical coherence tomography,” Opt. Express 11(25), 3490–3497 (2003). 10.1364/OE.11.003490 [DOI] [PubMed] [Google Scholar]
- 7.Vakoc B. J., Lanning R. M., Tyrrell J. A., Padera T. P., Bartlett L. A., Stylianopoulos T., Munn L. L., Tearney G. J., Fukumura D., Jain R. K., Bouma B. E., “Three-dimensional microscopy of the tumor microenvironment in vivo using optical frequency domain imaging,” Nat. Med. 15(10), 1219–1223 (2009). 10.1038/nm.1971 [DOI] [PMC free article] [PubMed] [Google Scholar]
- 8.Makita S., Hong Y., Yamanari M., Yatagai T., Yasuno Y., “Optical coherence angiography,” Opt. Express 14(17), 7821–7840 (2006). 10.1364/OE.14.007821 [DOI] [PubMed] [Google Scholar]
- 9.An L., Wang R. K., “In vivo volumetric imaging of vascular perfusion within human retina and choroids with optical micro-angiography,” Opt. Express 16(15), 11438–11452 (2008). 10.1364/OE.16.011438 [DOI] [PubMed] [Google Scholar]
- 10.Jia Y., Tan O., Tokayer J., Potsaid B., Wang Y., Liu J. J., Kraus M. F., Subhash H., Fujimoto J. G., Hornegger J., Huang D., “Split-spectrum amplitude-decorrelation angiography with optical coherence tomography,” Opt. Express 20(4), 4710–4725 (2012). 10.1364/OE.20.004710 [DOI] [PMC free article] [PubMed] [Google Scholar]
- 11.de Boer J. F., Milner T. E., van Gemert M. J. C., Nelson J. S., “Two-dimensional birefringence imaging in biological tissue by polarization-sensitive optical coherence tomography,” Opt. Lett. 22(12), 934–936 (1997). 10.1364/OL.22.000934 [DOI] [PubMed] [Google Scholar]
- 12.Yasuno Y., Makita S., Sutoh Y., Itoh M., Yatagai T., “Birefringence imaging of human skin by polarization-sensitive spectral interferometric optical coherence tomography,” Opt. Lett. 27(20), 1803–1805 (2002). 10.1364/OL.27.001803 [DOI] [PubMed] [Google Scholar]
- 13.Yamanari M., Makita S., Yasuno Y., “Polarization-sensitive swept-source optical coherence tomography with continuous source polarization modulation,” Opt. Express 16(8), 5892–5906 (2008). 10.1364/OE.16.005892 [DOI] [PubMed] [Google Scholar]
- 14.Götzinger E., Pircher M., Hitzenberger C. K., “High speed spectral domain polarization sensitive optical coherence tomography of the human retina,” Opt. Express. 13(25), 10217–10229 (2005). 10.1364/OPEX.13.010217 [DOI] [PMC free article] [PubMed] [Google Scholar]
- 15.Baumann B., Choi W., Potsaid B., Huang D., Duker J. S., Fujimoto J. G., “Swept source / Fourier domain polarization sensitive optical coherence tomography with a passive polarization delay unit,” Opt. Express 20(9), 10229–10241 (2012). 10.1364/OE.20.010229 [DOI] [PMC free article] [PubMed] [Google Scholar]
- 16.Braaf B., Vermeer K. A., de Groot M., Vienola K. V., de Boer J. F., “Fiber-based polarization-sensitive OCT of the human retina with correction of system polarization distortions,” Biomed. Opt. Express 5(8), 2736–2758 (2014). 10.1364/BOE.5.002736 [DOI] [PMC free article] [PubMed] [Google Scholar]
- 17.Ju M. J., Hong Y.-J., Makita S., Lim Y., Kurokawa K., Duan L., Miura M., Tang S., Yasuno Y., “Advanced multi-contrast Jones matrix optical coherence tomography for Doppler and polarization sensitive imaging,” Opt. Express 21(16), 19412–19436 (2013). 10.1364/OE.21.019412 [DOI] [PubMed] [Google Scholar]
- 18.Sugiyama S., Hong Y.-J., Kasaragod D., Makita S., Uematsu S., Ikuno Y., Miura M., Yasuno Y., “Birefringence imaging of posterior eye by multi-functional Jones matrix optical coherence tomography,” Biomed. Opt. Express 6(12), 4951–4974 (2015). 10.1364/BOE.6.004951 [DOI] [PMC free article] [PubMed] [Google Scholar]
- 19.Leitgeb R., Wojtkowski M., Kowalczyk A., Hitzenberger C. K., Sticker M., Fercher A. F., “Spectral measurement of absorption by spectroscopic frequency-domain optical coherence tomography,” Opt. Lett. 25(11), 820–822 (2000). 10.1364/OL.25.000820 [DOI] [PubMed] [Google Scholar]
- 20.Xu C., Marks D., Do M., Boppart S., “Separation of absorption and scattering profiles in spectroscopic optical coherence tomography using a least-squares algorithm,” Opt. Express 12(20), 4790–4803 (2004). 10.1364/OPEX.12.004790 [DOI] [PubMed] [Google Scholar]
- 21.Oldenburg A. L., Xu C., Boppart S. A., “Spectroscopic Optical Coherence Tomography and Microscopy,” IEEE J. Sel. Top. Quant. Electron. 13(6), 1629–1640 (2007). 10.1109/JSTQE.2007.910292 [DOI] [Google Scholar]
- 22.Tanaka M., Hirano M., Murashima K., Obi H., Yamaguchi R., Hasegawa T., “1.7-μm spectroscopic spectral-domain optical coherence tomography for imaging lipid distribution within blood vessel,” Opt. Express 23(5), 6645–6655 (2015). 10.1364/OE.23.006645 [DOI] [PubMed] [Google Scholar]
- 23.Chan A. C., Kurokawa K., Makita S., Miura M., Yasuno Y., “Maximum a posteriori estimator for high-contrast image composition of optical coherence tomography,” Opt. Lett. 41(2), 321–324 (2016). 10.1364/OL.41.000321 [DOI] [PubMed] [Google Scholar]
- 24.Yasuno Y., Hong Y., Makita S., Yamanari M., Akiba M., Miura M., Yatagai T., “In vivo high-contrast imaging of deep posterior eye by 1-μm swept source optical coherence tomography and scattering optical coherence angiography,” Opt. Express 15(10), 6121–6139 (2007). 10.1364/OE.15.006121 [DOI] [PubMed] [Google Scholar]
- 25.Spaide R. F., Koizumi H., Pozonni M. C., “Enhanced depth imaging spectral-domain optical coherence tomography,” Am. J. Ophthalmol. 146(4), 496–500 (2008). 10.1016/j.ajo.2008.05.032 [DOI] [PubMed] [Google Scholar]
- 26.Kim Y.-T., “Contrast enhancement using brightness preserving bi-histogram equalization,” IEEE Trans. Consum. Electron. 43(1), 1–8 (1997). 10.1109/30.580378 [DOI] [Google Scholar]
- 27.Pierce M., Shishkov M., Park B., Nassif N., Bouma B., Tearney G., de Boer J., “Effects of sample arm motion in endoscopic polarization-sensitive optical coherence tomography,” Opt. Express 13(15), 5739–5749 (2005). 10.1364/OPEX.13.005739 [DOI] [PubMed] [Google Scholar]
- 28.Yasuno Y., Yamanari M., Kawana K., Miura M., Fukuda S., Makita S., Sakai S., Oshika T., “Visibility of trabecular meshwork by standard and polarization-sensitive optical coherence tomography,” J. Biomed. Opt. 15(6), 061705 (2010). 10.1117/1.3499421 [DOI] [PubMed] [Google Scholar]
- 29.Yun S. H., Tearney G. J., Vakoc B. J., Shishkov M., Oh W. Y., Desjardins A. E., Suter M. J., Chan R. C., Evans J. A., Jang I.-K., Nishioka N. S., de Boer J. F., Bouma B. E., “Comprehensive volumetric optical microscopy in vivo,” Nat. Med. 12(12), 1429–1433 (2006). 10.1038/nm1450 [DOI] [PMC free article] [PubMed] [Google Scholar]
- 30.Grafe M. G. O., Wilk L. S., Braaf B., de Jong J. H., Novosel J., Vermeer K. A., de Boer J. F., “Quantification of retinal blood flow in swept-source Doppler OCT,” Invest. Ophthalmol. Vis. Sci. 56, 5948 (2015). [Google Scholar]
- 31.Kasaragod D., Makita S., Fukuda S., Beheregaray S., Oshika T., Yasuno Y., “Bayesian maximum likelihood estimator of phase retardation for quantitative polarization-sensitive optical coherence tomography,” Opt. Express 22(13), 16472–16492 (2014). 10.1364/OE.22.016472 [DOI] [PubMed] [Google Scholar]
- 32.Sugiyama D. S., Ikuno Y., Alonso-Caneiro D., Yamanari M., Fukuda S., Oshika T., Hong Y.-J., Li E., Makita S., Miura M., Yasuno Y., “Accurate and quantitative polarization-sensitive OCT by unbiased birefringence estimator with noise-stochastic correction,” Proc. SPIE 9697, 96971I (2016). 10.1117/12.2214527 [DOI] [Google Scholar]
- 33.Kasaragod D., Makita S., Hong Y.-J., Yasuno Y., “Noise stochastic corrected maximum a posteriori estimator for birefringence imaging using polarization-sensitive optical coherence tomography,” Biomed. Opt. Express 8(2), 653–669 (2017). 10.1364/BOE.8.000653 [DOI] [PMC free article] [PubMed] [Google Scholar]
- 34.Vermeer K. A., Mo J., Weda J. J. A., Lemij H. G., de Boer J. F., “Depth-resolved model-based reconstruction of attenuation coefficients in optical coherence tomography,” Biomed. Opt. Express 5(1), 322–337 (2014). 10.1364/BOE.5.000322 [DOI] [PMC free article] [PubMed] [Google Scholar]
- 35.Goodman J. W., Statistical Optics (John Wiley & Sons, Inc, 1985). [Google Scholar]
- 36.Hoel P. G., Introduction to Mathematical Statistics (John Wiley & Sons, Inc, 1984), 5th ed. [Google Scholar]
- 37.Ellis J. D., Field Guide to Displacement Measuring Interferometry (SPIE Field Guides, 2014). 10.1117/3.1002328 [DOI] [Google Scholar]
- 38.Lehmann E. L., Casella G., Theory of Point Estimation (Springer-Verlag, 1998), 2nd ed. [Google Scholar]
- 39.Zehna P. W., “Invariance of Maximum Likelihood Estimators,” Ann. Math. Statist. 37(3), 744 (1966). 10.1214/aoms/1177699475 [DOI] [Google Scholar]
- 40.Tan P., Drossos C., “Invariance properties of maximum likelihood estimators,” Mathematics Magazine 48(1), 37 (1975). 10.2307/2689292 [DOI] [Google Scholar]
- 41.Dudewicz E. J., Mishra S. N., Modern Mathematical Statistics (John Wiley & Sons, Inc, 1988). [Google Scholar]


