Abstract
Zebrafish play an important role in biology, pharmacology, toxicology, and medicine. The cardio-cerebrovascular development of zebrafish is particularly critical to understand both brain disorders and cardiovascular diseases in human. In this paper, we applied optical resolution photoacoustic microscopy (ORPAM) to image the whole-body vasculature of the embryonic zebrafish with a special focus on the development of the cardio-cerebrovascular system. Using the intrinsic optical absorption contrast of the embryo, we successfully visualized the formation of the cardio-cerebrovascular network in high-resolution using a 10 × objective, and monitored the whole-body vascular development using a 4 × objective. In addition, we evaluated the impact of the eggshell and pigment inhibitor on the image quality. Our results suggest that ORPAM is capable of studying the cardio-cerebrovascular development of zebrafish in the embryonic stage, and thus has the potential to investigate the cardiovascular and cerebrovascular diseases of human in the future.
OCIS codes: (110.5120) Photoacoustic imaging, (170.6900) Three-dimensional microscopy
1. Introduction
The vascular system, which constitutes a highly ramified network of tubes, has been extensively studied in a variety of vertebrates [1, 2]. It connects all the organs and transports nutrients, oxygen, hormones and metabolites to and from cells in the body. Vascular abnormality can lead to severe cardiovascular and cerebrovascular diseases such as hypertension, atherosclerosis, myocardial infarction, cerebral infarction, cerebral hemorrhage, and cerebral thrombosis [3, 4]. Understanding the formation of the vascular system is particularly important to study the cause and propose the treatment of the associated human diseases. Zebrafish, which has high similarity to the human genome and optical transparency in the embryonic stage, is considered as an ideal model for studying genetic inheritance, nervous system, cancers, and circulation diseases in humans [5–7]. In the embryonic stage, the feature of optical transparency allows pure optical imaging modalities, such as epifluorescence microscopy, fluorescence confocal microscopy (FCM), multi-photon microscopy (MPM), selective plane illumination microscopy (SPIM), and optical coherence tomography (OCT), to image organs/organ systems at a high spatial resolution [5, 8–11]. However, to acquire sufficient optical contrast in the embryonic zebrafish, most absorption-based microscopies require fluorescence labelling or administration of external contrast agents. Besides the complicated operation of labelling, exogenous probes may cause unpredicted influence on the physiological progress of zebrafish. In addition, with the development of zebrafish, it is challenging for pure optical imaging methods to visualize the internal organs and structures with satisfying spatial resolution and imaging depth due to the intrinsic optical scattering property of the tissue [12, 13]. Apart from absorption-based optical microscopic modalities, OCT has been used for imaging zebrafish using the intrinsic scattering contrast with a better penetration depth (~3 mm). Conventional OCT is sensitive to the optical scattering variance and able to image fine internal structures. By using the Doppler Effect, OCT is capable of imaging blood vessels with the contrast from the inside moving particles [11, 14, 15]. However, in the embryonic stage of zebrafish, OCT has difficulty in visualizing the weak vascular circulation with sufficient contrast. Besides optical imaging methods, magnetic resonance microimaging (μMRI), micro computed tomography (Micro-CT), and ultrasound biomicroscopy, have been applied in zebrafish studies [16–18]. However, μMRI suffers from the expensive cost and difficulty in deriving functional parameters. X-ray has inevitable ionizing radiation and limited sensitivity to soft tissues. The low contrast and speckle artifact of ultrasound imaging prevent its extensive applications in the study of zebrafish. In addition, for the embryonic study, all three modalities don’t have sufficient resolution and contrast.
Photoacoustic imaging (PAI), an emerging hybrid biomedical imaging modality, combines rich optical contrast and high ultrasonic resolution [19–22]. Over the last decade, it has been extensively used to study genetics, vasculature, brain disorders, arthritis, cancers, and nanomaterials [19, 23–25]. Several groups have employed different PAI systems to study zebrafish. Xi and Ntziachristos mapped the internal organs of the adult zebrafish using multispectral photoacoustic computed tomography (PACT) [26, 27]. Drexler et. al. successfully tracked genetically expressed fluorescence proteins in the exocrine pancreas of the adult zebrafish via dual-wavelength PAI [28]. Applegate and Zhou fabricated new acoustic transducers which were utilized to detect the photoacoustic signals of the zebrafish heart with a high temporal resolution [29, 30]. Li, for the first time, applied the transmission-mode ORPAM to visualize the microvascular network of the zebrafish larvae at a lateral resolution of 6 μm [7]. In this paper, we implemented a typical transmission-mode ORPAM system with an axial resolution of 18 μm by using a 50 MHz transducer and multiscale lateral resolutions of 3.5 μm and 1.5 μm through using two different objectives. We used the high-resolution mode to image the development of the cerebra-cardio vasculature with a small field of view (FOV) (0.8 mm × 0.8 mm), and the low-resolution mode to cover the whole zebrafish with a large FOV (0.8 mm × 2.4 mm).
2. Materials and methods
2.1 Imaging system and data processing
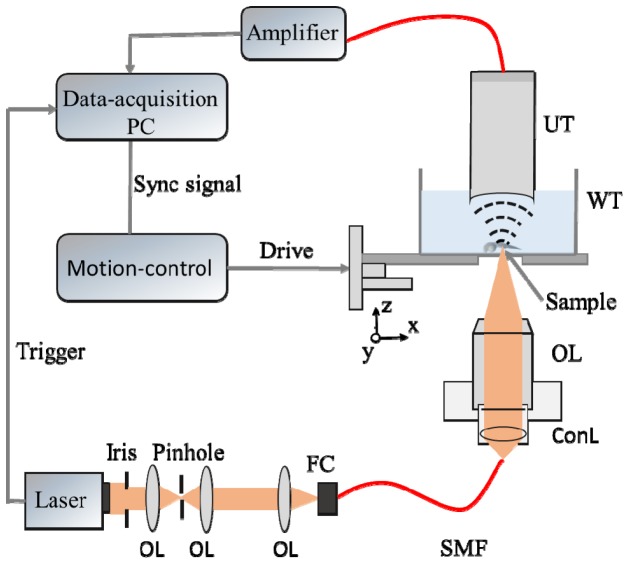
Figure 1 shows the schematic of the transmission-mode ORPAM. Laser pulses (532 nm) with a duration of 5 ns were emitted from a Q-Switched pulsed laser (FQS-200-1-Y-532, Elforlight Ltd.) at a maximum repetition rate of 20 kHz. The laser beam was reshaped by an iris (GCM-5702M, Daheng Optics), filtered by an optical spatial filter (GCO-0112M, Daheng Optics), and collimated using an objective. The collimated laser beam was then coupled into a single-mode fiber via a space-to-fiber coupler (APFC-5T-FC, Beijing Zolix Intruments Co.). The output laser beam from the optical fiber was collimated via a fiber collimator (F220FC-532, Thorlabs Inc.) and focused by the objective. The energy of single pulse after the objective was measured to be 50 nJ. To image the entire fish body, we used a 4 × objective (RMS4, Thorlabs Inc.) with a 0.1 NA value in air. In the experiments of cardio-cerebrovascular imaging, we chose a 10 × objective (GCO-2112, Daheng Optics) with a 0.25 NA value in air. A spherically focused high-frequency transducer (V3322, Olympus) with a focal length of 12.7 mm, a center frequency of 50 MHz, a bandwidth of 70% and an active aperture of 3 mm was mounted on a three-dimensional (3D) manipulator. The transducer was fine adjusted to achieve confocal alignment with the optical focus. In this operation, we focused the laser beam to the surface of a black tape, adjusted the transducer in three-dimension to find the largest photoacoustic (PA) signal and moved the objective in axial direction to achieve confocal alignment in which the amplitude of the PA signal reached the peak value. The petri dish with a membrane-sealed hole at the bottom was mounted on a 3D linear stage (PSA-200, Beijing Zolix Intruments Co.) to find the best imaging plane in axial direction and do the raster scanning in X-Y plane. The PA signals detected by the ultrasonic transducer were amplified by a pre-amplifier (5073-PR, Olympus Inc.) at ~39 dB, and then recorded using a data acquisition (DAQ) card (NI PXI-5124, National Instruments) at a sampling rate of 200 MS/s. The trigger-out signal of the laser served as the synchronized source for the DAQ card, and the start signal of the DAQ card was used to trigger the movement of the linear stage. To obtain a better signal-to-noise ratio (SNR), we recorded the PA signals with 20 times averaging. It took 14 minutes and 25 minutes to finish the scanning of the cerebrovascular system and the entire fish body, respectively. We filtered the raw PA signals using a low-pass filter with a cutoff frequency of 100 MHz, did a Hilbert transform of each A-line, formed a B-scan by back projecting the A-lines sequentially, and stacked multiple B-scans to form a 3D image. We showed all the 3D data using maximum amplitude projection (MAP) and produced the 3D rendering using Amira 5.4.3 with a colormap of hot.
Fig. 1.
Schematic of the experimental setup OL: objective FC: fiber coupler SMF: single-mode-fiber ConL: convex lens WT: water tank UT: ultrasonic transducer.
2.2 Animal preparations
The AB-line zebrafish embryos were raised in the culture media at 28°C. In ~24 hours after fertilization (hpf), PTU (0.003% 1-pheny1-2-thiourea in 10% Hank’s saline) was added to inhibit the pigmentation. We carried out the experiments from 24 hpf to 72 hpf to monitor the cardio-cerebrovascular and whole-body vascular development. Before each experiment, we carefully peeled off the eggshell of the fish, placed the fish on the membrane at the bottom of the petri dish, covered them with a mixture of ultrasound gel and tricaine solution to minimize the movement of the fish during the experiments, oriented the fish to a proper position under an optical microscope, and protected them with another layer of plastic membrane which was finally sealed using agarose solution. The agarose solution is a mixture of agar powder and deionized water, and will solidify when the temperature is below 45° C.
2.3 Resolution test
A sharp edge of a surgical blade was imaged to estimate the spatial resolution of the system using the two different objectives. We carried out the experiments with a scanning step of 250 nm and derived the point spread function (PSF) from the edge spread function (ESF). The full-width-at-half-maximum (FWHM) of the PSF was calculated as the experimental lateral resolution. We derived the envelope of the raw PA signal at the edge of the blade using Hilbert transform, fitted the envelope using a selected Gaussian function, and calculated the FWHM of the fitted curve as the axial resolution of the system.
3. Results and discussion
As shown in Fig. 2, the FWHMs of the PSFs using 4 × and 10 × objectives are estimated to be 3.5 μm (Fig. 2(a)) and 1.5 μm (Fig. 2(b)), respectively. In theory, the best lateral resolutions for the 4 × and 10 × objectives are 3.25 μm and 1.29 μm, which are slightly better than the experimental ones. The membrane sealing the hole at the bottom of the petri dish may cause the deformation of the optical focus, and thus slightly deteriorate the lateral resolution. The axial resolution (Fig. 2(c)) was measured as to 18 μm.
Fig. 2.
Estimation of the spatial resolution. (a) Edge spread function and the derived point spread function of the 4 × objective. (b) Edge spread function and the derived point spread function of the 10 × objective. (c) Experimental and Gaussian fitted curve of a typical PA signal at the edge of the blade. EXP: experiment ESP: edge spread function PSF: point spread function.
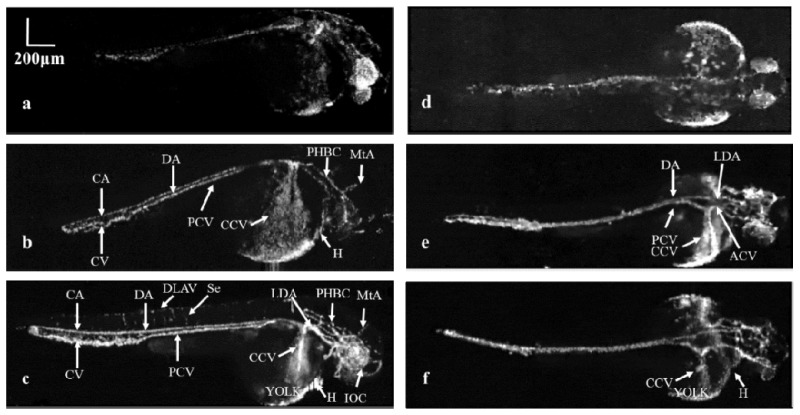
Figure 3 shows the MAP images of the vascular system in the zebrafish embryo at different time points using the 4 × objective. We imaged two different zebrafish positioned in different orientations at 36, 48 and 72 hpf, respectively. The left column presents the sagittal view of one fish and the right column shows the coronal view of another one. At 36 hpf in which the circulation was in the initial stage, we observed several major blood vessels cross the entire fish body as shown in Figs. 3(a) and 3(d). Due to the weak circulation and immature vascular system at this stage, it is challenging to image small blood vessels. At 48 hpf, the imaging results in Figs. 3(b) and 3(e) show the further development of the vascular system and the reinforcement of circulation. In Fig. 3(b), the caudal vein (CV) and caudal artery (CA) become clearly visible, and the dorsal aorta (DA) and posterior (caudal) cardinal vein (PCV) have fully developed in morphology. In addition, a second cranial circulatory loop forms with the appearance of metencephalic artery (MtA) and primordial hindbrain channel (PHBC) in the brain. In the coronal view, as shown in Fig. 3(e), the left and right lateral dorsal aorta (LDA) merge into the single midline dorsal aorta (DA), and the anterior (rostral) cardinal vein (ACV) and posterior (caudal) cardinal vein (PCV) merge into the common cardinal vein (CCV) on both sides of the yolk ball. After another 24 hours, as shown in Figs. 3(c) and 3(f), reticular anastomotic vessels are clearly visible in the tail. We could see the intersegmental vessels (Se) between dorsal longitudinal anastomotic vessel (DLAV) and dorsal aorta (DA) in the sagittal view. The common cardinal vein (CCV) becomes narrow and covers the yolk ball in the coronal view. Visualization 1 (1.2MB, AVI) (online) shows the 3D rendering of the zebrafish depicted in Fig. 3(c).
Fig. 3.
Vascular development of the zebrafish embryo from 36 to 72 hpf with sagittal (a-c) and coronal views (d-f) in two different zebrafish. (a, d): The initial circulation of the embryonic zebrafish at 36 hpf. (b, e): Vasculature of the zebrafish at 48 hpf. (c, f): Advanced vascular system of zebrafish at 72 hpf. CA: Caudal artery CV: Caudal vein DA: Dorsal aorta DLAV: Dorsal longitudinal anastomotic vessel Se: Intersegmental vessel ACV: Anterior (rostral) cardinal vein PCV: Posterior (caudal) cardinal vein LDA: Lateral dorsal aorta CCV: Common cardinal vein H: Heart PHBC: Primordial hindbrain channel MtA: Metencephalic artery IOC: Inner optic circle.
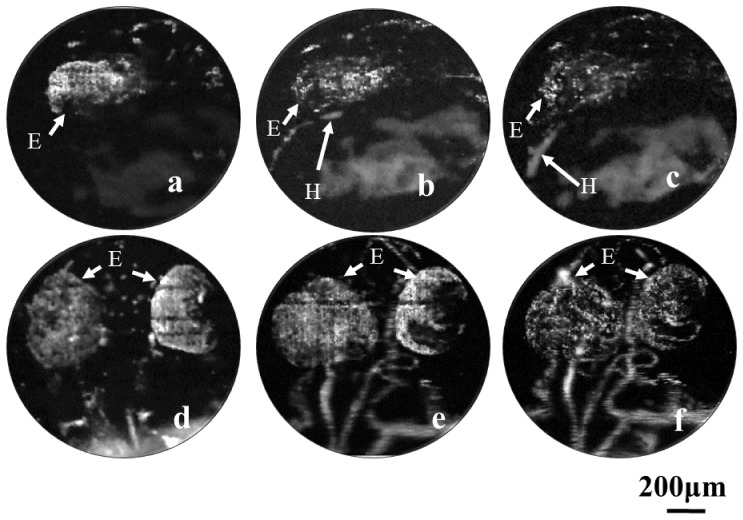
To visualize the early cardio-cerebrovascular development of the same zebrafish embryo in high-resolution, we replaced the 4 × objective with the 10 × objective and carried out the longitudinal experiments of the same fish from 20 hpf. In the first step, we tried to find the time of heart formation, and then monitor the growth of the heart. Figures 4(a)-4(c) show the PA imaging results of the cardiovascular region at 22, 25 and 28 hpf, respectively. Figure 4(a) indicates that the signal of the eye is obviously stronger than other organs at the beginning of heart formation due to its earlier development. At 25 hpf and 28 hpf, we successfully observed the appearance (Fig. 4(b)) and growth (Fig. 4(c)) of the heart. Figures 4(d)-4(f) show longitudinal vascular development of the brain vasculature in the sagittal view. As the embryo grew, the cerebrovascular network became dense and small blood vessels arose, especially inside the eye. Interestingly, we note that the inside structure of the eye changed with the increasing of other cerebral vessels. At the early stage, the major optical absorber inside the eye was retinal pigment epithelium which was not fully inhibited by the pigment inhibitor. With the development of the vasculature, blood became the dominant optical absorber. However, it is challenging to visualize the vascular structure in the eye due to the limited spatial resolution of the ORPAM system.
Fig. 4.
Vascular development in the heart and brain regions of the zebrafish embryo. (a-c): Longitudinal imaging of the heart in the embryonic zebrafish at 22, 25 and 28 hpf, respectively. (d-f): The sagittal view of the microvascular development in the brain at 36, 48 and 72 hpf, respectively. H: Heart E: Eye.
In addition to imaging the vasculature of the embryonic zebrafish, we also evaluated the influence of the eggshell and the pigment inhibitor on the imaging quality with the 4 × objective. As shown in Fig. 5, we did two experiments using the same zebrafish with and without the outer eggshell at about 72 hpf. We observed many bright spots generated from the black particles in the inner medium of the embryo (Fig. 5(a)), which makes it difficult to find the optimal imaging plane during the experiment. In addition, the eggshell is not transparent, and thus deteriorates the spatial resolution and blurs the image. Most importantly, it is difficult to immobilize and orient the embryo within the eggshell. Figure 5(b) shows the MAP image of the embryo without the eggshell, in which the image quality is much better. Figure 5(c) and 5(d) are two photographs of the same zebrafish with and without the eggshell under a conventional optical microscope, in which we could not identify sufficient inside structures in the embryo due to the limited optical contrast and lack of depth information.
Fig. 5.
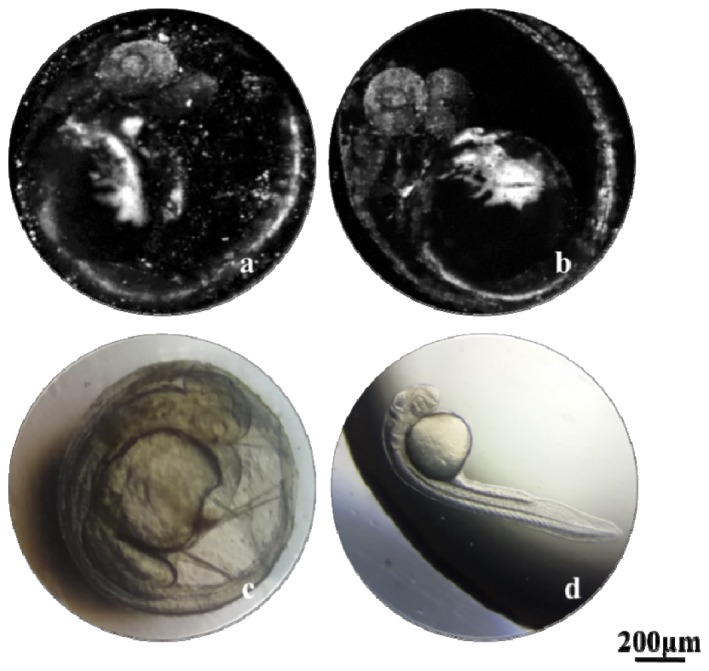
Comparison of the image quality with and without the eggshell. (a) MAP image of the embryo with the eggshell. (b) MAP image of the embryo without the eggshell. (c, d) Conventional optical microscopy of the embryos with and without the eggshell.
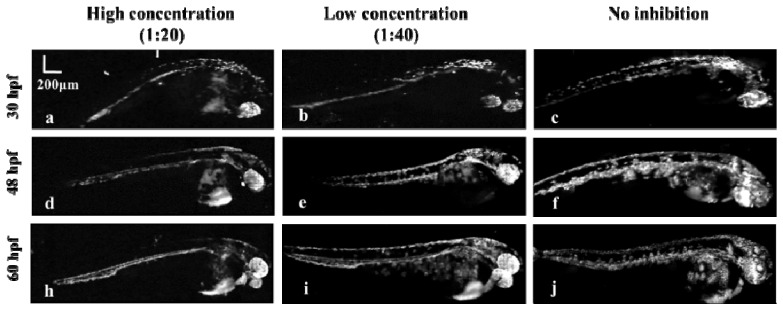
To study the influence of pigment inhibition on the image quality and the development of the zebrafish, we used the 4 × objective to imaged three groups of zebrafish under the same environmental condition with different concentrations of pigment inhibitor. The concentration ratios of the pigment inhibitor versus water for these three groups were 1:20 (a, d, h), 1:40 (b, e, i) and no inhibition (c, f, j), respectively. The results in Fig. 6 indicate that: 1) the development of the embryo will become slower under the deep pigment inhibition; 2) the pigment will start at the hindbrain, then spread to the yolk ball, and continue to grow along the dorsal aorta until reaching the end of the tail; 3) due to the strong absorption of the pigment, it’s hard to clearly image the vasculature of the embryonic zebrafish with the pigment across the whole body.
Fig. 6.
Evaluation of the pigment inhibitor. (a, b, c) MAP images of zebrafish at 30 hpf with high (a), low (b) concentrations of pigment inhibitor and without inhibition (c). (d, e, f) MAP images of the same zebrafish in (a, b, c) at 48 hpf. (e, f, j) MAP images of the same zebrafish in (a, b, c) at 60 hpf.
4. Conclusion
In this study, we have successfully imaged the cardio-cerebrovascular development of the embryonic zebrafish as well as the whole-body vasculature using a transmission-mode ORPAM system. To our knowledge, this is the first detailed study of the vascular development with a special focus on cardio-cerebrovascular system in the embryonic zebrafish via label-free photoacoustic microscopy. Different from the zebrafish at the larvae and adult stages, the embryonic stage makes it difficult to image the microvascular network due to the relatively low optical absorption contrast. In addition, the operations of the embryo including immobilization and orientation are challenging since the fish body is extremely fragile. We believe that this study will be of interest to the biomedical community because the formation and development of the vascular network, especially the cardio-cerebrovascular network, is critical to understand associated diseases such as hypertension, atherosclerosis, myocardial infarction, cerebral infarction, cerebral hemorrhage, and cerebral thrombosis in human. Although it is encouraging, we could do further improvements. Currently, it took about 25 minutes to finish a whole-body scanning of an embryonic fish with a FOV of 0.8 mm × 2.4 mm, and a scanning step of 1.25 μm. It is feasible to improve the imaging speed by using a better pre-amplifier such as the pre-amplifier for hydrophone, which could significantly suppress the white noise and reduce the times of averaging, and thus improve the imaging speed. Additionally, we can employ spectroscopic PA imaging via the use of multi-wavelength strategy to derive functional parameters such as oxygen saturation, and thus differentiate more tissue components such as water, lipid, and pigment. Furthermore, we could integrate ORPAM and OCT to obtain additional structural information.
Funding
National Natural Science Foundation of China (81571722 and 61528401); State International Collaboration Program from Sichuan (2016HH0019; and startup grant (A03012023601011) from University of Electronic Science and Technology of China.
References and links
- 1.Weinberg E. S., Allende M. L., Kelly C. S., Abdelhamid A., Murakami T., Andermann P., Doerre O. G., Grunwald D. J., Riggleman B., “Developmental regulation of zebrafish MyoD in wild-type, no tail and spadetail embryos,” Development 122, 271–280 (1996). [DOI] [PubMed] [Google Scholar]
- 2.Thisse C., Zon L. I., “Organogenesis-heart and blood formation from the zebrafish point of view,” Science Compass 295, 457–462 (2016). [DOI] [PubMed] [Google Scholar]
- 3.Jeong J.-Y., Kwon H.-B., Ahn J.-C., Kang D., Kwon S. H., Park J. A., Kim K. W., “Functional and developmental analysis of the blood-brain barrier in zebrafish,” Brain Res. Bull. 75(5), 619–628 (2008). 10.1016/j.brainresbull.2007.10.043 [DOI] [PubMed] [Google Scholar]
- 4.Vogel A. M., Weinstein B. M., “Studying vascular development in the zebrafish,” Trends Cardiovasc. Med. 10(8), 352–360 (2000). 10.1016/S1050-1738(01)00068-8 [DOI] [PubMed] [Google Scholar]
- 5.Isogai S., Horiguchi M., Weinstein B. M., “The vascular anatomy of the developing zebrafish: an atlas of embryonic and early larval development,” Dev. Biol. 230(2), 278–301 (2001). 10.1006/dbio.2000.9995 [DOI] [PubMed] [Google Scholar]
- 6.Shin J. T., Fishman M. C., “From zebrafish to human: modular medical models,” Annu. Rev. Genomics Hum. Genet. 3(1), 311–340 (2002). 10.1146/annurev.genom.3.031402.131506 [DOI] [PubMed] [Google Scholar]
- 7.Ye S., Yang R., Xiong J., Shung K. K., Zhou Q., Li C., Ren Q., “Label-free imaging of zebrafish larvae in vivo by photoacoustic microscopy,” Biomed. Opt. Express 3(2), 360–365 (2012). 10.1364/BOE.3.000360 [DOI] [PMC free article] [PubMed] [Google Scholar]
- 8.Zanella C., Campana M., Rizzi B., Melani C., Sanguinetti G., Bourgine P., Mikula K., Peyrieras N., Sarti A., “Cells segmentation from 3-D confocal images of early zebrafish embryogenesis,” IEEE Trans. Image Process. 19(3), 770–781 (2010). 10.1109/TIP.2009.2033629 [DOI] [PubMed] [Google Scholar]
- 9.Kimmel C. B., Ballard W. W., Kimmel S. R., Ullmann B., Schilling T. F., “Stages of embryonic development of the zebrafish,” Dev. Dyn. 203(3), 253–310 (1995). 10.1002/aja.1002030302 [DOI] [PubMed] [Google Scholar]
- 10.Lin H., Chekkoury A., Omar M., Schmitt-Manderback T., Koberstein-Schwarz B., Mappes T., Lopez-Schier H., Razansky D., Ntziachristos V., “Selective plane illumination optical and optoacoustic microscopy for postembryonic imaging,” Laser Photonics Rev. 9(5), L29–L34 (2015). 10.1002/lpor.201500120 [DOI] [Google Scholar]
- 11.Kagemann L., Ishikawa H., Zou J., Charukamnoetkanok P., Wollstein G., Townsend K. A., Gabriele M. L., Bahary N., Wei X., Fujimoto J. G., Schuman J. S., “Repeated, noninvasive, high resolution spectral domain optical coherence tomography imaging of zebrafish embryos,” Mol. Vis. 14, 2157–2170 (2008). [PMC free article] [PubMed] [Google Scholar]
- 12.Kamali M., Day L. J., Brooks D. H., Zhou X., O’Malley D. M., “Automated identification of neurons in 3D confocal datasets from zebrafish brainstem,” J. Microsc. 233(1), 114–131 (2009). 10.1111/j.1365-2818.2008.03102.x [DOI] [PMC free article] [PubMed] [Google Scholar]
- 13.Blum Y., Belting H.-G., Ellertsdottir E., Herwig L., Lüders F., Affolter M., “Complex cell rearrangements during intersegmental vessel sprouting and vessel fusion in the zebrafish embryo,” Dev. Biol. 316(2), 312–322 (2008). 10.1016/j.ydbio.2008.01.038 [DOI] [PubMed] [Google Scholar]
- 14.Iftimia N. V., Hammer D. X., Ferguson R. D., Mujat M., Vu D., Ferrante A. A., “Dual-beam Fourier domain optical Doppler tomography of zebrafish,” Opt. Express 16(18), 13624–13636 (2008). 10.1364/OE.16.013624 [DOI] [PubMed] [Google Scholar]
- 15.Divakar Rao K., Upadhyaya P., Sharma M., Gupta P. K., “Noninvasive imaging of ethanol-induced developmental defects in zebrafish embryos using optical coherence tomography,” Birth Defects Res. B Dev. Reprod. Toxicol. 95(1), 7–11 (2011). [DOI] [PubMed] [Google Scholar]
- 16.Kabli S., He S., Spaink H. P., Hurlstone A., Jagalska E. S., De Groot H. J., Alia A., “In vivo magnetic resonance imaging to detect malignant melanoma in adult zebrafish,” Zebrafish 7(2), 143–148 (2010). 10.1089/zeb.2009.0649 [DOI] [PubMed] [Google Scholar]
- 17.Seo E., Lim J. H., Seo S. J., Lee S. J., “Whole-body imaging of a hypercholesterolemic female zebrafish by using synchrotron X-ray micro-CT,” Zebrafish 12(1), 11–20 (2015). 10.1089/zeb.2014.1039 [DOI] [PMC free article] [PubMed] [Google Scholar]
- 18.Goessling W., North T. E., Zon L. I., “Ultrasound biomicroscopy permits in vivo characterization of zebrafish liver tumors,” Nat. Methods 4(7), 551–553 (2007). 10.1038/nmeth1059 [DOI] [PubMed] [Google Scholar]
- 19.Xu M., Wang L. V., “Photoacoustic imaging in biomedicine,” Rev. Sci. Instrum. 77(4), 041101 (2006). 10.1063/1.2195024 [DOI] [Google Scholar]
- 20.Oraevsky A., Karabutov A., “Optoacoustic tomography,” in Biomedical Photonics Handbook, Vo-Dinh T., ed. (CRC, 2003), 34–31. [Google Scholar]
- 21.Li C., Wang L. V., “Photoacoustic tomography and sensing in biomedicine,” Phys. Med. Biol. 54(19), R59–R97 (2009). 10.1088/0031-9155/54/19/R01 [DOI] [PMC free article] [PubMed] [Google Scholar]
- 22.Beard P., “Biomedical photoacoustic imaging,” Interface Focus 1(4), 602–631 (2011). 10.1098/rsfs.2011.0028 [DOI] [PMC free article] [PubMed] [Google Scholar]
- 23.Wang L. V., Hu S., “Photoacoustic tomography: in vivo imaging from organelles to organs,” Science 335(6075), 1458–1462 (2012). 10.1126/science.1216210 [DOI] [PMC free article] [PubMed] [Google Scholar]
- 24.Xi L., Grobmyer S. R., Wu L., Chen R., Zhou G., Gutwein L. G., Sun J., Liao W., Zhou Q., Xie H., Jiang H., “Evaluation of breast tumor margins in vivo with intraoperative photoacoustic imaging,” Opt. Express 20(8), 8726–8731 (2012). 10.1364/OE.20.008726 [DOI] [PubMed] [Google Scholar]
- 25.Kruger R. A., Kuzmiak C. M., Lam R. B., Reinecke D. R., Del Rio S. P., Steed D., “Dedicated 3D photoacoustic breast imaging,” Med. Phys. 40(11), 113301 (2013). 10.1118/1.4824317 [DOI] [PMC free article] [PubMed] [Google Scholar]
- 26.Razansky D., Distel M., Vinegoni C., Ma R., Perrimon N., Koster R. W., Ntziachristos V., “Multispectral opto-acoustic tomography of deep-seated fluorescent proteins in vivo,” Nat. Photonics 3(7), 412–417 (2009). 10.1038/nphoton.2009.98 [DOI] [Google Scholar]
- 27.Huang N., Guo H., Qi W., Zhang Z., Rong J., Yuan Z., Ge W., Jiang H., Xi L., “Whole-body multispectral photoacoustic imaging of adult zebrafish,” Biomed. Opt. Express 7(9), 3543–3550 (2016). 10.1364/BOE.7.003543 [DOI] [PMC free article] [PubMed] [Google Scholar]
- 28.Liu M., Schmitner N., Sandrian M. G., Zabihian B., Hermann B., Salvenmoser W., Meyer D., Drexler W., “In vivo three dimensional dual wavelength photoacoustic tomography imaging of the far red fluorescent protein E2-Crimson expressed in adult zebrafish,” Biomed. Opt. Express 4(10), 1846–1855 (2013). 10.1364/BOE.4.001846 [DOI] [PMC free article] [PubMed] [Google Scholar]
- 29.Mattison S. P., Shelton R. L., Maxson R. T., Applegate B. E., “Continuous real-time photoacoustic demodulation via field programmable gate array for dynamic imaging of zebrafish cardiac cycle,” Biomed. Opt. Express 4(8), 1451–1463 (2013). 10.1364/BOE.4.001451 [DOI] [PMC free article] [PubMed] [Google Scholar]
- 30.Park J., Cummins T. M., Harrison M., Lee J., Zhou Q., Lien C. L., Shung K. K., “High frequency photoacoustic imaging for in vivo visualizing blood flow of zebrafish heart,” Opt. Express 21(12), 14636–14642 (2013). 10.1364/OE.21.014636 [DOI] [PMC free article] [PubMed] [Google Scholar]


