

Abstract
Glycogen synthase (GS) is the rate limiting enzyme in the synthesis of glycogen. Eukaryotic GS is negatively regulated by covalent phosphorylation and allosterically activated by glucose-6-phosphate (G6P). To gain structural insights into the inhibited state of the enzyme, we solved the crystal structure of yGsy2-R589A/R592A to a resolution of 3.3 Å. The double mutant has an activity ratio similar to the phosphorylated enzyme and also retains the ability to be activated by G6P. When compared to the 2.88 Å structure of the wild-type G-6-P activated enzyme, the crystal structure of the low-activity mutant showed that the N-terminal domain of the inhibited state is tightly held against the dimer-related interface thereby hindering acceptor access to the catalytic cleft. Based on these two structural observations, we developed a reversible redox regulatory feature in yeast GS by substituting cysteine residues for two highly conserved arginine residues. When oxidized, the cysteine mutant enzyme exhibits activity levels similar to the phosphorylated enzyme, but cannot be activated by G-6-P. Upon reduction, the cysteine mutant enzyme regains normal activity levels and regulatory response to G-6-P activation.
Graphical Abstract
Introduction
Glycogen is an osmotically inert branched polymer of glucose synthesized during times of nutritional sufficiency as a metabolic reserve that is rapidly mobilized when demands exceed supplies of glucose1. Glycogen synthase (GS), the rate limiting enzyme of glycogen biosynthesis, catalyzes the linear polymerization of glucose residues through formation of α-1,4 glycosidic bonds by transferring glucose from UDP-glucose to the existing glucose polymer. Eukaryotic GS falls within the GT3 sub-family of the glucosyl-transferase B (GTB) super-family2. The classification is based on sequence identity and the regulatory properties of glycogen synthase which feature inhibition by covalent phosphorylation on Ser/Thr residues, as well as allosteric activation by glucose-6-phosphate (G-6-P). G-6-P activation can completely overcome the inhibitory effects of phosphorylation1.
Mammals have two isoforms of GS encoded by distinct genetic loci, GYS1, expressed in muscle 3 and most other cell types and GYS2, which is expressed only in liver4. Mammalian GS is phosphorylated at 9 discrete sites, located both on N- and C-terminal extensions of a conserved catalytic core5,6. Two phosphorylation sites are in the N-terminus (serines 8 &11) and 7 are inthe C-terminus (serines 641,645,649,653,657,698 and 710)7, 8.
Saccharomyces cerevisiae also has two genes for GS, GYS1 and GYS26. GYS2 is nutritionally regulated and its expression changes during the cell cycle5, 9, suggesting a dominant role in yeast glucose homeostasis. Yeast Glycogen Synthase 2 (yGsy2) shares more than 40 % sequence identity with its mammalian counterparts and retains most of the important amino-acid residues involved in regulation and catalysis10, 11. However, unlike mammalian GS, the yGsy2 enzyme lacks the N-terminal phosphorylation sites and has only three C-terminal phosphorylation sites (serines 651, 655 and threonine 668), but the ability of G-6-P to fully activate the phosphorylated enzyme is conserved5. Prior kinetic studies have shown that phosphorylation at threonine 668 has the major effect on its activity5, 10.
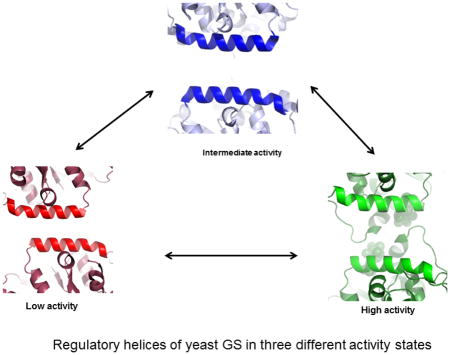
It is now recognized that the ability of eukaryotic GS enzymes to respond to the effects of G-6-P binding and phosphorylation is mediated by a conserved cluster of six Arginine residues located in the final helical segment of the C-terminal Rossmann domain (equivalent to residues 580 to 592 in Gsy2)10, 12. In the yeast enzyme, simultaneously mutating the first three arginines to alanine creates an enzyme that is insensitive to the effects of G-6-P and phosphorylation. In contrast, when the last three arginines were mutated to alanine the resulting enzyme could be inhibited by phosphorylation but was not reactivated by G-6-P12. Detailed mutational and kinetic studies on yeast Gsy2 delineated the role of each of the six arginine residues within the critical cluster of arginine residues. The arginines equivalent to R583 and R587 (middle two arginines of the cluster) were responsible for anchoring the phosphate of G-6-P in the G-6-P binding pocket10. The first two arginines (R580 and R581) were responsible for the ability of the enzyme to respond to inhibitory phosphorylation at T668. In contrast, the last two arginine residues were responsible for both setting the basal activity level of the enzyme and permitting the enzyme to respond to G-6-P activation when T668 is phosphorylated. Mutation of R589 and R592 to alanine produced an enzyme with an activity level similar to the phosphorylated enzyme, but phosphorylation of this form of Gsy2p led to an enzyme that could not be reactivated by G-6-P binding10. Consequently, we propose that the function of the arginine-rich cluster is to fine tune the enzyme’s responses to regulatory inputs and establish the set points for relating the structural transitions to enzyme activity. Based on these observations, a three state conformational model can explain the kinetic behavior of eukaryotic GS: i) Tense state when the enzyme is phosphorylated, with a very low Vmax/KM value, ii) Intermediate/basal state where the enzyme is neither phosphorylated nor bound to G-6-P with an intermediate Vmax/KM value and iii) Relaxed/Activated state in which GS is bound to G-6-P with the highest Vmax/KM value 12.
Crystal structures are available only for two eukaryotic glycogen synthases, Saccharomyces cerevisiae and Caenorhabditis elegans10, 13. The crystal structure of the yeast Gsy2 was solved for both the intermediate state and the G-6-P activated state. In the case of C. elegans, the GS structure was solved in complex with the C-terminal 34 amino acids of human glycogenin, but the overall structure of CeGS was superimposable with the basal state of yeast Gsy210, 13. GS from both species exists as a tetramer with relatively limited inter-subunit contacts. In the activated state structure of the yeast enzyme (pdb code: 3NB0), G-6-P is bound to a pocket lying beneath the arginine-rich C-terminal regulatory helix and makes multiple contacts with the protein surface, including critical interactions across the subunit interface with neighboring subunits.
The binding of G-6-P induces both local and long-range structural changes in GS. Locally, G-6-P binding orders a polypeptide segment between residues 278 and 284 which was disordered in the intermediate state structure. This reordered segment pushes the arginine regulatory helices apart from each other across the subunit interface and coincidently induces large scale translational and rotational movements of the subunits that promote better access for glycogen chains to reach the catalytic site10. These conformational transitions that lead to opening of the tetrameric interfaces are critical in order to permit full closure of the N-terminal domain upon the C-terminal domain and generate the catalytically competent ternary complex between the enzyme and both the donor and acceptor substrates14.
Very little is known of the structure of the inhibited/tensed state of the enzyme. Given the functional properties of the Gsy2-R589A/R592A mutant enzyme, we sought structural insights into the tense state of the enzyme using this mutant as a surrogate for the phosphorylated enzyme. We report here the structure of this enzyme. In addition, we present mutational and enzyme kinetic studies to extend understanding of this state and also engineered a novel regulatory feature into the yeast GS enzyme that permits its activity to be controlled by reversible oxidation/reduction of cysteine residues at the regulatory interface.
Experimental procedures
Mutagenesis, expression and purification of Yeast Glycogen synthase
A PCR based site directed mutagenesis technique was used for creating the following mutants from the pET-28A yeast GSY2 construct12: R589A/R592A, R581A/R592A, R581C/R592C. All of the modified protein expression constructs were confirmed by DNA sequencing. The His-tagged recombinant yeast Gsy2 enzymes were expressed in BL21 (DE3) E. coli and purified by Ni-NTA (Ni2+-nitrilotriacetate) affinity and anion exchange chromatography as described previously10. The purified enzymes were dialyzed against 20 mM TRIS-HCl, pH 8.0 and 1 mM 2-mercaptoethanol (BME) buffer and stored at −80°C until use. The purification of the cysteine mutants omitted the use of reducing agents until kinetic studies were initiated.
Non-reducing SDS PAGE gel for the cysteine mutants
The purified proteins were then separated on an 8% non-reducing SDS-PAGE gel using standard discontinuous buffer systems. We prepared two different samples for each mutant enzyme, one containing 250 mM BME and another that lacked BME in the sample buffers. 5 μg of the purified recombinant proteins were loaded onto a 8% gel which was developed at 170 V for 80 minutes and stained with Coomassie brilliant blue R-250.
Crystallization and structure determination
The crystals of yeast Gsy2 R589A/R592A were obtained using the hanging drop vapor diffusion method. The protein solution was prepared at 2.5 mg/mL and contained 10 mM UDP-Glucose. The protein/substrate solution was combined with an equal volume of a crystallization reservoir solution comprised of 100 mM TRIS-HCl, pH 8.4–8.9, 200 mM MgCl2, and between 5–10% (w/v) PEG 6000. Prior to data collection, the crystals were cryo-protected by quickly transferring the crystals to a fresh reservoir solution to which a final concentration of 15% (v/v) ethylene glycol had been added. Crystals treated in this manner were immediately flash frozen at 100K directly in the gaseous nitrogen stream. X-ray diffraction data were collected at beamline 19-BM operated by the Structural Genomics Consortium located at the Argonne National Laboratory. The diffraction data were indexed, integrated and scaled using the HKL3000 program suite15. The structure of Gsy2-R589A/R592A was solved by molecular replacement using PHASER MR16 as implemented in the CCP4 program suite17, using a monomer of the Gsy2-R580A/R581A/R583A basal state structure (pdb code: 3NAZ) as the search model. The Britton and H-test for twinning were consistent with merohedral twinning with a twin fraction of 0.31. Consequently, all models were refined using amplitude-based twin refinement in REFMAC518 as implemented in the CCP4 suite17. Each refined model was visually inspected and manually adjusted using the molecular display program COOT (version 0.7.2.1)19.
G-6-P bound activated crystals for the wild type Gsy2 enzyme were obtained, cryo-protected and frozen as previously described10. The data sets were collected at the Advanced Photon Source at beamline 23-ID operated by GM/CA-CAT in June of 2010. The diffraction data was then indexed, integrated and scaled using HKL2000 program suite20. The structure was solved using G-6-P bound Gsy2-R589A/R592A mutant structure (pdb code: 3NB0) as a search model for molecular replacement with the help of MOLREP program as implemented in the CCP4 program suite. The final model reported here is after several rounds of refinements using REFMAC5 in the CCP4 program suite17.
Enzyme activity measurements
Activity measurements were performed for all Gsy2 enzymes using the standard 14C filter paper assay, as described21. The assay quantifies the amount of 14C-glucose that is incorporated from UDP-14C-glucose into glycogen over a 15 minute time period at 30°C. The standard reaction condition uses 4.44 mM of UDP-glucose and 6.7 mg/ml of glycogen, as near saturating substrate levels. Rabbit liver glycogen Type III (Sigma) was deionized prior to use by passing the material through the mixed bed ion-exchange resin TMD-8. The activity for each enzyme was measured both in the presence or absence of 10 mM glucose-6-phosphate (G-6-P). The activity ratio is the ratio of the enzyme activity in the absence of G-6-P, divided by the activity in the presence of G-6-P. Protein concentrations were measured by the method of Bradford using bovine serum albumin as a standard.
Concentration-dependent activity measurements using G-6-P and reducing agents
In order to calculate AC50 values for G-6-P, its concentration was varied between 0.01 mM and 10 mM. All measurements were performed in triplicate and the results presented are average of at least three separate experiments. Similar experiments were performed to calculate the AC50 values for the reducing agents BME, dithiothreitol (DTT) and tris(2-carboxyethyl)phosphine (TCEP). For these titrations, the activity was measured under standard reaction conditions in the presence or absence of G-6-P by varying the concentration of the reducing agents as follows: 1 mM – 200 mM for BME; 0.1 mM – 20 mM for DTT; and 0.05 mM – 5 mM for TCEP.
KMvalues for UDP-glucose
The KM values for UDP-glucose were determined by varying the concentration of donor substrate between 0.05 mM and 6 mM with or without G-6-P at a fixed glycogen concentration of 6.7 mg/mL. In order to compare across all enzymes presented in this work, a fixed concentration of 200 mM BME was used in these kinetic assays.
Kinetic data analysis
All kinetic data analysis was performed using the program package SigmaPlot (version 12.3) by fitting the data to the appropriate binding or kinetic equation. The AC50 curves for G-6-P and reducing agents were fit to the four parameter logistic equation. The KM values for UDP-glucose were obtained following a fit to the standard Michaelis-Menten equation v = Vmax*[S]/(Km+[S]) where v is the measured reaction velocity, [S] is the substrate concentration, Vmax is the maximum rate achieved by the system and KM is the substrate concentration at half maximum velocity.
Results
Structure of G-6-P activated yeast Gsy2-wildtype enzyme
Eukaryotic GS is a highly dynamic enzyme and its conformational equilibrium changes depending on its phosphorylation status and the local G-6-P concentration. Through mutational studies, we found that the conformational equilibrium of yGsy2 can be shifted between states by selectively mutating the arginine residues in the regulatory helix10, 12. Taking advantage of this property, we solved the crystal structure of the enzyme in its basal (non-phosphorylated) state (pdb code: 3NAZ) and G-6-P bound activated state (pdb code: 3NB0)10. However, both these structures had two or more Arg → Ala mutations within their regulatory helices. In particular, the non-activated state reported here is the same mutant enzyme for which the activated state was previously determined. However, in order to ensure that the mutations themselves did not impact the structural transitions between states, it became essential to determine the structure for the wild-type activated form of yGsy2 so that a common basis for comparison to a non-mutant enzyme was available.
The crystal structure of the wildtype yGsy2 enzyme in complex with G-6-P was solved to a resolution of 2.88 Å. The overall structure of the yGsy2-wt and G-6-P complex was found to be very similar to the previously reported yGsy2-R589A/R592A double mutant structure (r.m.s.d values for all α-carbon atoms in the individual monomers of the two structures is <0.64 Å), with identical domain positioning. This was not surprising because the activity of the double mutant enzyme in the presence of G-6-P is very similar to the wildtype enzyme. G-6-P binding close to the regulatory helix completely changes the tetrameric interface of yGsy2-wt (figure 1B). As observed with the activated state of the yGsy2-R589A/592A enzyme, the binding of G-6-P induces large translational motions of the subunits which causes helices α15 and α16, as well as the loop connecting β-strand 16 and α-helix 18 to move away from the molecular axes of the dimer and form new interactions with α-helices 15 and 16 of the adjacent monomer (figure 1C). G-6-P binding also opens the N-terminal domain by 4.5° when compared to the basal state structure. These new inter-subunit interactions, combined with the N-terminal domain motion, opens up the catalytic cleft for better acceptor access.
Figure 1. Comparison of different tetrameric interfaces observed in yGsy2.

Ribbon representation of the dimers of yGsy2 in A. The low activity inhibited state represented by the yGsy2-R589A/R592A double mutant, B. The intermediate activity basal state represented by the yGsy2-R580A/R581A/R583A triple mutant, C. G-6-P bound activated state (wild-type yGsy2. G-6-P complex) and D. UDP.G trapped activated state (yGsy2-E169Q.G-6-P.UDPG complex). UDP.G is bound in one of the two monomers and shown in stick model while the other monomer contains only UDP in its active site. G-6-P is displayed using space filling atom representations in panels 1C and 1D.
Overall structure of yeast Gsy2-R589A/R592A
Previous work has shown that the yGsy2-R589A/R592A double mutant has an activity ratio similar to that of the wild-type enzyme phosphorylated at T66810, suggesting that it might mimic the phosphorylated state. In order to understand how the arginine residues in the regulatory helix regulate the structural transitions that control enzyme activity, crystallization trials were conducted for the yGsy2-R589A/R592A double mutant. This mutant enzyme crystallized in the trigonal P3221 space group and produced diffraction data to a maximum resolution of 3.3 Å (Table 1). The crystals were merohedrally twinned, with a twin fraction of 0.31 (Table 1). The asymmetric unit for this crystal form contains a dimer, representing one-half of the functional tetramer. The tetramer is generated by one of the crystallographic diads in the unit cell (Figure 2A). The structure exhibited defined electron density for residues 2–277; 283–401and 415–639 in one monomer of the dimer and for residues 2–277; 283–401 and 415–626 in the other monomer. Both the monomers lacked interpretable electron density for the C-terminal 60–70 residues.
Table 1.
Data collection, processing and refinement parameters
| yGsy2-R589A/R592A | Wt yGsy2 +G-6-P | |
|---|---|---|
|
| ||
| Pdb code | 5SUL | 5SUK |
|
| ||
| Cell Parameters: | a = 124.7Å b =124.7Å c = 278.1 Å | a = 191.98Å b = 204.56Å c = 205.82Å |
| Space group | α = 90.00°β = 90.00°γ = 120.00° P 32 2 1 |
α = 90.00°β = 90.00°γ = 90.00° I222 |
|
| ||
| DATA COLLECTION STATISTICS (values in parenthesis are for the highest resolution shell) | ||
|
| ||
| Resolution Range | 50.0 – 3.3 Å | 50–2.88 Å |
|
| ||
| Unique Reflections | 28283 | 84895 |
| Total Observations | 1197984 | 2573762 |
|
| ||
| Completeness | 99.4% | 97.99% |
|
| ||
| Redundancy | 4.8 (5) | 5.0(4.7) |
|
| ||
| Rpim | 0.069(0.306) | 0.033(0.263) |
|
| ||
| CC1/2 (highest resolution shell) | 0.703 | 0.870 |
| Rmerge | 0.134(0.621) | 0.07(0.556) |
|
| ||
| <I>/sigma<i> | 10.28 (2.13) | 22.01(2.51) |
|
| ||
| Average(<I>/sigma<I>) | 7.59 | 17.95 |
|
| ||
| REFINEMENT | ||
|
| ||
| Resolution Range | 108–3.3Å | 145–2.88 Å |
|
| ||
| Number of atoms | 9846 | 20850 |
|
| ||
| R-factors | Rwork= 17.51%, Rfree =21.91% | Rwork= 21.89%, Rfree =26.0% |
|
| ||
| R.m.s. deviations from Ideal Values | ||
| Bond angles (°) | 0.0072 | 0.0073 |
| Bond lengths (Å) | 1.22 | 1.32 |
|
| ||
| Ramachandran Plot | ||
| Preferred/Allowed (%) | 98.93 | 99.36 |
| Outliers (%) | 1.07 | 0.64 |
Figure 2. Comparison of inhibited and basal state structures of Gsy2.

A. Ribbon representation of yGsy2-R589A/R592A model as found in the asymmetric unit. Each monomer is colored separately. B. Ribbon representation of the superposed yGsy2-R580A/R581A/R583A basal (blue) and yGsy2-R589A/R592A inhibited (red) state monomers. The C-terminal domain (290–600) of each monomer was used for superposition using the center of mass option within the program Superpose in CCP4 suite. C. Ribbon diagram of the superposed basal (blue) and inhibited (red) state tetramers using the same superposition procedure as in panel B. The inhibited state structure has a more closed tetrameric interface. D. The same figure rotated 90° showing the acceptor access to the catalytic cleft is hindered in the inhibited state.
The conformation of the Gsy2-R589A/R592A double mutant is most similar in domain and subunit arrangement to the Gsy2-R580A/R581A/R583A basal state structure10 (Figure 2C). Like other GTB family of enzymes, yeast Gsy2 contains two structural domains; an N-terminal domain comprising residues 2–277 and 599–639, and a C-terminal domain comprising residues 283–598 (Figure 2B). The regulatory helices containing the cluster of six arginine residues lie at the end of the C-terminal domain and are situated anti-parallel to each other across one of the molecular 2-fold axes in the tetramer (Figure 2C).
Structural comparisons with the basal state enzyme
Since the crystal structure of the yGsy2-R589A/R592A double mutant was solved in the absence of G-6-P, the tetrameric interface was found to be arranged similarly to the basal state structure (figure 1A) but appears more tightly packed. In addition to this compact tetrameric interface, we made two important structural observations that distinguishes the low activity state structurefrom the basal state structure.
i) N-terminal domain closure
Prior structural evidence has demonstrated that the donor nucleotide sugar, UDP-glucose, binds to the C-terminal Rossmann-fold domain near the inter-domain cleft, whereas the acceptor end of the glycogen polymer is thought to bind along surface of the N-terminal Rossmann-fold domain on the opposite side of the inter-domain cleft10, 22. Kinetic studies on the Gsy2 enzyme reveal that the KM values for UDP-glucose remain relatively independent of the activation state of the enzyme12. However, the KM values for glycogen vary by 4-fold and the maximum velocity varies by 20-fold between the fully active or inhibited states12. A possible structural explanation for the observed changes in KM for glycogen may come from examining the extent to which the N-terminal domain is rotated toward the C-terminal domain for different states of activation. When the C-terminal domains are used as the basis for super-positioning, we find that the N-terminal domain for the Gsy2-R589A/R592A double mutant structure is displaced relative to that of the Gsy2-R580A/R581A/R583A basal state structure (Figure 2B). When analyzed by the Dyndom program23, the N-terminal Rossmann-fold domain of the Gsy2-R589A/R592A double mutant structure was rotated 5.9° towards a more “closed” domain arrangement compared to the basal state structure (Figure 2B).
Similar N-terminal domain closures were previously observed for E. Coli (eGS) GS22. The eGS belongs to the GT5 sub-family of enzymes and therefore lacks the multimeric oligomerization found in eukaryotic GS. The GT5 family of enzymes also lacks the ability to be activated by G-6-P and inhibited by covalent phosphorylations. The crystal structure of E. Coli GS was solved in both the apo-form (pdb code: 3D1J) and in the donor.acceptor complex form (pdb code: 2R4T) using ADPG as the donor and HEPPSO as an acceptor analogue22. In both cases, eGS was found to exist as a monomer made up of two distinct structural domains: N-terminal Rossmann fold domain and C-terminal Rossmann fold domain. It was found that in the donor.acceptor complex structure, the N-terminal domain was 14.5° more closed when compared to the apo structure22.
Domain-based superpositioning of the E. coli structures with the different yGsy2 structures showed that the apo form of eGS structurally resembles the basal state yGsy2 structure (pdb code: 3NAZ) (rmsd of Cα atoms: N-terminal domain – 2.16 Å; C-terminal domain – 1.8 Å) and the eGS closed form structure is most similar to the yGsy2 UDP.G bound activated structure (pdb code: 4KQM) (rmsd of Cα atoms: N-terminal domain – 2.0 Å; C-terminal domain – 2.1 Å). The UDP.G bound activated structure was solved previously by our group (pdb code: 4KQM). This structure had an open tetrameric interface (figure 1D) but UDP.G was captured in its hydrolyzed form in one subunit and when so bound closed the N-terminal domain by 13.3° (figure 1D and 3). In both the E. coli and yeast enzymes, the N-terminal domain motion was attributed to the glucose being trapped in the catalytic cleft. However, the N-terminal domain motions observed in the yGsy2-R589A/R592A double mutant are not attributed to a sugar donor since the structure had only UDP bound in the active sites. Consequently, while the direction of domain motion is similar to that which occurs upon donor binding, the extend of motion is less than a half and the inter-subunit interfaces in the non-activated conformation prevent further closure and capture of the substrate in a manner suitable for transfer.
Figure 3. Closing of the N-terminal domain.

Ribbon representation of the superposed monomers of the G-6-P bound activated state (green), yGsy2-R580A/R581A/R583A basal state (magenta, pdb code: 3NAZ), yGsy2-R589A/R592A inhibited state (cyan) and UDP.G trapped activated state (yellow, pdb code: 4KQM). The arrow points in the direction of the N-terminal domain closure, which is towards the C-terminal domain. The helical extensions (α15 and α16) that form the majority of the tetramic interface within each monomer was used to generate the superpositions.
ii. Closing of the regulatory interface
The domain movements within a monomer impact the relative positioning of structural elements in the tetramer as well. In particular, we observed changes in the distance between the regulatory helices of adjacent monomers. As a consequence of the differences in resolutions of the structures being compared and the different amino acid substitutions along the regulatory helices in those structures, we modified the method by which the changes in the distances between regulatory helices were measured so that the main chain atoms of residues 585 and 589 served as the points of comparison. Using this approach, the distance between opposing regulatory helices in the basal state structure was 12 Å (Figure 4B). The regulatory helices are 4 Å closer in the Gsy2-R589A/R592A inhibited state structure at a distance of 8 Å (Figure 4A). In contrast, the wild-type G-6-P activated structure has a separation distance of 16 Å between the regulatory helices (Figure 4C). The structural transitions that impact the positioning of the regulatory helices are communicated to the N-terminal domain by the direct extension of the helical segment of residues 600–620 into the N-terminal domain.
Figure 4. Redox regulation of yGsy2.

A, B and C. Ribbon representation of the regulatory helices of adjacent monomers in the yGsy2-R589A/R592A inhibited state, yGsy2-R580A/R581A/R583A basal state and G-6-P bound wild-type activated state respectively. The Arg589 and Arg592 in the basal state are shown in stick model and the bound sulfate ions are shown in space filling atom model. G-6-P (purple) bound in the activated state is shown in space filling atoms. D. Ribbon representation of the regulatory interface in the inhibited state. Each monomer is color schemed separately. The arginines 581 and 592 of adjacent monomers are showed in ball and stick model. E. Non-reducing SDS PAGE gel showing the mobility shift between the reduced and non-reduced forms of yGsy2-R581C/R592C mutant enzyme.
Cysteine mutants and regulation of activity through oxidation/reduction of GSY2
Based on the changes in distance between the regulatory helices and the positioning of symmetry-related residues in the tetramer, we hypothesized that we could engineer a reversible redox regulatory feature into the enzyme as a surrogate for covalent regulation by phosphorylation. We noted that arginines 581 and 592 lie directly across the dimer interface from each other and their gamma-carbons are separated by a distance of 4 Å in the inhibited state (Figure 4D). If the activity state of the enzyme is directly correlated with this separation distance, we hypothesized that two cysteine residues under oxidized conditions could form a disulfide bond and close the distance between the regulatory helices by an additional 2 Å and generate a fully inhibited enzyme. Importantly, these disulfide bridges can be reduced to release the structural constraint and, thus, permit activation by G-6-P.
We generated two distinct enzymes with mutations at positions 581 and 592, Gsy2-R581C/R592C and Gsy2-R581A/R592A. Both the mutant enzymes were purified similarly to the wildtype yGsy2 but omitted the use of any reducing agents. Our purified enzymes were analyzed by non-reducing SDS-PAGE (Figure 4E) and the cysteine mutants in the absence of any reducing agents migrated more slowlythrough the gel when compared to the cysteine mutant that had been treated with 250 mM BME. Judging from the molecular weight standards, the non-reduced yGsy2-R581C/R592C mutant enzyme had a molecular weight of > 250 kDa consistent with the yGsy2 tetramer, while the reduced form had a molecular weight of ~72 kDa consistent with the yGsy2 monomer. Both the wildtype and the yGsy2-R581A/R592A enzyme migrated similarly to the reduced form of the yGsy2-R581C/R592C in the presence or absence of BME. Gel-filtration analysis on the non-reduced wt and mutant enzymes all demonstrated molecular masses consistent with a tetramer (319 kDa, data not shown).
The two enzyme forms had specific activities that varied by 12-fold in the absence of G-6-P and by 47-fold in the presence of G-6-P (Table 2). In particular, the oxidized form of Gsy2-R581C/R592C had a specific activity very similar to the phosphorylated form of Gsy2 10 and even lower than the Gsy2-R589A/R592A mutant whose structure we report here. In fact, the specific activity of Gsy2-R581C/R592C is most similar to the Gsy2-R589A/R592A enzyme to which the T668 phospho-peptide has been ligated (Table 2). Unlike the Gsy2-R581A/R592A enzyme that undergoes robust activation by G-6-P, the oxidized Gsy2-R581C/R592C enzyme cannot be activated by G-6-P at concentrations up to 80 mM.
Table 2.
Specific activity and activity ratio measurements for different GSY2 mutants. Data are represented as mean ± SEM.
| Sp Activity (μmole/min.mg) (-G-6-P) | Sp activity (μmole/min.mg) (7.2mM G-6-P) | Activity ratio (-G-6-P/+G-6-P) | |
|---|---|---|---|
| WT Gsy2 | 1.03±0.03 | 1.73±0.03 | 0.6±0.01 |
| Gsy2-R580A/R581A/R583A1 | 0.55±0.02 | 0.51±0.03 | 1.09±0.02 |
| Gsy2-R587A/R589A/R592A1 | 0.38±0.01 | 0.35±0.02 | 1.09±0.01 |
| Gsy2(1-640) +49mer T668P1 | 0.1±0.01 | 1.9±0.02 | 0.05±0.01 |
| Gsy2-R589A/R592A | 0.1±0.01 | 1.56±0.02 | 0.11±0.01 |
| Gsy2-R581C/R592C | 0.033±0.001 | 0.04±0.001 | NA |
| Gsy2-R581C/R592C +200mM BME | 0.58±0.01 | 2.1±0.02 | 0.27±0.02 |
| Gsy2-R581A/R592A | 0.41±0.02 | 1.88±0.04 | 0.28±0.03 |
| Gsy2(1-640)-R589A/R592A + 49mer T668 | 0.03±0.01 | 0.03±0.01 | NA |
Data are from reference 16.
In contrast to the low activity observed for the oxidized form of Gsy2-R581C/R592C, the presence of 200 mM BME in the assay created an active enzyme that responded to G-6-P almost identically to the control Gsy2-R581A/R592A mutant enzyme (Table 2). To examine the relationship between reduction and activity in more detail, we analyzed the ability of three reducing agents to activate the Gsy2-R581C/R592C enzyme, BME, DTT and TCEP. In keeping with the known redox properties of the reducing agents, we found that the half-maximal activating concentrations (AC50) followed the trend, BME>DTT>TCEP, with AC50 values of 15.5 mM, 2.5 mM and 0.29 mM, respectively (Figure 3A). These values were similar in the presence of G-6-P (Figure 3B)
UDP-glucose and G-6-P kinetics
We examined the kinetic parameters for the mutants and, similar to prior work, found that the primary kinetic effect was on Vmax, with minimal effects on KM or S0.5 for G-6-P (Table 3). Using the wild-type Gsy2 enzyme as the basis for comparison, the KM values vary less than 3-fold between the mutants for any combination of additions (G-6-P or BME), whereas, the Vmax values vary between 30- to 50-fold in the absence of G-6-P and/or BME to less than 2-fold when both G-6-P and BME are present (Table 3). Interestingly, the AC50for G-6-P also varied by up to 10-fold, with the wild-type Gsy2 having the lowest AC50 at 0.04 mM and the Gsy2-R581C/R592C enzyme the highest at 0.48 mM (Table 3).
Table 3.
Kinetic parameters for different GSY2 mutants with respect to UDP-glucose (± 10mM G-6-P) both in the presence or absence of 200mM BME. Data are represented as mean ± SEM.
| GSY2 Enzyme | Vmax (−BME, −G-6-P) | Vmax (−BME, +G-6-P) | Vmax (+BME,− G-6-P) | Vmax (+G-6-P, +BME) | S0.5 (G-6-P) | Vmax/KM (−BME, −G-6-P) | Vmax/KM (+BME, +G-6-P) |
|---|---|---|---|---|---|---|---|
| Wildtype | 1.0±0.1 | 1.7±0.1 | 0.99±0.1 | 3.59±0.1 | 0.04±0.01 | 1.72±0.05 | 3.62±0.1 |
| R589,592A | 0.09±0.01 | 1.8±0.1 | 0.17±0.006 | 2.48±0.11 | 0.29±0.03 | 0.32±0.06 | 3.0±0.14 |
| R581,592C | 0.03±0.001 | 0.04±0.003 | 0.59±0.02 | 1.9±0.04 | 0.48±0.02 | 0.054±0.001 | 3.6±0.12 |
| R581,592A | 0.45±0.02 | 1.8±0.04 | 0.43±0.007 | 1.95±0.01 | 0.1±0.01 | 0.25±0.03 | 2.6±0.07 |
Discussion
Allosteric and covalent regulation of glycogen synthase causes the enzyme to exist in different conformational states and, based on the kinetic data, a three state model was proposed for Gsy212. Dephosphorylated Gsy2 in the absence of G-6-P had an intermediate basal state activity (I). Phosphorylation inhibited the enzyme to a low-activity tense state (T), while addition of G-6-P either to the phosphorylated or to the dephosphorylated form activated the enzyme to a high-activity relaxed state (R). Structural information is available only for the (I) and (R) state enzymes. The available information on the (T) state is an extrapolation from these two structural models aided by kinetic and mutational studies.
Gsy2 phosphorylation occurs outside of the catalytic core on the C-terminal tail and, of the three phosphorylation sites, T668 had the dominant effect on the enzyme activity10, 12. Substituting the arginines 589 and 592 of Gsy2 with alanine resulted in an enzyme that had a basal activity similar to the threonine 668 phosphorylated enzyme, while still retaining the ability to be fully activated by G-6-P unless the enzyme was phosphorylated. In this paper, we present the crystal structure of the Gsy2-R589A/592A enzyme as a surrogate for the (T) state of GS. Despite sharing the overall oligomeric arrangement with the (I) state enzyme, the double mutant demonstrated additional rotational closure of the N-terminal Rossmann-fold domain which was correlated with decreased separation between the regulatory helices of adjacent monomers. These motions created a more compact tetrameric interface than in the (I) state. Based on these observations, we propose that the electrostatic repulsion between the opposing arginine residues on the regulatory helix keeps the enzyme “spring-loaded” in the (I) state, so it can respond to regulatory inputs more effectively. Supporting these data is one of our (I) state structures where an alternate conformation was observed when a sulfate induced a collapse of the regulatory helices and a more compact interface (pdb code: 3NCH)10. Thus, charge neutralization either by mutating the arginines to alanine or through anion binding (sulfate or phosphate) collapses the regulatory helices and induces furthertightening of the inter-subunit interfaces.
Unlike yGsy2, Caenorhabditis elegans GS (CeGS) contains the N-terminal phosphorylation sites (sites 2 and 2a) similar to the mammalian enzymes but lacks the last two arginine residues of the arginine cluster. The structure of CeGS showed that the N-terminal phospho-sites are positioned in such a way that they can interact with the regulatory helix13. The phospho-sites, Ser12 and Thr19 are separated from the cis-regulatory helix by only 6–16 Å 13. The authors proposed that upon phosphorylation, the N-terminal tail could dissociate itself from its ordered position and engage with the charged arginine residues13. Taking together all these observations, we propose that the charged arginine residues in the regulatory helices can act as finely tuned sensors that interact directly with both G6P and the inhibitory phosphates, thereby assisting the structural transitions of the enzyme from one state to another.
Redox regulation of enzyme activity through cysteine residues is a common natural phenomenon. Upon oxidation, cysteines are capable of forming disulfide bonds which can be reversed via reduction. Several studies have taken advantage of this chemistry and engineered di-sulfide bridges to activate/inhibit an enzyme and also to achieve stable structural conformations for the purpose of crystallization24, 25. We took a similar approach to address the hypothesis that Gsy2 activity is dependent on the dynamics and distance between the regulatory helices of adjacent monomers. Arginines 581 and 592 are positioned on either side of the regulatory helix facing each other across one of the molecular two-fold axes. Because of their proximity, formation of a disulfide bond between cysteines opposed across the subunit interface should bring the regulatory helices an additional 2 Å closer. An inter-subunit disulfide bond is consistent with the non-reducing SDS-PAGEas the non-reduced cysteine mutant migrated with a mass consistent with a tetramer. It would appear that the domain-swapped nature of the tetrameric interface precludes formation of dimers upon denaturation in non-reducing conditions. That the cysteines do not propogate the formation of higher order aggregates is supported by gel-filtration analysis where only tetramers were observed.
The structural constraint on the dynamics of the interface created by these disulfide bridges should not only inhibit the enzyme but will also render it unable to respond to G-6-P activation. The conformational tension can be released by reduction of the disulfide bonds. Consistent with our hypothesis, in the absence of reducing agents, Gsy2-R589C/592C had very low activity and the addition of up to 80 mM G-6-P had no effect on the activity. This result demonstrated that G-6-P mediated activation of Gsy2 requires structural adaptations which are prevented by the engineered covalent restraint. However, addition of reducing agents like TCEP, DTT and BME, restored the activity of Gsy2-R581C/R592C in a dose-dependent manner and also rendered the enzyme sensitive to G-6-P. The resulting specific activity and activity ratio of the reduced enzyme is very similar to that of the control Gsy2-R581A/R592A mutant. It should also be noted that both Gsy2-R581A/R592A and Gsy2-R581C/R592C (in the presence of BME) had only ~ 50% of the wild type activity in the absence of G-6-P. This observation is consistent with the fact that both Arg589 and Arg592 are required to keep the enzyme in the (I) state, so mutations of one to either alanine or cysteine leads to a partial reduction in basal activity level, by changing the energetics of the conformational set point.
Our kinetic data also suggest that both Gsy2-R589A/R592A and Gsy2-R581C/R592C (oxidized form) share similar kinetic properties with the phosphorylated Gsy2p12. In all three cases, the largest changes were observed in the enzyme’s Vmax values with smaller changes to KM values, showing that UDP-glucose binding is relatively unaffected either in the presence or absence of G-6-P. Similar observations were made earlier where both G-6-P binding and phosphorylation changed the KM values for glycogen without significantly changing the KM values for UDP-glucose12. These results are consistent with the available structural evidence where access to the UDP-glucose binding site is much less affected by the conformational transitions, whereas the surface of the N-terminal domain where the acceptor arm of glycogen is thought to bind is impacted by these same structural transitions14.
In summary, we propose that redox regulation of Gsy2 serves as a functional model for GS phosphorylations. In our model, the inhibitory phospho-serines/threonines on the C-terminal tail are expected to act as anchor points for a molecular strap by directly interacting with the arginine cluster across the subunit interface. This could promote regulatory helix closure similar to that observed in the Gsy2-R589A/R592A enzyme structure. Multiple phosphorylation sites in the higher eukaryotes on both the C- and N-terminal extensions will provide additional anchoring points for the termini by increasing the effective concentration of these inhibiting interactions and inducing further tightening of the interactions surrounding the arginine-rich interface. Our Gsy2-R581C/R592C mutant mimics the effect through disulfide bond formation. G-6-P binding on the regulatory helix can disrupt the inhibitory interactions created by closure of the interface and push the regulatory helices apart, but only if there is an additional repulsive force available in the form of arginines 589 and 592. In the absence of this opposing force or the presence of the disulfide bond in the oxidized form of the Gsy2-R581C/R592C enzyme, G-6-P cannot override the interactions that lock the tetrameric interface closed. These results suggest the key role played by Arg589 and Arg592 in establishing the reversibility of the (T) state. Taken together, the crystallographic data obtained from the Gsy2-R589A/R592A mutant provides structural insights into the inhibited state of Gsy2 which is further confirmed through disulfide engineering of the interface. The last two arginines keep the enzyme in the basal state by a charge repulsion mechanism. Upon binding of the phosphorylated terminii to the interface, the regulatory helices are brought closer, leading to closure of the N-terminal domain and hindering acceptor access to the active site. G-6-P binding pushes the regulatory helices apart by acting as a conformational wedge and leading to better acceptor access by opening the N-terminal Rossmann-fold domain.
Figure 5. Redox regulation of the cysteine mutants.

A. Dose dependent activation of yGsy2-R581C/R592C with increasing concentration of TCEP (red), DTT (green), BME (blue) in the absence of G-6-P. B. Activation of yGsy2-R581C/R592C in the presence of G-6-P. The color scheme is identical to panel A.
Acknowledgments
We would like to thank the staff at the Structural Biology Center Beamline SBC beamline 19ID (Steve Ginnel). Results shown in this report are derived from work performed at Argonne National Laboratory, Structural Biology Center at the Advanced Photon Source. Argonne is operated by UChicago Argonne, LLC, for the U.S. Department of Energy, Office of Biological and Environmental Research under contract DE-AC02-06CH11357.
Funding sources
This work was supported by NIH grants R01-DK079887 (TDH), DK27221 (PJR) and NS056454 (PJR).
Footnotes
Accession codes
Protein Data Bank: Coordinates and structure factors have been deposited with the following accession codes: yGsy2-R589A/R592A, 5SUL; yGsy2wt G6P complex, 5SUK.
References
- 1.Roach PJ, Depaoli-Roach AA, Hurley TD, Tagliabracci VS. Glycogen and its metabolism: some new developments and old themes. The Biochemical journal. 2012;441:763–787. doi: 10.1042/BJ20111416. [DOI] [PMC free article] [PubMed] [Google Scholar]
- 2.Lairson LL, Henrissat B, Davies GJ, Withers SG. Glycosyltransferases: structures, functions, and mechanisms. Annual review of biochemistry. 2008;77:521–555. doi: 10.1146/annurev.biochem.76.061005.092322. [DOI] [PubMed] [Google Scholar]
- 3.Browner MF, Nakano K, Bang AG, Fletterick RJ. Human muscle glycogen synthase cDNA sequence: a negatively charged protein with an asymmetric charge distribution. Proceedings of the National Academy of Sciences of the United States of America. 1989;86:1443–1447. doi: 10.1073/pnas.86.5.1443. [DOI] [PMC free article] [PubMed] [Google Scholar]
- 4.Nuttall FQ, Gannon MC, Bai G, Lee EY. Primary structure of human liver glycogen synthase deduced by cDNA cloning. Archives of biochemistry and biophysics. 1994;311:443–449. doi: 10.1006/abbi.1994.1260. [DOI] [PubMed] [Google Scholar]
- 5.Hardy TA, Roach PJ. Control of yeast glycogen synthase-2 by COOH-terminal phosphorylation. The Journal of biological chemistry. 1993;268:23799–23805. [PubMed] [Google Scholar]
- 6.Farkas I, Hardy TA, DePaoli-Roach AA, Roach PJ. Isolation of the GSY1 gene encoding yeast glycogen synthase and evidence for the existence of a second gene. The Journal of biological chemistry. 1990;265:20879–20886. [PubMed] [Google Scholar]
- 7.Parker PJ, Caudwell FB, Cohen P. Glycogen synthase from rabbit skeletal muscle; effect of insulin on the state of phosphorylation of the seven phosphoserine residues in vivo. European journal of biochemistry. 1983;130:227–234. doi: 10.1111/j.1432-1033.1983.tb07140.x. [DOI] [PubMed] [Google Scholar]
- 8.Roach PJ, Takeda Y, Larner J. Rabbit skeletal muscle glycogen synthase. I. Relationship between phosphorylation state and kinetic properties. The Journal of biological chemistry. 1976;251:1913–1919. [PubMed] [Google Scholar]
- 9.Wilson WA, Boyer MP, Davis KD, Burke M, Roach PJ. The subcellular localization of yeast glycogen synthase is dependent upon glycogen content. Canadian journal of microbiology. 2010;56:408–420. doi: 10.1139/w10-027. [DOI] [PMC free article] [PubMed] [Google Scholar]
- 10.Baskaran S, Roach PJ, DePaoli-Roach AA, Hurley TD. Structural basis for glucose-6-phosphate activation of glycogen synthase. Proceedings of the National Academy of Sciences of the United States of America. 2010;107:17563–17568. doi: 10.1073/pnas.1006340107. [DOI] [PMC free article] [PubMed] [Google Scholar]
- 11.Baskaran S, Chikwana VM, Contreras CJ, Davis KD, Wilson WA, DePaoli-Roach AA, Roach PJ, Hurley TD. Multiple glycogen-binding sites in eukaryotic glycogen synthase are required for high catalytic efficiency toward glycogen. The Journal of biological chemistry. 2011;286:33999–34006. doi: 10.1074/jbc.M111.264531. [DOI] [PMC free article] [PubMed] [Google Scholar]
- 12.Pederson BA, Cheng C, Wilson WA, Roach PJ. Regulation of glycogen synthase. Identification of residues involved in regulation by the allosteric ligand glucose-6-P and by phosphorylation. The Journal of biological chemistry. 2000;275:27753–27761. doi: 10.1074/jbc.M003342200. [DOI] [PubMed] [Google Scholar]
- 13.Zeqiraj E, Tang X, Hunter RW, Garcia-Rocha M, Judd A, Deak M, von Wilamowitz-Moellendorff A, Kurinov I, Guinovart JJ, Tyers M, Sakamoto K, Sicheri F. Structural basis for the recruitment of glycogen synthase by glycogenin. Proceedings of the National Academy of Sciences of the United States of America. 2014;111:E2831–2840. doi: 10.1073/pnas.1402926111. [DOI] [PMC free article] [PubMed] [Google Scholar]
- 14.Chikwana VM, Khanna M, Baskaran S, Tagliabracci VS, Contreras CJ, DePaoli-Roach A, Roach PJ, Hurley TD. Structural basis for 2′-phosphate incorporation into glycogen by glycogen synthase. Proceedings of the National Academy of Sciences of the United States of America. 2013;110:20976–20981. doi: 10.1073/pnas.1310106111. [DOI] [PMC free article] [PubMed] [Google Scholar]
- 15.Minor W, Cymborowski M, Otwinowski Z, Chruszcz M. HKL-3000: the integration of data reduction and structure solution--from diffraction images to an initial model in minutes. Acta crystallographica. Section D, Biological crystallography. 2006;62:859–866. doi: 10.1107/S0907444906019949. [DOI] [PubMed] [Google Scholar]
- 16.Bunkoczi G, Echols N, McCoy AJ, Oeffner RD, Adams PD, Read RJ. Phaser. MRage: automated molecular replacement. Acta crystallographica. Section D, Biological crystallography. 2013;69:2276–2286. doi: 10.1107/S0907444913022750. [DOI] [PMC free article] [PubMed] [Google Scholar]
- 17.Collaborative Computational Project. The CCP4 suite: programs for protein crystallography. Acta Crystallogr D Biol Crystallogr. 1994;50:760–763. doi: 10.1107/S0907444994003112. [DOI] [PubMed] [Google Scholar]
- 18.Murshudov GN, Skubak P, Lebedev AA, Pannu NS, Steiner RA, Nicholls RA, Winn MD, Long F, Vagin AA. REFMAC5 for the refinement of macromolecular crystal structures. Acta crystallographica. Section D, Biological crystallography. 2011;67:355–367. doi: 10.1107/S0907444911001314. [DOI] [PMC free article] [PubMed] [Google Scholar]
- 19.Emsley P, Cowtan K. Coot: model-building tools for molecular graphics. Acta crystallographica. Section D, Biological crystallography. 2004;60:2126–2132. doi: 10.1107/S0907444904019158. [DOI] [PubMed] [Google Scholar]
- 20.Otwinowski Z, Minor W, et al. Processing of X-ray diffraction data collected in oscillation mode. Methods in enzymology. 1997;276:307–326. doi: 10.1016/S0076-6879(97)76066-X. [DOI] [PubMed] [Google Scholar]
- 21.Thomas JA, Schlender KK, Larner J. A rapid filter paper assay for UDPglucose-glycogen glucosyltransferase, including an improved biosynthesis of UDP-14C-glucose. Analytical biochemistry. 1968;25:486–499. doi: 10.1016/0003-2697(68)90127-9. [DOI] [PubMed] [Google Scholar]
- 22.Sheng F, Jia X, Yep A, Preiss J, Geiger JH. The crystal structures of the open and catalytically competent closed conformation of Escherichia coli glycogen synthase. The Journal of biological chemistry. 2009;284:17796–17807. doi: 10.1074/jbc.M809804200. [DOI] [PMC free article] [PubMed] [Google Scholar]
- 23.Qi G, Lee R, Hayward S. A comprehensive and non-redundant database of protein domain movements. Bioinformatics. 2005;21:2832–2838. doi: 10.1093/bioinformatics/bti420. [DOI] [PubMed] [Google Scholar]
- 24.Jung SH, Pastan I, Lee B. Design of interchain disulfide bonds in the framework region of the Fv fragment of the monoclonal antibody B3. Proteins. 1994;19:35–47. doi: 10.1002/prot.340190106. [DOI] [PubMed] [Google Scholar]
- 25.Kawate T, Gouaux E. Arresting and releasing Staphylococcal alpha-hemolysin at intermediate stages of pore formation by engineered disulfide bonds. Protein science: a publication of the Protein Society. 2003;12:997–1006. doi: 10.1110/ps.0231203 . [DOI] [PMC free article] [PubMed] [Google Scholar]