

Abstract
Yarrowia lipolytica is a promising microbial cell factory for the production of lipids to be used as fuels and chemicals, but there are few studies on regulation of its metabolism. Here we performed the first integrated data analysis of Y. lipolytica grown in carbon and nitrogen limited chemostat cultures. We first reconstructed a genome-scale metabolic model and used this for integrative analysis of multilevel omics data. Metabolite profiling and lipidomics was used to quantify the cellular physiology, while regulatory changes were measured using RNAseq. Analysis of the data showed that lipid accumulation in Y. lipolytica does not involve transcriptional regulation of lipid metabolism but is associated with regulation of amino-acid biosynthesis, resulting in redirection of carbon flux during nitrogen limitation from amino acids to lipids. Lipid accumulation in Y. lipolytica at nitrogen limitation is similar to the overflow metabolism observed in many other microorganisms, e.g. ethanol production by Sacchromyces cerevisiae at nitrogen limitation.
Introduction
The yeast Yarrowia lipolytica has a high potential as microbial cell factory for the production of biofuels and chemicals. Y. lipolytica is an oleaginous yeast, capable of accumulating over 70% of its biomass as lipids. 1 These lipids are stored in lipid bodies and exist primarily of triacylglycerols (TAGs) with different chain lengths, which can function as intermediates for the production of advanced biofuels. 2 Studying metabolism in Y. lipolytica is of interest as its dysregulation allows engineering opportunity for increased lipid production. As an example, a push-and-pull genetic engineering strategy has been employed to divert the carbon flux during nitrogen restriction towards TAG production. 3 Overexpression of acetyl-CoA carboxylase (ACC1) pulls carbons from the typical excretion metabolite citrate into fatty acid biosynthesis, while overexpression of diacylglycerol acyltransferase (DGA1) pushes the fatty acids into the TAGs. This approach has been successful as almost all carbons are diverted from citrate excretion into TAG biosynthesis. However, while efforts have been made to increase lipid production in Y. lipolytica, 4 currently our knowledge of how lipid accumulation is regulated in Y. lipolytica is limited, whereas regulators as SNF1, 5 MIG1 6 and MGA2 7 have been shown to affect lipid accumulation. Systems level analysis is an excellent tool for probing regulatory mechanisms, as demonstrated extensively for Sacchromyces cerevisiae. 8,9 However no such approach has been applied to Y. lipolytica to date, and we therefore undertook the first integrated analysis of lipid accumulation in Y. lipolytica.
Results
Reconstruction of genome-scale metabolic model
Integration of multilevel data requires a framework that can accommodate different data types and allows for mapping of interactions. For this purpose we generated a comprehensive genome-scale metabolic model (GEM) of Y. lipolytica metabolism. Although three GEMs of Y. lipolytica have been published previously (iYL619_PCP, 10 iNL895 11 and iMK735 12 ), our model is far more comprehensive, based on the more recent Yeast 7.11 consensus network 13 and curated to include unique reactions from both iYL619_PCP and iNL895. Further curation was performed with available literature data and improved annotation of the Y. lipolytica genome as described in Supplementary Informations 1 and 2. The resulting model is the most comprehensive GEM of an oleaginous yeast to date, and provides the biofuel research community with a tool for further identifying engineering targets and a framework to unravel regulation of metabolism. We name this model iYali4, as the fourth published GEM of Y. lipolytica.
Physiological characterisation of chemostat cultures
A high-lipid producing strain of Y. lipolytica, overexpressing diacylglycerol acyltransferase (DGA1), the last step of TAG biosynthesis, was cultivated in a bioreactor under chemostat conditions. Restrictive availability of ammonium (as nitrogen source) was compared to the restrictive availability of glucose (as carbon source), all at the same dilution rate (0.05 per h). Carbon–nitrogen ratios of 2.2 and 110 were selected as representing carbon versus nitrogen limitation (Supplementary Information 3). When the cultures reached steady state, defined at a constant OD600 and O2 partial pressure in the exhaust gas, samples were taken for measurements (Figure 1).
Figure 1.
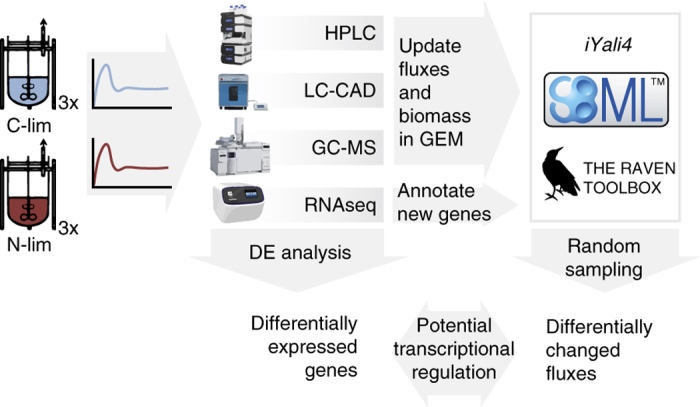
Experimental design. Triplicate chemostats were run at steady-state, after which various samples were taken. Strain-specific GEMs were generated using the experimental data and the predicted flux changes were compared with differentially expressed transcripts, indicating potential transcriptional regulation.
An overview of the fermentation profile shows that the specific glucose consumption rate (q gluc) was similar at both nitrogen and carbon limitations, and also the biomass yield (Y SX) was comparable (Table 1). This is in stark contrast with for instance S. cerevisiae where nitrogen limitation results in ethanol fermentation and a fivefold decrease in the biomass yield. 14 Y. lipolytica is, however, an obligatory aerobe and does not ferment ethanol. Although wild-type Y. lipolytica produces citrate as a carbon overflow metabolite, the DGA1 strain used in this study instead shuttles citrate towards lipid production. 3 HPLC analyses of the cell-free supernatants confirmed the absence of citrate excretion. The specific oxygen and carbon dioxide exchange rates are higher during nitrogen restriction (Table 1), suggesting a more active oxidative phosphorylation.
Table 1. Physiological parameters.
| Carbon restriction | Nitrogen restriction | |
|---|---|---|
| Specific growth rate (per hour) | 0.047 (±0.004) | 0.048 (±0.002) |
| Biomass concentration (g/l) | 2.1 (±0.1) | 2.7 (±0.5) |
| Extracellular glucose concentration (g/l) | 0 | 17.9 (±0.8) |
| q Gluc (mmol gDW/h) | 0.61 (±0.06) | 0.64 (±0.06) |
| q O2 (mmol gDW/h) | 1.3 (±0.3) | 2.1 (±0.3) |
| q CO2 (mmol gDW/h) | 1.5 (±0.1) | 2.2 (±0.3) |
| RQ (−) | 1.15 (±0.20) | 1.0 (±0.1) |
| YSX (gDW g/glucose) | 0.43 (±0.02) | 0.42 (±0.01) |
| Dissolved oxygen (%) | 82 (±4) | 74 (±10) |
Abbreviation: RQ, respiratory quotient.
Data are means (s.d.) from three independent chemostats.
A high degree of filamentous growth (Supplementary Information 4) was observed in all chemostat cultures and shake flasks cultivations using the same growth medium, albeit at lower levels in shake flasks. Filamentation has been observed previously in bioreactor cultivations for studies of lipid accumulation. 15 Filamentation can be induced by a range of environmental changes, including the carbon source, 16,17 nitrogen source, 16,18,19 temperature, 20 oxygenation, 18,21 pH and buffer composition. 16,19 In addition, conflicting conclusions can be found in the literature, possible due to strain specificity. 22 We adjusted several of these operational parameters in our chemostat fermentations, but none of these adjustments resulted in a major reduction in filamentation, showing that filamentous growth is a complex response that can involve multiple triggers. We did not evaluate the addition of a complete supplement mixture or addition of amino acids to the medium as this would complicate restricting the nitrogen source and complicate quantification of uptake fluxes. Nonetheless, as filamentation occurred at all growth conditions, physiological responses associated with filamentous growth will be filtered out in a comparative analysis.
Increases in lipids during nitrogen restriction
The lipid compositions of Y. lipolytica were measured for both nutrient restrictions, and the most dominant phospholipids were found to be PE, PC and PI (Figure 2), corroborating previous measurements of Y. lipolytica. 23 The low steryl ester (SE) content was surprising, as SE is typically identified as a storage lipid together with TAG, and lipid droplets normally contain 7.8–14% steryl esters. 24 However, other reports state that steryl esters are only present in very small amounts. 25
Figure 2.
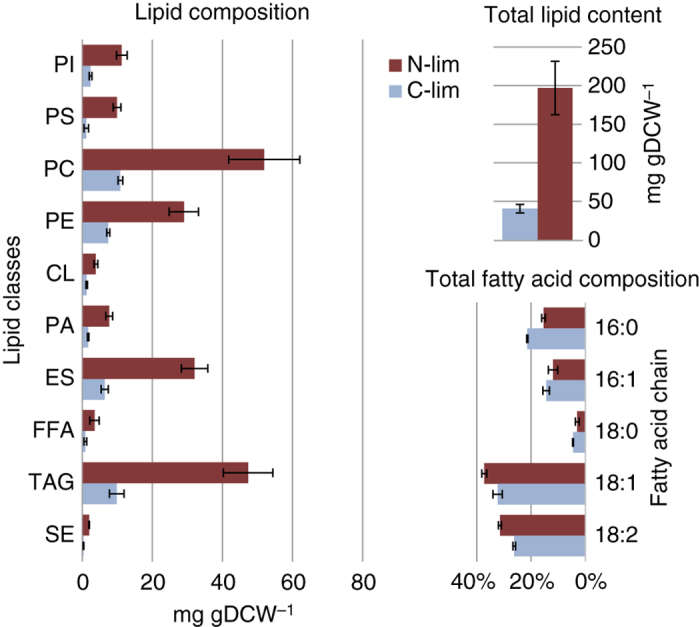
Lipid and total fatty acid composition. Error bars are s.d. of three independent biological replicates. CL, cardiolipin; ES, ergosterol; FFA, free fatty acid; PA, phosphatidate; PC, phosphatidyl-choline; PE, phosphatidylethanolamine; PI, phosphatidyl-inositol; PS, phosphatidyl-serine; SE, steryl ester; TAG, triacylglycerol.
The total lipid content increased from 40.5 mg/gDW (±5.7 mg/gDW) during carbon limitation to 197 mg/gDW (±35 mg/gDW) during nitrogen limitation (Figure 2). During batch fermentation of the DGA strain the total lipid content reached 338mg/gDW confirming that the chemostat cultivations simulate conditions occurring earlier in the batch fermentation, when lipids are still actively accumulating. 3
The increased lipid content during nitrogen limitation could surprisingly be contributed to an increase in virtually all lipid species and not just triacylglycerols and steryl esters (Figure 2). In S. cerevisiae lipid droplets are likely structured with an inner-core of TAGs, surrounded by a shell of steryl esters and an outer surface of a phospholipid monolayer, 26 whereas lipid droplets in Y. lipolytica grow in size when more lipids are accumulated. 24 Larger lipid droplets require more total phospholipids, whereas the ratio of phospholipid per lipid content would decrease, albeit they only contribute 1.6–2% to the total amount of lipids in lipid droplets. 24 The increase could also be due to a larger amounts of other intracellular membranes. The increase in filamentation (Supplementary Information 4) observed during nitrogen limitation may contribute to the increased phospholipids. A more cylindrical shape of the cells result in a larger surface-to-volume ratio, whereas the amount of lipids in the cell wall remains at 5% in both yeast and filamenteous Y. lipolytica. 27
All isolated lipids were derivatized to release fatty acid methyl esters (FAMEs) that were subsequently analysed by GC-MS. The fatty acid composition shows only a minor shift towards shorter chain lengths (Figure 2); C16 versus C18; and the saturation level decreases at nitrogen limitation compared with carbon limitation. This is in contrast to batch fermentations where C18:0 is the second most prominent fatty acid, 3 whereas C16:1 and C18:2 have the lowest levels. 3
Transcriptional changes during nitrogen limitation
To quantify the regulatory responses to the shift in nutrient limitation we performed RNA sequencing. Gene-set analysis was performed on normalised RNA counts to obtain a systemic overview of the differential expression, where gene-sets were defined by GO term annotations obtained from various databases. The overall picture obtained was that Y. lipolytica under nitrogen limitation attempts to minimise its nitrogen usage (Figure 3). GO terms enriched for transcripts that are upregulated during nitrogen limitation are involved in protein turnover and autophagy, providing alternative sources of nitrogen. In contrast, many of GO terms enriched for downregulated transcripts are related to amino-acid metabolism.
Figure 3.

Gene-set analysis of nitrogen over carbon limitation. Carbon limitation functioned as reference condition. Gene sets are defined by GO terms, and for significantly enriched GO terms (adjusted P<0.01) is shown what percentage of genes are either up- or downregulated at nitrogen limitation. The top GO terms are upregulated while the lower GO terms are downregulated.
The transcriptional response appears highly regulated with about 30 putative transcription factors differentially expressed (Supplementary Information 5). Although transcriptional regulatory networks can be subjected to rewiring, 28 such as the shift of SREBP from regulating ERG genes to regulate filamentation, 29 other parts of transcriptional regulatory networks are more conserved.
Several signalling networks are involved in the response to use of different nitrogen sources in S. cerevisiae. 30 Nitrogen restriction releases nitrogen catabolite repression (NCR), which is regulated by interplay of four GATA transcription factors conserved to Y. lipolytica, Gln3, Gat1, Gzf3 and Dal80. Homology prediction is difficult for their genes due to high similarity, however, Yali0D20482g and Yali0C22682g are likely GAT1 and GZF3, whereas GLN3 and DAL80 are Yali0F17886g and Yali0E05555g. 31 GAT1 and GZF3 are strongly upregulated during nitrogen limitation (Supplementary Information 5). Interestingly, glutamate dehydrogenase (Yali0F17820g; Yali0E09603g), glutamate synthase (Yali0B19998g) and glutamine synthetase (Yali0F00506g) are not upregulated during nitrogen limitation, while they are upregulated in nitrogen restricted R. toruloides. 32 As an alternative route to recycle nitrogen, Y. lipolytica has an ortholog (Yali0A06974g) of the Aspergillus nidulans xanthine dehydrogenase, 33 which is absent in S. cerevisiae. Presence of this pathway means that purines can be degraded via allantoin to release ammonia. Multiple genes in this pathway are under control by Gat1 and Gln3, whereas this whole pathway is upregulated during nitrogen restriction (Figure 3), corroborating the release of NCR.
A more central role in nitrogen sensing and signalling is played by the TOR complex, 34 where nitrogen starvation inhibits TOR, what subsequently, among others, inhibits protein translation, activates autophagy and reconfigures amino-acid permeases. 30 The observed differential gene expression profile supports TOR-mediated regulation, such as upregulation of autophagy, proteasome, peptidases and ubiquination (Figure 3).
Another key regulator of metabolism is Snf1, a protein kinase that is involved in many signalling pathways, including the shift from fermentation to aerobic metabolism in S. cerevisiae, regulation of amino-acid metabolism, inhibition of translation and activation of β-oxidation. A Y. lipolytica knockout of SNF1, or other components of the Snf1 signalling complex, has an increased lipid content, and from this it has been proposed that Snf1 is an important regulator of lipid accumulation in Y. lipolytica. 5 In S. cerevisiae Snf1 inhibits the activity of the acetyl-CoA carboxylase Acc1 by phosphorylation, 35 and these phosphorylation-sites on Acc1 are conserved in Y. lipolytica Acc1. However, the gene expression profile of the SNF1 knockout was very distinct from the chemostat expression profiles, even though both presented an oleaginous phenotype. 5 For instance, removal of Snf1 increases expression of β-oxidation 5 while this pathway was downregulated during nitrogen restricted chemostat culture, represented by the GO terms acyl-CoA dehydrogenase and oxidase (Figure 3). β-oxidation could be considered as a futile cycle during lipid accumulation, although it has been reported that Y. lipolytica degrades its reserves lipids even in presence of high carbon concentration in the medium. 36,37 Y. lipolytica has six acyl-CoA oxidases with different specificities. 38 The deletion of all six genes produces a higher lipid content 25 while deletion of the peroxisomal biogenesis gene PEX10 also increases lipid accumulation. 4 These metabolic engineering strategies are based on manipulating the β-oxidation response of Y. lipolytica in oleagenic conditions. The SNF1 knockout, in contrast, leads to a similar oleaginous phenotype but its regulatory response seems to be distinct from what is observed in typical nitrogen-limitation induced lipid accumulation. This questions the important role of Snf1 in the regulation of lipid metabolism. The SNF1 knockout is forced to accumulate lipids due to the lack of repression of Acc1 by Snf1, however, the observed transcriptional response is not representative for lipid accumulation, and therefore the role of Snf1 in lipid accumulation is likely limited to its regulation of Acc1.
Correlation of transcription and metabolic fluxes
Although differential expression of genes is indicative of how the organism reacts to a certain treatment or condition, changes in transcript levels do not necessarily translate to changes in protein levels and, when these proteins are enzymes, in changes in metabolic fluxes. Nonetheless, correlations of transcriptional changes with changes in metabolic fluxes suggest transcriptional regulation of those reactions. Therefore, metabolic fluxes for each reaction were estimated using the Y. lipolytica GEM, by constraining the model with condition-specific experimental data, i.e., glucose and oxygen consumption rates, CO2 production rate, growth rate and measured lipid composition (Table 1, Figure 2). The resulting models were sampled using a random sampling algorithm, 39 providing means and s.d. for each flux in either nitrogen or carbon limitation. Standard scores were calculated for each reaction and these were compared with standard scores calculated for the transcriptional changes. Of the 2,194 gene-reaction pairs, 53 showed transcriptional regulation (Supplementary Information 6).
Our gene-set analysis already identified downregulation of amino-acid metabolism (Figure 3). This downregulation is also observed in the metabolic fluxes through several of the amino-acid biosynthetic pathways (Figure 4). Specifically, leucine has been suggested to be involved in the regulation of lipid metabolism in Y. lipolytica. 4 The LEU2 gene is an often used selective marker on overexpression plasmids to metabolically engineer leucine auxotrophic strains (e.g., Po1g), while the additional supplementation with leucine, and not isoleucine, resulted in a higher accumulation of lipids. 4 It is plausible that Y. lipolytica senses the increased leucine level and as a transcriptional response further downregulates amino-acid biosynthesis. This further downregulation then provides an ever stronger redirection of flux towards lipid metabolism. Interestingly, in S. cerevisiae leucyl-tRNA synthethase has been identified as controlling TORC1 in a leucine-dependent manner. 40 Although this identifies an intracellular leucine sensor, the activation of TORC1 with increased leucine is actually the opposite as what is observed during nitrogen limitation.
Figure 4.
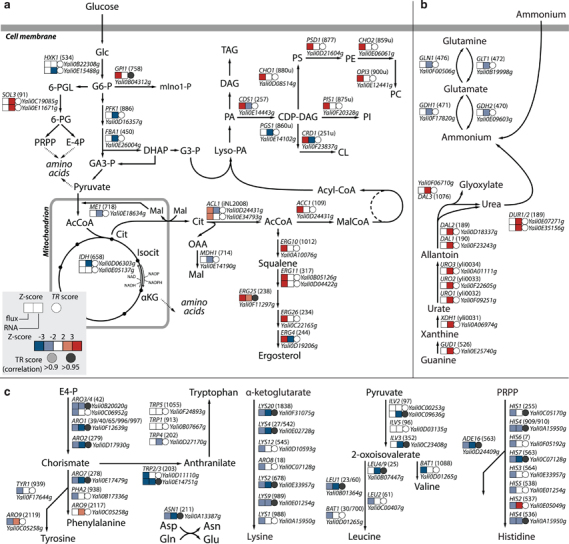
Schematic overview of changes in flux and transcript levels. Arrows can represent multiple reactions. Z-scores indicate changes on the levels of metabolic flux or RNA, TR score indicates a correlation between metabolix flux and RNA, suggesting transcriptional regulation. (a) Central carbon metabolism including lipid metabolism. (b) Nitrogen metabolism. (c) Amino acid biosynthetic pathways.
Lipid metabolism has limited transcriptional regulation
While the lipid contents of the cells change drastically upon nitrogen limitation, the transcript levels of lipid metabolism was poorly regulated. In contrast to the increasing lipid content at nitrogen limitation, some of the transcripts were downregulated at this condition. Lipid metabolism therefore does not appear to be regulated at the transcriptional level.
Previously, the transcriptional response to the onset of lipid accumulation has been studied in fed-batch cultivations. 31 There are numerous differences observed in expressional changes between the two data sets, including changes in isocitrate lyase, aconitase and dephospho-CoA kinase expression during fed-batch cultivations that are not changing in the chemostats. Many of these difference can be explained by the fact that the chemostat experiments only compares steady-state nitrogen versus carbon limitation, whereas the fed-batch cultivation includes adaptation and growth-related differences. Nonetheless, both data sets show similar trends, such as changes related to NCR, but more importantly the lack of transcriptional regulation of lipid metabolism, not only during steady-state lipid accumulation but also during its transition towards this state. 31
While metabolic engineering efforts have been made in the overexpression of genes part of the lipid biosynthetic pathway, 3,15 it seems that these strategies are based on crudely forcing the flux towards lipid metabolism instead of taking the native regulatory mechanisms into account. In contrast, the native regulation that occurs during nitrogen limitation is primarily focused on regulating amino-acid metabolism (Figure 5).
Figure 5.
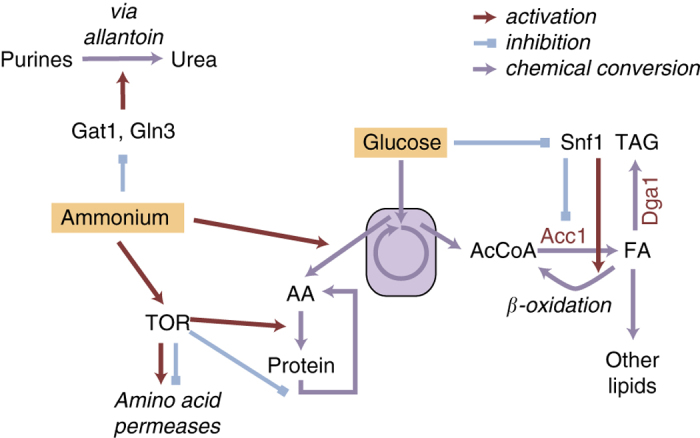
Schematic overview of regulation that occurs during nitrogen limitation in a high-lipid producing strain.
Discussion
Limitation of nitrogen during continued growth of Y. lipolytica provokes a dramatic response in the biomass composition, i.e. a sustained increase in virtually all lipids. It has been proposed that an important role in this process is the inhibition of AMP-dependent isocitrate dehydrogenase evoked by an increased activity of AMP deaminase. 41 Although transcriptional regulation likely has another important role in this response, as not only a significant number of transcripts but also many TFs are differently expressed, it appears that lipid metabolism itself is undergoing very limited transcriptional regulation. The metabolic network is adapted to divert the carbon flux from pathways requiring nitrogen, such as amino-acid metabolism, while the lipid biosynthetic pathways are seemingly in high enough activity to harbour this increased flux. Nonetheless, it is likely that additional regulation takes place such as post-translational modifications, as it is known that Acc1 activity is repressed by phosphorylation by Snf1, which probably contributes to the oleaginous phenotype in the SNF1-knockout. This corroborates findings from fed-batch cultivations of Y. lipolytica, where also limited transcriptional regulation of lipid metabolism was observed. 31 In addition, in R. toruloides the limited transcriptional regulation of lipid metabolism is primarily focused on the downregulation of β-oxidation. 32 Although Y. lipolytica does not seem to regulate the expression of its lipid metabolism, metabolic engineering efforts have been made to increase the lipid yield by overexpression of additional copies of native genes involved in lipid metabolism, such as ACC1, DGA1 and recently stearoyl-CoA desaturase. 15 These efforts have been successful; however, it ignores the original regulatory mechanisms of the cell. Taking the native regulatory network into account will result in more robust and increased lipid yields, and our findings may enable coupling growth and lipid accumulation, which is required for obtaining high specific productivities of TAG.
A more systematic study of lipid accumulation in oleaginous yeasts requires a high-quality framework to integrate the various data, which we provide here with a high-quality genome-scale model of Y. lipolytica. Our findings point to that Snf1 might not naturally have an important role in lipid accumulation as previously postulated. Thus, even though a knockout of SNF1 results in an oleaginous phenotype, the transcription profile is the opposite of what happens during lipid accumulation induced by nitrogen restriction. Our results therefore point to that lipid accumulation in Y. lipolytica at nitrogen limitation is similar to the overflow metabolism observed in many other microorganisms, e.g. ethanol production by S. cerevisiae at nitrogen limitation, and more in line with what is observed in mammals where a high carbon to nitrogen ratio in the diet results in TAG accumulation.
Materials and Methods
Yeast strain and chemostats
The Yarrowia lipolytica strain used in this study was derived from Po1g (Leu−), contains the MTYL053 plasmid expressing DGA1 and was provided by ref. 3. Chemostat cultures were performed with a dilution rate of 0.05 per hour at 30 °C in 1.2 l bioreactors (DASGIP, Jülich, Germany) with a working volume of 750 ml at pH 3.5, controlled with 2 M KOH. Dissolved oxygen was kept above 30% with a stirrer rate of 600 rpm and an air flow rate of 1 v.v.m. For carbon restriction, 1 l medium contained 5 g glucose, 5 g (NH4)2SO4, 3 g KH2PO4, 0.5 g MgSO4·7 H2O, vitamins and trace metal solutions 42 and 125 μl antifoam 204 (Sigma-Aldrich, St Louis, MO, USA). For nitrogen restriction a similar medium was used, where the glucose was increased to 25 g, the (NH4)2SO4 decreased to 0.5 g while SO4 levels remained constant by adding 5.96 g K2SO4. CO2 and residual O2 in the exhaust gas were measured using an online gas analyser (DASGIP). Samples for cell dry weight, lipid and FAME analysis and transcriptomics were taken when the chemostats reached steady state, defined as stable CO2 and O2 outflow and optical density, which was achieved after circa 120 h.
Lipid and fatty acid analysis
Samples were taken from the steady-state chemostat cultivations to investigate their lipid contents and compositions. The biomass was disrupted and lipids extracted using a fast microwave-assisted extraction method, 43 and subsequently analysed by LC-CAD, allowing quantification of 10 different lipid species. Fatty acids were extracted and derivatized to fatty acid methyl esters using a similar microwave-assisted method 44 and subsequently analysed by GC-MS.
RNA extraction and sequencing
Samples for RNA analysis were rapidly taken from steady-state chemostats, frozen in liquid nitrogen and stored at −80 °C. Total RNA was extracted with Trizol (Invitrogen, Carlsbad, CA, USA) using the manufacturer’s instructions with additional mechanical disruption of the cells using a FastPrep homogenizer (MP Biomedicals, Santa Ana, CA, USA) and 1 mm silica beads. Further RNA preparation and RNA sequencing was performed by SciLifeLab in Uppsala, Sweden using their IonTorrent platform. Data are deposited at ArrayExpress (E-MTAB-3837). Raw RNAseq reads were aligned to the Y. lipolytica CLIB122 reference genome using local alignment in Bowtie, 45 counts were obtained with HTSeq 46 and transformed using voom. 47 In all analyses, carbon limitation was set as reference condition.
De novo assembly
Raw RNA data from all samples was concatenated and reads of <40 base pairs were removed. Transcripts were de novo assembled and coding sequences predicted using the Trinity software package. 48 Proteins were functionally annotated using Blast2GO. 49 Full length transcripts and coding sequences were aligned to the reference genome contigs from strain CLIB122 50 using Blat 51 to determine their position and percent identity. Determination of best hits was made using Identity score, calculated as [(Q end—Q start—Q gap bases)/Q size+(T end—T start—T gap bases)/T size]×[match/(match+mis-match)]/2. Transcripts with an identity score <0.4 were considered poor quality alignments.
Genome-scale modelling
A genome-scale model of Y. lipolytica was reconstructed using the RAVEN toolbox in Matlab 52 and the yeast consensus network version 7.11 (ref. 13) was employed as a template. To facilitate integration of our FAME analysis, we reverted the extensive expansion of lipid metabolism in yeast 7, where the length of each acyl-chain is specified. A previously published Yarrowia GEM was assessed and curations on this model were transferred to our model.11 Additional gap filling and curation was performed manually. This resulted in our model iYali4, available from BioModels database (MODEL1508190002) and as Supplementary Information 7.
Flux ranges were determined using the random sampling approach, 39 where random combinations of objective functions are used to sample the edges of the solution space. The difference in flux ranges between carbon and nitrogen restricted conditions were converted to Z-scores, and likewise for the mRNA fold changes, as described previously. 39
Gene set analysis
Gene sets were generated from GO term annotation of the Yarrowia genome as provided by Blast2GO, 49 Ensembl, 53 InterPro 54 and UniProt. 55 A total of 29,513 GO terms were annotated to 5,232 genes. Gene set analysis was performed with the normalised RNAseq counts using Piano, 56 with the mean of the gene-level statistics, ignoring gene-sets smaller than 5 and larger than 500 genes, sampling 1,000 times and corrected for multiple testing using FDR.
Acknowledgments
The computations were performed on resources at Chalmers Centre for Computational Science and Engineering (C3SE) provided by the Swedish National Infrastructure for Computing (SNIC). Sequencing support was provided by the Science for Life Laboratory (SciLifeLab), National Genomics Infrastructure (NGI) and UPPMAX (UPPNEX project ID: b2014081). This work is supported by the US Department of Energy, Office of Science, Office of Biological and Environmental Research, Genomic Science program (DE-SC0008744) and the Novo Nordisk Foundation.
Footnotes
Supplementary Information accompanies the paper on the npj Systems Biology and Applications website (http://www.nature.com/npjsba)
The authors declare no conflict of interest.
References
- Dulermo, T. & Nicaud, J.-M. Involvement of the G3P shuttle and β-oxidation pathway in the control of TAG synthesis and lipid accumulation in Yarrowia lipolytica. Metab. Eng. 13, 482–491 (2011). [DOI] [PubMed] [Google Scholar]
- Zhou, Y. J. , Buijs, N. A. , Siewers, V. & Nielsen, J. Fatty Acid-Derived Biofuels and Chemicals Production in Saccharomyces cerevisiae. Front. Bioeng. Biotechnol. 2, 1–6 (2014). [DOI] [PMC free article] [PubMed] [Google Scholar]
- Tai, M. & Stephanopoulos, G. Engineering the push and pull of lipid biosynthesis in oleaginous yeast Yarrowia lipolytica for biofuel production. Metab. Eng. 15, 1–9 (2013). [DOI] [PubMed] [Google Scholar]
- Blazeck, J. et al. Harnessing Yarrowia lipolytica lipogenesis to create a platform for lipid and biofuel production. Nat. Commun. 5, 3131 (2014). [DOI] [PubMed] [Google Scholar]
- Seip, J. , Jackson, R. , He, H. , Zhu, Q. & Hong, S.-P. Snf1 is a regulator of lipid accumulation in Yarrowia lipolytica. Appl. Environ. Microbiol. 79, 7360–7370 (2013). [DOI] [PMC free article] [PubMed] [Google Scholar]
- Wang, Z.-P. , Xu, H.-M. , Wang, G.-Y. , Chi, Z. & Chi, Z.-M. Disruption of the MIG1 gene enhances lipid biosynthesis in the oleaginous yeast Yarrowia lipolytica ACA-DC 50109. Biochim. Biophys. Acta Mol. Cell Biol. Lipids 1831, 675–682 (2013). [DOI] [PubMed] [Google Scholar]
- Liu, L. et al. Surveying the lipogenesis landscape in Yarrowia lipolytica through understanding the function of a Mga2p regulatory protein mutant. Metab. Eng. 31, 102–111 (2015). [DOI] [PubMed] [Google Scholar]
- Kerkhoven, E. J. , Lahtvee, P.-J. & Nielsen, J. Applications of computational modeling in metabolic engineering of yeast. FEMS Yeast Res. 15, 1–13 (2015). [DOI] [PubMed] [Google Scholar]
- Jewett, M. C. et al. Mapping condition-dependent regulation of lipid metabolism in Saccharomyces cerevisiae. G3 3, 1979–1995 (2013). [DOI] [PMC free article] [PubMed] [Google Scholar]
- Pan, P. & Hua, Q. Reconstruction and in silico analysis of metabolic network for an oleaginous yeast, Yarrowia lipolytica. PLoS ONE 7, e51535 (2012). [DOI] [PMC free article] [PubMed] [Google Scholar]
- Loira, N. , Dulermo, T. , Nicaud, J.-M. & Sherman, D. J. A genome-scale metabolic model of the lipid-accumulating yeast Yarrowia lipolytica. BMC. Syst Biol. 6, 35 (2012). [DOI] [PMC free article] [PubMed] [Google Scholar]
- Kavšček, M. , Bhutada, G. , Madl, T. & Natter, K. Optimization of lipid production with a genome-scale model of Yarrowia lipolytica.. BMC Syst. Biol. 9, 72 (2015). [DOI] [PMC free article] [PubMed] [Google Scholar]
- Aung, H. W. , Henry, S. a. & Walker, L. P. Revising the representation of fatty acid, glycerolipid, and glycerophospholipid metabolism in the consensus model of yeast metabolism. Ind. Biotechnol. (New Rochelle NY) 9, 215–228 (2013). [DOI] [PMC free article] [PubMed] [Google Scholar]
- Chumnanpuen, P. , Nookaew, I. & Nielsen, J. Integrated analysis, transcriptome-lipidome, reveals the effects of INO-level (INO2 and INO4) on lipid metabolism in yeast. BMC Syst. Biol. 7 (Suppl 3): S7 (2013). [DOI] [PMC free article] [PubMed] [Google Scholar]
- Qiao, K. et al. Engineering lipid overproduction in the oleaginous yeast Yarrowia lipolytica. Metab. Eng. 29, 56–65 (2015). [DOI] [PubMed] [Google Scholar]
- Ruiz-Herrera, J. & Sentandreu, R. Different effectors of dimorphism in Yarrowia lipolytica. Arch. Microbiol. 178, 477–483 (2002). [DOI] [PubMed] [Google Scholar]
- Pérez-Campo, F. M. & Domínguez, A. Factors affecting the morphogenetic switch in Yarrowia lipolytica. Curr. Microbiol. 43, 429–433 (2001). [DOI] [PubMed] [Google Scholar]
- Szabo, R. Dimorphism in Yarrowia lipolytica: filament formation is suppressed by nitrogen starvation and inhibition of respiration. Folia Microbiol. (Praha) 44, 19–24 (1999). [DOI] [PubMed] [Google Scholar]
- Szabo, R. & Štofaníková, V. Presence of organic sources of nitrogen is critical for filament formation and pH-dependent morphogenesis in Yarrowia lipolytica. FEMS Microbiol. Lett. 206, 45–50 (2002). [DOI] [PubMed] [Google Scholar]
- Guevara-Olvera, L. , Calvo-Mendez, C. & Ruiz-Herrera, J. The role of polyamine metabolism in dimorphism of Yarrowia lipolytica. J. Gen. Microbiol. 139, 485–493 (1993). [DOI] [PubMed] [Google Scholar]
- Bellou, S. , Makri, A. , Triantaphyllidou, I. E. , Papanikolaou, S. & Aggelis, G. Morphological and metabolic shifts of Yarrowia lipolytica induced by alteration of the dissolved oxygen concentration in the growth environment. Microbiology 160 (Pt 4): 807–817 (2014). [DOI] [PubMed] [Google Scholar]
- Zinjarde, S. S. , Pant, A. & Deshpande, M. V. Dimorphic transition in Yarrowia lipolytica isolated from oil-polluted sea water. Mycol. Res. 102, 553–558 (1998). [Google Scholar]
- Hein, E.-M. & Hayen, H. Comparative lipidomic profiling of S. cerevisiae and Four other hemiascomycetous yeasts. Metabolites 2, 254–267 (2012). [DOI] [PMC free article] [PubMed] [Google Scholar]
- Athenstaedt, K. et al. Lipid particle composition of the yeast Yarrowia lipolytica depends on the carbon source. Proteomics 6, 1450–1459 (2006). [DOI] [PubMed] [Google Scholar]
- Beopoulos, A. et al. Control of Lipid Accumulation in the Yeast Yarrowia lipolytica. Appl. Environ. Microbiol. 74, 7779–7789 (2008). [DOI] [PMC free article] [PubMed] [Google Scholar]
- Czabany, T. et al. Structural and biochemical properties of lipid particles from the yeast Saccharomyces cerevisiae. J. Biol. Chem. 283, 17065–17074 (2008). [DOI] [PubMed] [Google Scholar]
- Vega, R. & Dominguez, A. Cell wall composition of the yeast and mycelial forms of Yarrowia lipolytica. Arch. Microbiol. 144, 124–130 (1986). [Google Scholar]
- Lavoie, H. , Hogues, H. & Whiteway, M. Rearrangements of the transcriptional regulatory networks of metabolic pathways in fungi. Curr. Opin. Microbiol. 12, 655–663 (2009). [DOI] [PMC free article] [PubMed] [Google Scholar]
- Maguire, S. L. et al. Zinc finger transcription factors displaced SREBP proteins as the major sterol regulators during saccharomycotina evolution. PLoS Genet. 10, e1004076 (2014). [DOI] [PMC free article] [PubMed] [Google Scholar]
- Zaman, S. , Lippman, S. I. , Zhao, X. & Broach, J. R. How Saccharomyces responds to nutrients. Annu. Rev. Genet. 42, 27–81 (2008). [DOI] [PubMed] [Google Scholar]
- Morin, N. et al. Transcriptomic analyses during the transition from biomass production to lipid accumulation in the oleaginous yeast Yarrowia lipolytica. PLoS ONE 6, e27966 (2011). [DOI] [PMC free article] [PubMed] [Google Scholar]
- Zhu, Z. et al. A multi-omic map of the lipid-producing yeast Rhodosporidium toruloides. Nat. Commun. 3, 1112 (2012). [DOI] [PMC free article] [PubMed] [Google Scholar]
- Cultrone, A. et al. Convergent evolution of hydroxylation mechanisms in the fungal kingdom: molybdenum cofactor-independent hydroxylation of xanthine via alpha-ketoglutarate-dependent dioxygenases. Mol. Microbiol. 57, 276–290 (2005). [DOI] [PubMed] [Google Scholar]
- Zhang, J. et al. Mapping the interaction of Snf1 with TORC1 in Saccharomyces cerevisiae. Mol. Syst. Biol. 7, 545 (2011). [DOI] [PMC free article] [PubMed] [Google Scholar]
- Shi, S. , Chen, Y. , Siewers, V. & Nielsen, J. Improving production of malonyl coenzyme A-derived metabolites by abolishing Snf1-dependent regulation of Acc1. Mbio. 5, e01130–14 (2014). [DOI] [PMC free article] [PubMed] [Google Scholar]
- Makri, A. , Fakas, S. & Aggelis, G. Metabolic activities of biotechnological interest in Yarrowia lipolytica grown on glycerol in repeated batch cultures. Bioresour. Technol. 101, 2351–2358 (2010). [DOI] [PubMed] [Google Scholar]
- Papanikolaou, S. et al. Biosynthesis of lipids and organic acids by Yarrowia lipolytica strains cultivated on glucose. Eur. J. Lipid Sci. Technol. 111, 1221–1232 (2009). [Google Scholar]
- Wang, H. J. et al. Evaluation of acyl coenzyme A oxidase (Aox) isozyme function in the N-alkane-assimilating yeast Yarrowia lipolytica. J. Bacteriol. 181, 5140–5148 (1999). [DOI] [PMC free article] [PubMed] [Google Scholar]
- Bordel, S. , Agren, R. & Nielsen, J. Sampling the solution space in genome-scale metabolic networks reveals transcriptional regulation in key enzymes. PLoS Comput. Biol. 6, e1000859 (2010). [DOI] [PMC free article] [PubMed] [Google Scholar]
- Bonfils, G. et al. Leucyl-tRNA Synthetase Controls TORC1 via the EGO Complex. Mol. Cell. 46, 105–110 (2012). [DOI] [PubMed] [Google Scholar]
- Evans, C. T. & Ratledge, C. Possible regulatory roles of ATP:citrate lyase, malic enzyme, and AMP deaminase in lipid accumulation by Rhodosporidium toruloides CBS 14. Can. J. Microbiol. 31, 1000–1005 (1985). [Google Scholar]
- Verduyn, C. , Postma, E. , Scheffers, W. A. & Van Dijken, J. P. Effect of benzoic acid on metabolic fluxes in yeasts: a continuous-culture study on the regulation of respiration and alcoholic fermentation. Yeast 8, 501–517 (1992). [DOI] [PubMed] [Google Scholar]
- Khoomrung, S. et al. Rapid Quantification of Yeast Lipid using Microwave-Assisted Total Lipid Extraction and HPLC-CAD. Anal. Chem. 85, 4912–4919 (2013). [DOI] [PubMed] [Google Scholar]
- Khoomrung, S. , Chumnanpuen, P. , Jansa-ard, S. , Nookaew, I. & Nielsen, J. Fast and accurate preparation fatty acid methyl esters by microwave-assisted derivatization in the yeast Saccharomyces cerevisiae. Appl. Microbiol. Biotechnol. 94, 1637–1646 (2012). [DOI] [PubMed] [Google Scholar]
- Langmead, B. , Trapnell, C. , Pop, M. & Salzberg, S. L. Ultrafast and memory-efficient alignment of short DNA sequences to the human genome. Genome Biol. 10, R25 (2009). [DOI] [PMC free article] [PubMed] [Google Scholar]
- Anders, S. , Pyl, P. T. & Huber, W. HTSeq--a Python framework to work with high-throughput sequencing data. Bioinformatics 31, 166–169 (2015). [DOI] [PMC free article] [PubMed] [Google Scholar]
- Law, C. W. , Chen, Y. , Shi, W. & Smyth, G. K. Voom: precision weights unlock linear model analysis tools for RNA-seq read counts. Genome Biol. 15, R29 (2014). [DOI] [PMC free article] [PubMed] [Google Scholar]
- Grabherr, M. G. et al. Full-length transcriptome assembly from RNA-Seq data without a reference genome. Nat. Biotechnol. 29, 644–652 (2011). [DOI] [PMC free article] [PubMed] [Google Scholar]
- Götz, S. et al. High-throughput functional annotation and data mining with the Blast2GO suite. Nucleic Acids Res. 36, 3420–3435 (2008). [DOI] [PMC free article] [PubMed] [Google Scholar]
- Dujon, B. et al. Genome evolution in yeasts. Nature 430, 35–44 (2004). [DOI] [PubMed] [Google Scholar]
- Kent, W. J. BLAT—the BLAST-like alignment tool. Genome Res. 12, 656–664 (2002). [DOI] [PMC free article] [PubMed] [Google Scholar]
- Agren, R. et al. The RAVEN toolbox and its use for generating a genome-scale metabolic model for penicillium chrysogenum. PLoS Comput. Biol. 9, e1002980 (2013). [DOI] [PMC free article] [PubMed] [Google Scholar]
- Cunningham, F. et al. Ensembl 2015. Nucleic Acids Res. 43 (D1): D662–D669 (2015). [DOI] [PMC free article] [PubMed] [Google Scholar]
- Mitchell, A. et al. The InterPro protein families database: the classification resource after 15 years. Nucleic Acids Res. 43 (D1): D213–D221 (2015). [DOI] [PMC free article] [PubMed] [Google Scholar]
- The Uniprot Consortium. UniProt: a hub for protein information. Nucleic Acids Res. 43 (D1): D204–D212 (2015). [DOI] [PMC free article] [PubMed] [Google Scholar]
- Väremo, L. , Nielsen, J. & Nookaew, I. Enriching the gene set analysis of genome-wide data by incorporating directionality of gene expression and combining statistical hypotheses and methods. Nucleic Acids Res. 41, 4378–4391 (2013). [DOI] [PMC free article] [PubMed] [Google Scholar]
Associated Data
This section collects any data citations, data availability statements, or supplementary materials included in this article.