

Abstract
Background
Previous research has shown that diet is associated with low-grade systemic inflammation among adults. However, no study has yet been conducted to explore the association between inflammatory potential of diet and low-grade systemic inflammation among adolescents whose dietary behavior may be different from adults.
Methods
We examine the predictive ability of 24-hour recall-derived dietary inflammatory index (DII) scores on inflammation among 532 European adolescents in the HELENA cross-sectional study. The DII is a literature-derived dietary index developed to predict inflammation. The DII was calculated per 1000 calories and was tested against C-reactive protein (CRP), interleukins (IL)-1,2,4, 10, TNF-α, ICAM, VCAM and IFN-γ. All inflammatory markers had non-normal distributions and therefore were log transformed. Analyses were performed using multivariable linear regression, adjusting for age, sex, city, BMI, smoking and physical activity.
Results
Pro-inflammatory diet (higher DII scores) was associated with increased levels of various inflammatory markers: TNF-α, IL-1, 2, IFN-γ and VCAM (bDIIt3vs1= 0.13, 95% CI: 0.001, 0.25; 0.13, 95% CI 0.001, 0.25; 0.40, 95% CI: 0.03, 0.77; 0.53, 95% CI: 0.05, 1.01; 0.07, 95% CI: 0.01, 0.13 respectively).
Conclusion
These results reinforce the fact that diet, as a whole, plays an important role in modifying inflammation in adolescents.
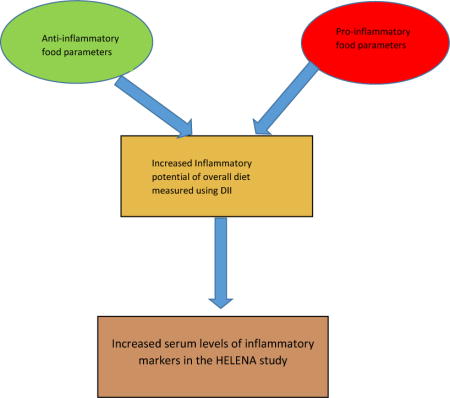
Graphical Abstract
Previous research has shown that diet is associated with low-grade systemic inflammation among adults. However, no study has yet been conducted to explore the association between inflammatory potential of diet and low-grade systemic inflammation among adolescents whose dietary behavior may be different from adults. A pro-inflammatory diet as evidenced by higher DII scores is associated with increased levels of various inflammatory markers in the HEalthy Lifestyle in Europe by Nutrition in Adolescents (HELENA) cross-sectional study.
Introduction
Inflammation is body’s natural response to dealing with injury or infection in order to heal wounds and promote tissue regeneration (1–4). A chronic, low-grade inflammatory state results when normal negative feedback on acute inflammation does not occur (4). Chronic inflammation has been shown to be associated with cancer (5, 6) and cardiovascular diseases (7–10) such as coronary heart disease (11), myocardial infarction (10) and ischemic stroke (12, 13). Major inflammatory markers that are implicated in these chronic diseases are interleukins (10, 14), tumor necrosis factor (TNF)-α (15), C-reactive protein (11) and vascular cell adhesion molecule (VCAM)-1 (16).
Dietary patterns and components have been shown to have an effect on inflammation. The Mediterranean dietary pattern, which is high in fruits, vegetables, olive oil, whole grains, and fish, and low in red meat and butter, with moderate alcohol and olive oil intake, has been associated with lower levels of inflammation (17). By contrast, the Western-type diet, which is high in red meat, high-fat dairy products, and refined grains, has been associated with higher levels of CRP, IL-6 and fibrinogen (18, 19). Specific nutrients also have consistently been associated with lower levels of inflammation. These include complex carbohydrates (20), n-3 poly-unsaturated fatty acids (PUFA) (21), fiber (22), vitamin E (23), vitamin C (24), β-carotene (25), and magnesium (26).
The dietary inflammatory index (DII) was developed by researchers at University of South Carolina to estimate the overall inflammatory potential of the diet (27, 28). The DII is based upon an extensive literature search incorporating cell culture, animal, and epidemiologic studies of the effect of diet on inflammation. The DII has been previously shown to be associated with inflammation; specifically CRP, IL-6, TNF-α levels among adults (29–31). To the best of our knowledge no work has yet been conducted on the DII and inflammation among adolescents. Unhealthy eating often starts during childhood or adolescence, and progresses throughout life (32, 33), contributing to the onset of chronic diseases in adulthood. Diet in adolescents is very important and plays a major role in the incidence of various chronic diseases in later life, such as hypertension and cancer (32, 34). Using the data derived from the HELENA (HEalthy Lifestyle in Europe by Nutrition in Adolescents) study, we aim to test the hypothesis that higher DII scores, indicating a more pro-inflammatory diet, are associated with increased systemic inflammation, as shown by increased levels of plasma inflammatory markers among healthy European adolescents.
Methods
Study design and sample
The HELENA-cross-sectional study was conducted between 2006 and 2007 in ten European Cities [Athens and Heraklion (Greece), Dortmund (Germany), Ghent (Belgium), Lille (France), Pecs (Hungary), Rome (Italy), Stockholm (Sweden), Vienna (Austria) and Zaragoza (Spain)]. Detailed information about the study has been reported elsewhere (35). The main objective of HELENA-CSS was to obtain reliable data using uniform collection procedures on a variety of nutritional and health-related parameters in a representative sample of 3528 European adolescents (boys and girls aged 12.5–17.5 years) (36). The ethical committee of each centre approved the study and signed informed consent was obtained from the adolescents as well as from their parents or guardians (37).
For the present analysis, data on nutritional intake from Heraklion and Pecs (n 678) could not be included because of incomplete data. Furthermore, specific inclusion criteria (complete energy and nutrient intake data on two days obtained by the HELENA-DIAT 24-hour recall (24HR) and data on anthropometry) were defined for the present analysis, which were fulfilled by 1804 adolescents. By design, with the same criteria regarding representativeness, blood was collected in only a randomly selected subset of HELENA participants.
For this study, only data on diet, plasma inflammatory markers and covariates were used to perform cross-sectional analysis. Participants with a recent fever episode or acute disease were excluded for the blood sample collection. Other participants were excluded who did not have complete dietary data, did not have data on any of the inflammatory markers, had undetectable values of inflammatory markers (values <0.12 pg/ml). After exclusion for these covariates, there were 532 subjects with evaluable data. Data on demographic characteristics were obtained through a self-administered questionnaire.
2.5. Inflammatory markers
Blood samples were collected in the early morning after overnight fasting. In all cases, 30 ml of blood was extracted by venipuncture from the antecubital vein by a qualified nurse. The stability of samples during transport and storage in the HELENA study has been reported previously (38). Nine key biomarkers involved in low-grade, systemic inflammation were selected for this study (CRP, TNF-α, IL-6, 1,2,4,10, IFN-γ, sICAM and sVCAM. CRP was measured in serum by immunoturbidimetry (AU2700 biochemistry analyzer; Olympus, Watford, UK). Serum cytokines IL-6, 1, 2, 4, 10 and TNF-α were determined using the High Sensitivity Human Cytokine MILLIPLEXTM MAP kit (Millipore Corp., Billerica, MA, USA) and collected by flow cytometry (Luminex-100 v.2.3, Luminex Corporation, Austin, TX, USA). The intra- and inter-assay precision CVs were: 3.5% and 4.5%, respectively, for IL-6; and 3.5% and 3.8%, respectively, for TNF-α.
Dietary Intake (39) and Dietary Inflammatory Index (DII) (27, 28)
Dietary intake data were obtained using a self-administered, computerized 24HR, named HELENA-DIAT, which was based on the Young Adolescents’ Nutrition Assessment on Computer (YANA-C) (40, 41), a tool validated in Flemish adolescents. The basic version was improved by adding dishes representative of cultural/culinary differences observed in European nations participating in HELENA (42). The collection of dietary data is organized in six meal occasions, i.e. breakfast, morning snack, lunch, afternoon snack, evening meal and evening snack. The participants can select from about 400 predefined food items and are free to add non-listed foods manually. Special techniques are used to allow a detailed description and quantification of foods; e.g., pictures of portion sizes and dishes. Amounts eaten could be reported as grams or using common household measures. After a short introduction by a trained researcher, the adolescents completed the HELENA-DIAT 24-HR during school time while a research staff member was present in the classroom to assist the adolescents if necessary. They completed the HELENA-DIAT twice on non-consecutive days within a time span of 2 weeks, to achieve information closer to habitual food intake than assessing food intake on consecutive days. The two 24HR thus comprised weekdays and weekend days, but not necessarily a weekday and weekend day for each individual. To calculate energy and nutrient intake, data from the HELENA-DIAT were linked to the German Food Code and Nutrient Database BLS (Bundeslebensmittelschlu¨ssel) version II.3.1, 2005) (43). For this purpose, culture-specific composite dishes were disaggregated into their basic food components, all of which were available in the German database (44). Two 24HR were collected in order to allow corrections for within-person variability. The multiple source method (MSM) (45–47), a statistical modelling technique, was used to estimate the usual dietary intake of nutrients and foods.
24HR-derived dietary information was used to calculate DII scores for all subjects, as described in detail elsewhere (27, 28). Briefly, the dietary data for each study participant were first linked to the regionally representative global database that provided a robust estimate of a mean and standard deviation for each of the food parameters (i.e., foods, nutrients, and other food components such as flavonoids) considered (27). A z-score was derived by subtracting the “standard global mean” from the amount reported and then dividing this value by the standard deviation. To minimize the effect of “right skewing” (a common occurrence with dietary data), this value was then converted to a centered percentile score, which was then multiplied by the respective food parameter inflammatory effect score (derived from a literature review and scoring of 1943 “qualified” articles) to obtain the subject’s food parameter-specific DII score. All of the food parameter-specific DII scores were then summed to create the overall DII score for every subject in the study. For the current study, data were available for a total of 25 nutrients (carbohydrate, protein, total fat, alcohol, fibre, cholesterol, saturated fat, mono unsaturated fat, poly unsaturated fat, omega-3, omega-6 fatty acid, niacin, thiamin, riboflavin, vitamin B12, vitamin B6, iron, magnesium, zinc, vitamin A, vitamin C, vitamin D, vitamin E, folic acid and betacarotene). A description of validation work of the DII score, based on both dietary recalls and the 7-day dietary record, a structured questionnaire similar in terms of its layout to an FFQ, is available elsewhere (48). The details of the steps are described in figure 1.
Figure 1.
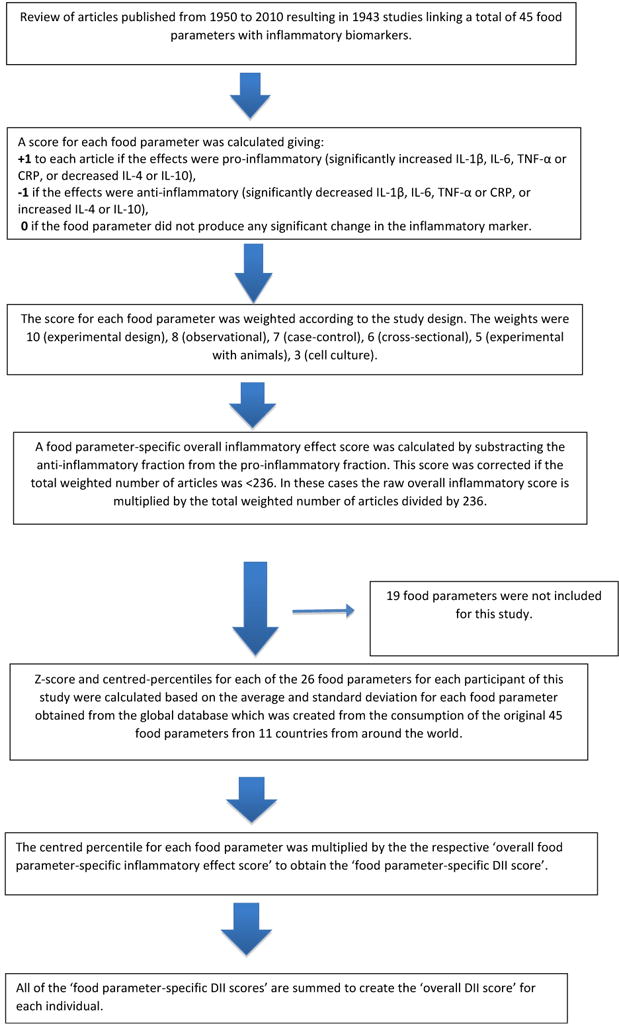
Sequence of steps in creating the dietary inflammatory index in the HELENA study
Anthropometry, physical activity and smoking
Anthropometric measurements were performed by trained staff using a standard protocol (49), with the adolescents standing barefoot and in underwear. Weight was measured with an electronic scale to the nearest 0.1 kg, and height was measured with a telescopic stadiometer to the nearest 0.1 cm. BMI was calculated from height and weight (kg/m2).
Patterns of physical activity (PA) also were self-reported using the International Physical Activity Questionnaire for Adolescents (IPAQ-A) (50). The IPAQ-A, covers the following four domains of PA: (i) school-related PA, including activity during physical education and recess; (ii) transportation; (iii) housework; and (iv) extracurricular PA. In each of the domains, the number of days per week and the time periods each day spent walking, in moderate PA and in vigorous PA, were recorded. The data were cleaned and truncated following the guidelines provided by the IPAQ group (www.ipaq.ki.se) (50). Consequently, variables obtained by the IPAQ-A for this study were added to obtain overall PA (moderate to vigorous + walking intensities in minutes/day). BMI was categorised in BMI-categories using the age-sex specific cut-offs from Cole et al (51, 52). Physical activity is measured in activities in minutes per day using the IPAQ questionnaire. Smoking history was assessed with the ever smoked (yes/no).
Statistical analysis
CRP, TNF-α, IL-6, 1, 2,4,10, INF-γ, ICAM and VCAM were log transformed as they were not normally distributed. DII was analysed as both a continuous and categorical (tertiles) variable. All statistical analysis was carried out using SAS® statistical software package version 9.3 (SAS Institute Inc., Cary, NC, USA). Comparisons of characteristics and food groups by tertiles of DII were made using χ2 tests for categorical variables and ANOVA for continuous variables. Multivariable linear analyses were carried out adjusting for age, sex, city, BMI, smoking and physical activity. In the analysis of categorized DII, a test for linear trend was conducted by including the median value for each DII tertile as a continuous term in the regression model, this approach has been used in several previous studies on diet and health outcomes (53, 54). We have alsoa adjusted for multiple testin by dividing the α value (0.05) by the number of inflammatory markers i,e 10, to get the new alpha value of 0.005. Additionally, sensitivity analyses were performed including cytokines with imputed values for interleukins, TNF and INF-γ.
Results
Table 1 shows the characteristics of the participants across tertiles of DII. Adolescents in tertile 3 were older, more likely to be males and to have history of ever smoked cigarettes. Table 2 and Figure 2 shows the results for food groups. Adolescents in the most pro-inflammatory group had higher consumption of bread and rolls, chocolate, margarine, butter and animal fats, and vegetable lipids, carbonated/soft/isotonic drinks, meat and cakes, pies, biscuits and sugar/honey/jam; and had lower consumption of vegetables (excluding potatoes), fruits, fruits and vegetable juices, and fish.
Table 1.
Distribution of selected characteristics across tertiles of Dietary Inflammatory Index (DII)a,b,c, HELENA Study, 2006–7.
| Characteristics | Tertile 1 | Tertile 2 | Tertile 3 | P-value |
|---|---|---|---|---|
| Age (years) (mean±sd) | 14.7±1.12 | 14.7±1.2 | 15.0±1.2 | 0.005 |
| BMI (kg/m2) (mean±sd) | 21.1±3.8 | 20.9±3.1 | 20.8±3.3 | 0.44 |
| Total physical activity (minutes/week) (mean±sd) | 1379.3±1274.1 | 1215.4±1055.9 | 1277.1±1204.4 | 0.41 |
| Sex, n (%) | <0.0001 | |||
| Smoking | 0.006 | |||
| No | 122 (69.7) | 105 (59.0) | 91 (50.8) | |
| Yes | 51 (29.1) | 69 (38.8) | 86 (48.0) |
ANOVA and Chi-square statistics were used to test the difference across the tertiles.
Higher DII scores indicate a pro-inflammatory diet.
Table 2.
Distribution of consumption of food groups across tertiles of DIIa, HELENA Study, 2006–7.
| Food groups (g/day) | Tertile 1 | Tertile 2 | Tertile 3 | P-Value |
|---|---|---|---|---|
| Bread and rolls | 89.6±83.0 | 108.2±90.4 | 127.2±124.8 | 0.0005 |
| Chocolate | 15.7±30.6 | 34.2±70.4 | 34.6±75.6 | 0.004 |
| Margarine and other plant-based lipids | 1.6±6.3 | 5.3±18.3 | 5.1±15.8 | 0.02 |
| Vegetable oil | 6.5±18.3 | 4.0±10.2 | 4.5±14.1 | 0.19 |
| Butter and other animal fats | 3.8±8.5 | 6.6±15.2 | 8.5±18.8 | 0.003 |
| Vegetables, excluding potatoes | 140.1±151.2 | 69.9±113.7 | 56.4±80.1 | <0.0001 |
| Fruits | 184.8±187.6 | 113.5±169.3 | 72.9±140.8 | <0.0001 |
| Soups, bullion | 38.1±111.2 | 32.9±125.0 | 21.1±84.7 | 0.14 |
| Fruit and vegetable juices | 147.4±240.6 | 139.4±272.4 | 100.0±164.8 | 0.05 |
| Carbonated/soft/isotonic drinks | 149.3±317.1 | 261.6±382.2 | 486.4±637.7 | <0.0001 |
| Meat | 114.9±131.3 | 151.0±154.1 | 185.9±229.5 | 0.0002 |
| Fish | 31.0±97.1 | 21.9±65.7 | 16.2±46.7 | 0.05 |
| Cakes, pies, biscuits | 35.7±61.5 | 40.9±67.8 | 64.5±114.0 | 0.001 |
| Sugar, honey, jam and syrup | 5.4±16.7 | 7.7±22.9 | 15.5±44.3 | 0.002 |
| Cereals | 11.9±23.4 | 11.6±26.6 | 14.8±41.3 | 0.37 |
ANOVA was used to test the difference across the tertiles.
Figure 2.
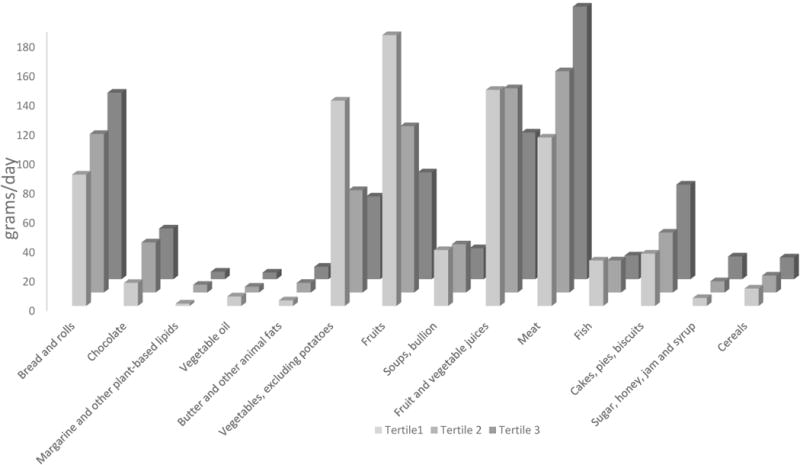
Distribution of food groups across tertiles of DII.
Analysis of inflammatory markers
Analyses adjusting for covariates showed positive associations between DII and TNF-α, IL-1, IL-2, IFN-γ (bDIIt3vs1= 0.13, 95% CI: 0.001, 0.25; 0.13, 95% CI 0.001, 0.25; 0.40, 95% CI: 0.03, 0.77; 0.53, 95% CI: 0.05, 1.01, respectively) and with sVCAM (bDIIcontinuous= 0.03, 95% CI: 0.01, 0.04) while no significant trend across tertiles of DII were observed for IL-1 and INF-γ with alpha value of 0.005 except for sVCAM (Pvalue=<0.001) (Table 3). No significant association was observed with other inflammatory markers (CRP, IL-4, 6, 10 and ICAM). Results for senstivity analyses with imputed values are shown in supplementary table 1, there were no major changes in the β estimates for any of the cytokines.
Table 3.
Beta estimates and confidence interval for the association between DII and inflammation in the HELENA Study, 2006–7.
| Beta Estimates and confidence interval for inflammatory markersa | ||||||
|---|---|---|---|---|---|---|
| DII | DII (continuous) | P-valuec | Tertile 1 | Tertile 2 | Tertile 3 | P-trend b,c |
| CRP mg/l | 0.04 (−0.04, 0.11) | 0.32 | Ref | 0.18 (−0.08, 0.44) | 0.09 (−0.18, 0.36) | 0.41 |
| TNF-α pg/ml | 0.04 (0.002, 0.07) | 0.03 | Ref | −0.01 (−0.13, 0.11) | 0.13 (0.007, 0.26) | 0.06 |
| IL-6 pg/ml | 0.04 (−0.04, 0.13) | 0.31 | Ref | −0.05 (−0.35, 0.25) | 0.09 (−0.22,0.40) | 0.66 |
| IL-1 pg/ml | 0.07 (−0.005, 0.15) | 0.06 | Ref | 0.11 (−0.16, 0.38) | 0.30 (0.02, 0.58) | 0.04 |
| IL-2 pg/ml | 0.10 (−0.01, 0.20) | 0.05 | Ref | −0.14 (−0.50, 0.22) | 0.42 (0.04, 0.79) | 0.08 |
| IL-4 pg/ml | 0.08 (−0.04, 0.20) | 0.20 | Ref | −0.05 (−0.45, 0.35) | 0.17 (−0.25, 0.59) | 0.19 |
| IL-10 pg/ml | 0.01 (−0.06, 0.08) | 0.69 | Ref | −0.12 (−0.38,0.13) | 0.09 (−0.17,0.35) | 0.75 |
| INF-γ pg/ml | 0.13 (−0.007, 0.27) | 0.04 | Ref | 0.25 (−0.22, 0.72) | 0.58 (0.09, 1.06) | 0.03 |
| ICAM ng/ml | 0.01 (−0.01, 0.04) | 0.23 | Ref | −0.04 (−0.13, 0.05) | 0.02 (−0.08, 0.11) | 0.27 |
| VCAM ng/ml | 0.03 (0.01, 0.04) | <0.001 | Ref | 0.03 (−0.03, 0.08) | 0.07 (0.01, 0.13) | 0.07 |
Adjusted for age, sex, body mass index (BMI)-categories, city, smoking and physical activity.
P-trend determined through the median approach
P-value <0.005 were deemed significant after Bonferroni approach.
Discussion
This is the first study to examine the association between inflammatory potential of diet, as measured by DII scores, and levels of inflammation among adolescents. The results revealed a positive association between DII and TNF-α, IL-1, 2, INF-γ, and sVCAM. Even though the test for linear trend was not significant, these findings reinforce the idea that a diet rich in pro-inflammatory food parameters (sweets, butter and other animal fats, cholesterol, saturated fat), and relatively poor in anti-inflammatory food parameters (vegetables and fruits) may increase inflammation among adolescents. Although we did not observe significant results with CRP, IL-4, 6, 10 and ICAM, the association with these markers was in the expected direction. Also, it should be noted that crp values did not use the high-sensitivity procedure, which we had previously found to be associated with DII scores (48). It is important to note that this is the first study to examine this association among adolescents, the validation potential of DII among adolescents may be limited due to the low inflammation grade in this young population group. Longitudinal studies should investigate the effect of high DII scores on future health outcomes including morbidity and mortality.
Overall, our study results are consistent with the hypothesis that diet modulates inflammation. The inference is that through this process of modulating inflammation there is an effect on chronic diseases such as several cancers and cardiovascular diseases. Food items that tended to increase DII scores include butter, other animal fats, and chocolate. Higher scores also could result from low consumption of food items considered to be anti-inflammatory such as fruits, vegetables and juices. There is considerable evidence that adequate and healthy nutrition in children and adolescents is associated with a lower risk of youth (55, 56) and adult obesity (57) as well as of subsequent nutrition-related morbidities in adulthood such as cardiovascular diseases (58), several types of cancers (59, 60) and type 2 diabetes (61). Adherence to an anti-inflammatory dietary pattern such as the Mediterranean diet has been shown to reduce the risk of cardiovascular and cerebrovascular diseases (62, 63). All of these chronic health conditions are related to chronic inflammation (64–66).
Thus far, there has been no report from the HELENA study looking at dietary components and inflammation. In a published report from the National Health and Nutrition Examination Survey (NHANES) – 2003–2006, consuming healthy diet was associated with lower CRP levels; however, no association was observed in children (67). Another report from NHANES-1999–02, showed that children and adolescents with higher CRP levels had significantly lower intakes of grains and vegetables (68).
Some limitations of the study need to be mentioned. First, the 24HR used in the HELENA Study is unusual in that it uses a list of foods. In a previous validation study it has been shown to be prone to under-reporting (42, 69). However, the exclusion of misreporters also might induce selection bias because the misreporters might have differential food choices or eating behaviors as previously reported by Bel-Serrat et al. (69). Second, it also should be noted that the cross-sectional nature of the study precluded inferences related to temporality of effects. Another limitation could be the non-availability of data on other potential confounders such as the use of aspirin and other anti-inflammatory medications, all of which could have played a role in modifying this association.
Another limitation is the fact that all of the 24HR were completed during school days (focusing on the dietary intake of the previous day); thus they did not include information about the adolescents’ diet on Saturdays or on some holidays (i.e., those not followed by a school day). Fourth, in this current study the DII was calculated using data on only 25 nutrients and food components derived from 24HR. In the DII validation study (48), sensitivity analysis was conducted comparing DII calculated from multiple (up to 15/person) 24HR (which provided data on 44 nutrients and food components) with DII calculated from 7-day dietary recalls (which provided data on 28 nutrients and food components). We found that the association with CRP was not attenuated when using the more limited list available with the 7-day dietary recalls (48). Still, the attenuation in the food parameter list could explain the absence of an association between DII and inflammatory markers in this study. However, despite the large reduction in the number of parameters, we still were able to successfully observe associations with some of the inflammatory markers.
In addition to its large sample size, one of the major strengths of the present study is the geographical spread over eight European cities. The sample consists of adolescents assessed using highly standardized and validated procedures; for example, all countries used the same 24HR (HELENA-DIAT) and the same food composition database (BLS). Also, the large number of inflammation markers measured in serum and analysed centrally in the same laboratory and the huge battery of lifestyle and anthropometric variables assessed according to standardized procedures is an important advantage of this study as it allows adjustment for several possible confounding factors. Another strength is the use of the dietary data from multiple countries taking into account both between- and within-individual variability of dietary intake data. Moreover, the current study is one of the first to examine overall effect of dietary intake on inflammation and not just specific nutrients among adolescents at a pan-European level.
Conclusion
Results from this study suggest that eating a diet high in food components such as sugar and saturated fat leads to a pro-inflammatory state, which may increase the risk of a range of chronic diseases throughout life. These results will have to be replicated in other studies.
Supplementary Material
Acknowledgments
The authors are thankful to the HELENA study staff for assistance in data preparation. The authors want to acknowledge all the participants from the HELENA study who voluntarily contributed to this study. The content of this paper reflects only the authors’ views and the rest of HELENA-study members and the European Community is not liable for any use that may be made of the information contained therein.
Financial Support: This work was performed as part of the HELENA study. We gratefully acknowledge the financial support of the European Community sixth RTD Framework Programme (contact FOOD-CT-2005-007034). Drs. Shivappa, Hébert, were supported by the United States National Institute for Diabetes, Digestive and Kidney Diseases (grant no. R44DK103377). This research received no specific grant from any funding agency, commercial or not-for-profit sectors. EC and NCI had no role in the design, analysis or writing of this article.
Footnotes
Conflict of interest: All authors declare no conflict of interest.
Disclosure: Dr. James R. Hébert owns controlling interest in Connecting Health Innovations LLC (CHI), a company planning to license the right to his invention of the dietary inflammatory index (DII) from the University of South Carolina in order to develop computer and smart phone applications for patient counselling and dietary intervention in clinical settings. Dr. Nitin Shivappa is an employee of CHI. None of the other authors declare any conflicts of interest.
References
- 1.Keibel A, Singh V, Sharma MC. Inflammation, microenvironment, and the immune system in cancer progression. Curr Pharm Des. 2009;15(17):1949–55. doi: 10.2174/138161209788453167. [DOI] [PubMed] [Google Scholar]
- 2.Pan MH, Lai CS, Dushenkov S, Ho CT. Modulation of inflammatory genes by natural dietary bioactive compounds. J Agric Food Chem. 2009 Jun 10;57(11):4467–77. doi: 10.1021/jf900612n. [DOI] [PubMed] [Google Scholar]
- 3.Thun MJ, Henley SJ, Gansler T. Inflammation and cancer: an epidemiological perspective. Novartis Found Symp. 2004;256:6–21. discussion 2–8, 49–52, 266–9. [PubMed] [Google Scholar]
- 4.Warnberg J, Gomez-Martinez S, Romeo J, Diaz LE, Marcos A. Nutrition, inflammation, and cognitive function. Ann N Y Acad Sci. 2009 Feb;1153:164–75. doi: 10.1111/j.1749-6632.2008.03985.x. [DOI] [PubMed] [Google Scholar]
- 5.Terzić J, Grivennikov S, Karin E, Karin M. Inflammation and Colon Cancer. Gastroenterology. 2010;138(6):2101–14.e5. doi: 10.1053/j.gastro.2010.01.058. [DOI] [PubMed] [Google Scholar]
- 6.Elinav E, Nowarski R, Thaiss CA, Hu B, Jin C, Flavell RA. Inflammation-induced cancer: crosstalk between tumours, immune cells and microorganisms. Nat Rev Cancer. 2013 Nov;13(11):759–71. doi: 10.1038/nrc3611. [DOI] [PubMed] [Google Scholar]
- 7.Pearson TA, Mensah GA, Alexander RW, Anderson JL, Cannon RO, 3rd, Criqui M, et al. Markers of inflammation and cardiovascular disease: application to clinical and public health practice: A statement for healthcare professionals from the Centers for Disease Control and Prevention and the American Heart Association. Circulation. 2003 Jan 28;107(3):499–511. doi: 10.1161/01.cir.0000052939.59093.45. [DOI] [PubMed] [Google Scholar]
- 8.Ridker PM, Rifai N, Rose L, Buring JE, Cook NR. Comparison of C-Reactive Protein and Low-Density Lipoprotein Cholesterol Levels in the Prediction of First Cardiovascular Events. New England Journal of Medicine. 2002;347(20):1557–65. doi: 10.1056/NEJMoa021993. [DOI] [PubMed] [Google Scholar]
- 9.Blake GJ, Ridker PM. Inflammatory bio-markers and cardiovascular risk prediction. J Intern Med. 2002 Oct;252(4):283–94. doi: 10.1046/j.1365-2796.2002.01019.x. Epub 2002/10/09. eng. [DOI] [PubMed] [Google Scholar]
- 10.Ridker PM, Rifai N, Stampfer MJ, Hennekens CH. Plasma Concentration of Interleukin-6 and the Risk of Future Myocardial Infarction Among Apparently Healthy Men. Circulation 2000. 2000 Apr 18;101(15):1767–72. doi: 10.1161/01.cir.101.15.1767. [DOI] [PubMed] [Google Scholar]
- 11.Danesh J, Collins R, Appleby P, Peto R. Association of fibrinogen, c-reactive protein, albumin, or leukocyte count with coronary heart disease: Meta-analyses of prospective studies. JAMA. 1998;279(18):1477–82. doi: 10.1001/jama.279.18.1477. [DOI] [PubMed] [Google Scholar]
- 12.Tuttolomondo A, Pecoraro R, Pinto A. Studies of selective TNF inhibitors in the treatment of brain injury from stroke and trauma: a review of the evidence to date. Drug Des Dev Ther. 2014;8:2221–39. doi: 10.2147/DDDT.S67655. [DOI] [PMC free article] [PubMed] [Google Scholar]
- 13.Tuttolomondo A, Pecoraro R, Di Raimondo D, Di Sciacca R, Canino B, Arnao V, et al. Immune-inflammatory markers and arterial stiffness indexes in subjects with acute ischemic stroke with and without metabolic syndrome. Diabetol Metab Syndr. 2014 Feb 27;6 doi: 10.1186/1758-5996-6-28. [DOI] [PMC free article] [PubMed] [Google Scholar]
- 14.Ridker PM. From C-Reactive Protein to Interleukin-6 to Interleukin-1: Moving Upstream To Identify Novel Targets for Atheroprotection. Circulation research. 2016 Jan 8;118(1):145–56. doi: 10.1161/CIRCRESAHA.115.306656. [DOI] [PMC free article] [PubMed] [Google Scholar]
- 15.Blaser H, Dostert C, Mak TW, Brenner D. TNF and ROS Crosstalk in Inflammation. Trends in cell biology. 2016 Jan 11; doi: 10.1016/j.tcb.2015.12.002. [DOI] [PubMed] [Google Scholar]
- 16.Cook-Mills JM, Marchese ME, Abdala-Valencia H. Vascular cell adhesion molecule-1 expression and signaling during disease: regulation by reactive oxygen species and antioxidants. Antioxidants & redox signaling. 2011 Sep 15;15(6):1607–38. doi: 10.1089/ars.2010.3522. [DOI] [PMC free article] [PubMed] [Google Scholar]
- 17.Estruch R, Martinez-Gonzalez MA, Corella D, Salas-Salvado J, Ruiz-Gutierrez V, Covas MI, et al. Effects of a Mediterranean-style diet on cardiovascular risk factors: a randomized trial. Ann Intern Med. 2006 Jul 4;145(1):1–11. doi: 10.7326/0003-4819-145-1-200607040-00004. [DOI] [PubMed] [Google Scholar]
- 18.Johansson-Persson A, Ulmius M, Cloetens L, Karhu T, Herzig KH, Onning G. A high intake of dietary fiber influences C-reactive protein and fibrinogen, but not glucose and lipid metabolism, in mildly hypercholesterolemic subjects. Eur J Nutr. 2013 Feb 7;7:7. doi: 10.1007/s00394-013-0496-8. [DOI] [PubMed] [Google Scholar]
- 19.King DE, Egan BM, Geesey ME. Relation of dietary fat and fiber to elevation of C-reactive protein.[erratum appears in Am J Cardiol. 2004 Mar 15; 93(6):812] American Journal of Cardiology. 2003 Dec 1;92(11):1335–9. doi: 10.1016/j.amjcard.2003.08.020. [DOI] [PubMed] [Google Scholar]
- 20.Kitabchi AE, McDaniel KA, Wan JY, Tylavsky FA, Jacovino CA, Sands CW, et al. Effects of High-Protein Versus High-Carbohydrate Diets on Markers of beta-Cell Function, Oxidative Stress, Lipid Peroxidation, Proinflammatory Cytokines, and Adipokines in Obese, Premenopausal Women Without Diabetes: A randomized controlled trial. Diabetes Care. 2013 Jul;36(7):1919–25. doi: 10.2337/dc12-1912. [DOI] [PMC free article] [PubMed] [Google Scholar]
- 21.Ferrucci L, Cherubini A, Bandinelli S, Bartali B, Corsi A, Lauretani F, et al. Relationship of plasma polyunsaturated fatty acids to circulating inflammatory markers.[see comment] Journal of Clinical Endocrinology & Metabolism. 2006 Feb;91(2):439–46. doi: 10.1210/jc.2005-1303. [DOI] [PubMed] [Google Scholar]
- 22.Ma Y, Griffith JA, Chasan-Taber L, Olendzki BC, Jackson E, Stanek EJ, 3rd, et al. Association between dietary fiber and serum C-reactive protein. American Journal of Clinical Nutrition. 2006 Apr;83(4):760–6. doi: 10.1093/ajcn/83.4.760. [DOI] [PMC free article] [PubMed] [Google Scholar]
- 23.Bertran N, Camps J, Fernandez-Ballart J, Arija V, Ferre N, Tous M, et al. Diet and lifestyle are associated with serum C-reactive protein concentrations in a population-based study. J Lab Clin Med. 2005 Jan;145(1):41–6. doi: 10.1016/j.lab.2004.11.002. [DOI] [PubMed] [Google Scholar]
- 24.Wannamethee SG, Lowe GD, Rumley A, Bruckdorfer KR, Whincup PH. Associations of vitamin C status, fruit and vegetable intakes, and markers of inflammation and hemostasis. Am J Clin Nutr. 2006 Mar;83(3):567–74. doi: 10.1093/ajcn.83.3.567. quiz 726–7. [DOI] [PubMed] [Google Scholar]
- 25.Erlinger TP, Guallar E, Miller ER, 3rd, Stolzenberg-Solomon R, Appel LJ. Relationship between systemic markers of inflammation and serum beta-carotene levels. Arch Intern Med. 2001 Aug 13–27;161(15):1903–8. doi: 10.1001/archinte.161.15.1903. [DOI] [PubMed] [Google Scholar]
- 26.King DE, Mainous AG, 3rd, Geesey ME, Woolson RF. Dietary magnesium and C-reactive protein levels. Journal of the American College of Nutrition. 2005 Jun;24(3):166–71. doi: 10.1080/07315724.2005.10719461. [DOI] [PubMed] [Google Scholar]
- 27.Shivappa N, Steck SE, Hurley TG, Hussey JR, Hebert JR. Designing and developing a literature-derived, population-based dietary inflammatory index. Public Health Nutr. 2013 Aug 14;14:1–8. doi: 10.1017/S1368980013002115. [DOI] [PMC free article] [PubMed] [Google Scholar]
- 28.Cavicchia PP, Steck SE, Hurley TG, Hussey JR, Ma Y, Ockene IS, et al. A new dietary inflammatory index predicts interval changes in high-sensitivity c-reactive protein. J Nutr. 2009;139(12):2365–72. doi: 10.3945/jn.109.114025. [DOI] [PMC free article] [PubMed] [Google Scholar]
- 29.Shivappa N, Hebert JR, Rietzschel ER, De Buyzere ML, Langlois M, Debruyne E, et al. Associations between dietary inflammatory index and inflammatory markers in the Asklepios Study. The British journal of nutrition. 2015 Feb 28;113(4):665–71. doi: 10.1017/S000711451400395X. [DOI] [PMC free article] [PubMed] [Google Scholar]
- 30.Tabung FK, Steck SE, Zhang J, Ma Y, Liese AD, Agalliu I, et al. Construct validation of the dietary inflammatory index among postmenopausal women. Annals of epidemiology. 2015 Jun;25(6):398–405. doi: 10.1016/j.annepidem.2015.03.009. [DOI] [PMC free article] [PubMed] [Google Scholar]
- 31.Wirth MD, Burch J, Shivappa N, Violanti JM, Burchfiel CM, Fekedulegn D, et al. Association of a dietary inflammatory index with inflammatory indices and metabolic syndrome among police officers. Journal of occupational and environmental medicine/American College of Occupational and Environmental Medicine. 2014 Sep;56(9):986–9. doi: 10.1097/JOM.0000000000000213. [DOI] [PMC free article] [PubMed] [Google Scholar]
- 32.McNaughton SA, Ball K, Mishra GD, Crawford DA. Dietary patterns of adolescents and risk of obesity and hypertension. J Nutr. 2008 Feb;138(2):364–70. doi: 10.1093/jn/138.2.364. [DOI] [PubMed] [Google Scholar]
- 33.Tang JW, Kushner RF, Thompson J, Baker DW. Physician counseling of young adults with rapid weight gain: a retrospective cohort study. BMC family practice. 2010 Apr 30;11:31. doi: 10.1186/1471-2296-11-31. [DOI] [PMC free article] [PubMed] [Google Scholar]
- 34.Lee SA, Shu XO, Li H, Yang G, Cai H, Wen W, et al. Adolescent and adult soy food intake and breast cancer risk: results from the Shanghai Women’s Health Study. Am J Clin Nutr. 2009 Jun;89(6):1920–6. doi: 10.3945/ajcn.2008.27361. [DOI] [PMC free article] [PubMed] [Google Scholar]
- 35.Moreno LA, De Henauw S, Gonzalez-Gross M, Kersting M, Molnar D, Gottrand F, et al. Design and implementation of the Healthy Lifestyle in Europe by Nutrition in Adolescence Cross-Sectional Study. International journal of obesity. 2008 Nov;32(Suppl 5):S4–11. doi: 10.1038/ijo.2008.177. [DOI] [PubMed] [Google Scholar]
- 36.Beghin L, Huybrechts I, Vicente-Rodriguez G, De Henauw S, Gottrand F, Gonzales-Gross M, et al. Main characteristics and participation rate of European adolescents included in the HELENA study. Archives of public health = Archives belges de sante publique. 2012;70(1):14. doi: 10.1186/0778-7367-70-14. [DOI] [PMC free article] [PubMed] [Google Scholar]
- 37.Beghin L, Castera M, Manios Y, Gilbert CC, Kersting M, De Henauw S, et al. Quality assurance of ethical issues and regulatory aspects relating to good clinical practices in the HELENA Cross-Sectional Study. Int J Obes. 32(S5):S12–S8. doi: 10.1038/ijo.2008.179. 0000//print. [DOI] [PubMed] [Google Scholar]
- 38.Gonzalez-Gross M, Breidenassel C, Gomez-Martinez S, Ferrari M, Beghin L, Spinneker A, et al. Sampling and processing of fresh blood samples within a European multicenter nutritional study: evaluation of biomarker stability during transport and storage. Int J Obes. 32(S5):S66–S75. doi: 10.1038/ijo.2008.185. 0000//print. [DOI] [PubMed] [Google Scholar]
- 39.Hoebeeck LI, Rietzschel ER, Langlois M, De Buyzere M, De Bacquer D, De Backer G, et al. The relationship between diet and subclinical atherosclerosis: results from the Asklepios Study. Eur J Clin Nutr. 2011 May;65(5):606–13. doi: 10.1038/ejcn.2010.286. Epub 2011/01/20. eng. [DOI] [PubMed] [Google Scholar]
- 40.Vereecken C, Dohogne S, Covents M, Maes L. How accurate are adolescents in portion-size estimation using the computer tool Young Adolescents’ Nutrition Assessment on Computer (YANA-C)? The British journal of nutrition. 2010 Jun;103(12):1844–50. doi: 10.1017/S0007114510000127. [DOI] [PubMed] [Google Scholar]
- 41.Vereecken CA, Covents M, Matthys C, Maes L. Young adolescents’ nutrition assessment on computer (YANA-C) Eur J Clin Nutr. 2005 May;59(5):658–67. doi: 10.1038/sj.ejcn.1602124. [DOI] [PubMed] [Google Scholar]
- 42.Vereecken CA, Covents M, Sichert-Hellert W, Alvira JM, Le Donne C, De Henauw S, et al. Development and evaluation of a self-administered computerized 24-h dietary recall method for adolescents in Europe. International journal of obesity. 2008 Nov;32(Suppl 5):S26–34. doi: 10.1038/ijo.2008.180. [DOI] [PubMed] [Google Scholar]
- 43.Dehne LI, Klemm C, Henseler G, Hermann-Kunz E. The German Food Code and Nutrient Data Base (BLS II.2) European journal of epidemiology. 1999 Apr;15(4):355–9. doi: 10.1023/a:1007534427681. [DOI] [PubMed] [Google Scholar]
- 44.Julian-Almarcegui C, Bel-Serrat S, Kersting M, Vicente-Rodriguez G, Nicolas G, Vyncke K, et al. Comparison of different approaches to calculate nutrient intakes based upon 24-h recall data derived from a multicenter study in European adolescents. European Journal of Nutrition. 2016 Mar;55(2):537–45. doi: 10.1007/s00394-015-0870-9. [DOI] [PubMed] [Google Scholar]
- 45.The Multiple Source Method (MSM) Department of Epidemiology of the German Institute of Human Nutrition Potsdam-Rehbrücke (DiFE); 2011. https://nugo.dife.de/msm. [Google Scholar]
- 46.Haubrock J, Hartigg U, Souverein O, Boeing H. An improved statistical tool for estimating usual intake distributions: the multiple source method (MSM) Archives of public health = Archives belges de sante publique. 2010;68:14–5. [Google Scholar]
- 47.Moreno LA, Kersting M, de Henauw S, Gonzalez-Gross M, Sichert-Hellert W, Matthys C, et al. How to measure dietary intake and food habits in adolescence: the European perspective. International journal of obesity. 2005 Sep;29(Suppl 2):S66–77. doi: 10.1038/sj.ijo.0803063. [DOI] [PubMed] [Google Scholar]
- 48.Shivappa N, Steck SE, Hurley TG, Hussey JR, Ma Y, Ockene IS, Tabung F, Hebert JR. A population-based dietary inflammatory index predicts levels of C-reactive protein in the Seasonal Variation of Blood Cholesterol Study (SEASONS) Public Health Nutr. 2013 Oct 10;10:1–9. doi: 10.1017/S1368980013002565. [DOI] [PMC free article] [PubMed] [Google Scholar]
- 49.Nagy E, Vicente-Rodriguez G, Manios Y, Beghin L, Iliescu C, Censi L, et al. Harmonization process and reliability assessment of anthropometric measurements in a multicenter study in adolescents. Int J Obes. 32(S5):S58–S65. doi: 10.1038/ijo.2008.184. 0000//print. [DOI] [PubMed] [Google Scholar]
- 50.De Cocker K, Ottevaere C, Sjostrom M, Moreno LA, Warnberg J, Valtuena J, et al. Self-reported physical activity in European adolescents: results from the HELENA (Healthy Lifestyle in Europe by Nutrition in Adolescence) study. Public Health Nutr. 2011 Feb;14(2):246–54. doi: 10.1017/S1368980010000558. [DOI] [PubMed] [Google Scholar]
- 51.Cole TJ, Bellizzi MC, Flegal KM, Dietz WH. Establishing a standard definition for child overweight and obesity worldwide: international survey. Bmj. 2000 May 6;320(7244):1240–3. doi: 10.1136/bmj.320.7244.1240. 27365 child overweight and obesity, specifying the measurement, reference population, and age and sex specific cut off points. Data on body mass index (weight/height) were obtained from 6 large nationally representative cross sectional surveys on growth from Brazil, Great Britain, Hong Kong, the Netherlands, Singapore, and the US. The study included 97,876 males and 94,851 females from birth to 25 years of age. For each of the surveys, centile curves were drawn that at age 18 years passed through the widely used cut-off points of 25 and 30 kg/sq. m for adult weight and obesity. The resulting curves were averaged to provide age- and sex-specific cut-off points from 2 to 18 years. The proposed cut off points, which are less arbitrary and more internationally based than current alternatives, should help to provide internationally comparable prevalence rates of overweight and obesity in children. [DOI] [PMC free article] [PubMed] [Google Scholar]
- 52.Cole TJ, Lobstein T. Extended international (IOTF) body mass index cut-offs for thinness, overweight and obesity. Pediatric obesity. 2012 Aug;7(4):284–94. doi: 10.1111/j.2047-6310.2012.00064.x. [DOI] [PubMed] [Google Scholar]
- 53.Houston DK, Nicklas BJ, Ding JZ, Harris TB, Tylavsky FA, Newman AB, et al. Dietary protein intake is associated with lean mass change in older, community-dwelling adults: the Health, Aging, and Body Composition (Health ABC) Study. American Journal of Clinical Nutrition. 2008 Jan;87(1):150–5. doi: 10.1093/ajcn/87.1.150. [DOI] [PubMed] [Google Scholar]
- 54.Mink PJ, Scrafford CG, Barraj LM, Harnack L, Hong CP, Nettleton JA, et al. Flavonoid intake and cardiovascular disease mortality: a prospective study in postmenopausal women. American Journal of Clinical Nutrition. 2007 Mar;85(3):895–909. doi: 10.1093/ajcn/85.3.895. [DOI] [PubMed] [Google Scholar]
- 55.Villa I, Yngve A, Poortvliet E, Grjibovski A, Liiv K, Sjöström M, et al. Dietary intake among under-, normal- and overweight 9- and 15-year-old Estonian and Swedish schoolchildren. Public Health Nutrition. 2007;10(03):311–22. doi: 10.1017/S1368980007352476. [DOI] [PubMed] [Google Scholar]
- 56.Tucker LA, Seljaas GT, Hager RL. Body Fat Percentage of Children Varies According to Their Diet Composition. Journal of the American Dietetic Association. 97(9):981–6. doi: 10.1016/S0002-8223(97)00237-X. [DOI] [PubMed] [Google Scholar]
- 57.Guo SS, Wu W, Chumlea WC, Roche AF. Predicting overweight and obesity in adulthood from body mass index values in childhood and adolescence. Am J Clin Nutr. 2002 Sep;76(3):653–8. doi: 10.1093/ajcn/76.3.653. [DOI] [PubMed] [Google Scholar]
- 58.Amati L, Chiloiro M, Jirillo E, Covelli V. Early pathogenesis of atherosclerosis: the childhood obesity. Curr Pharm Des. 2007;13(36):3696–700. doi: 10.2174/138161207783018563. [DOI] [PubMed] [Google Scholar]
- 59.Kress AM, Hartzel MC, Peterson MR. Burden of disease associated with overweight and obesity among U.S. military retirees and their dependents, aged 38–64, 2003. Preventive medicine. 2005 Jul;41(1):63–9. doi: 10.1016/j.ypmed.2004.10.012. [DOI] [PubMed] [Google Scholar]
- 60.Must A, Spadano J, Coakley EH, Field AE, Colditz G, Dietz WH. The disease burden associated with overweight and obesity. JAMA. 1999 Oct 27;282(16):1523–9. doi: 10.1001/jama.282.16.1523. [DOI] [PubMed] [Google Scholar]
- 61.Morrison JA, Glueck CJ, Daniels S, Wang P. Determinants of persistent obesity and hyperinsulinemia in a biracial cohort: a 15-year prospective study of schoolgirls. The Journal of pediatrics. 2010 Oct;157(4):559–65. doi: 10.1016/j.jpeds.2010.04.030. [DOI] [PubMed] [Google Scholar]
- 62.Estruch R, Ros E, Salas-Salvado J, Covas MI, Corella D, Aros F, et al. Primary Prevention of Cardiovascular Disease with a Mediterranean Diet. New England Journal of Medicine. 2013 Apr 4;368(14):1279–90. doi: 10.1056/NEJMoa1200303. [DOI] [PubMed] [Google Scholar]
- 63.Tuttolomondo A, Casuccio A, Butta C, Pecoraro R, Di Raimondo D, Della Corte V, et al. Mediterranean Diet in patients with acute ischemic stroke: Relationships between Mediterranean Diet score, diagnostic subtype, and stroke severity index. Atherosclerosis. 2015 Nov;243(1):260–7. doi: 10.1016/j.atherosclerosis.2015.09.017. [DOI] [PubMed] [Google Scholar]
- 64.Bluher M. Adipose tissue inflammation: a cause or consequence of obesity-related insulin resistance? Clinical science. 2016 Sep 1;130(18):1603–14. doi: 10.1042/CS20160005. [DOI] [PubMed] [Google Scholar]
- 65.Moreno LA, Bel-Serrat S, Santaliestra-Pasias A, Bueno G. Dairy products, yogurt consumption, and cardiometabolic risk in children and adolescents. Nutrition reviews. 2015 Aug;73(Suppl 1):8–14. doi: 10.1093/nutrit/nuv014. [DOI] [PubMed] [Google Scholar]
- 66.Sleiman D, Al-Badri MR, Azar ST. Effect of mediterranean diet in diabetes control and cardiovascular risk modification: a systematic review. Frontiers in public health. 2015;3:69. doi: 10.3389/fpubh.2015.00069. [DOI] [PMC free article] [PubMed] [Google Scholar]
- 67.Loprinzi PD, Lee IM, Andersen RE, Crespo CJ, Smit E. Association of Concurrent Healthy Eating and Regular Physical Activity With Cardiovascular Disease Risk Factors in U.S. Youth. American journal of health promotion : AJHP. 2015 Sep-Oct;30(1):2–8. doi: 10.4278/ajhp.140213-QUAN-71. [DOI] [PubMed] [Google Scholar]
- 68.Qureshi MM, Singer MR, Moore LL. A cross-sectional study of food group intake and C-reactive protein among children. Nutr Metab. 2009 Oct 12;6 doi: 10.1186/1743-7075-6-40. [DOI] [PMC free article] [PubMed] [Google Scholar]
- 69.Bel-Serrat S, Julián-Almárcegui C, González-Gross M, Mouratidou T, Börnhorst C, Grammatikaki E, et al. Correlates of dietary energy misreporting among European adolescents: the Healthy Lifestyle in Europe by Nutrition in Adolescence (HELENA) study. British Journal of Nutrition. 2016;115(08):1439–52. doi: 10.1017/S0007114516000283. [DOI] [PubMed] [Google Scholar]
Associated Data
This section collects any data citations, data availability statements, or supplementary materials included in this article.