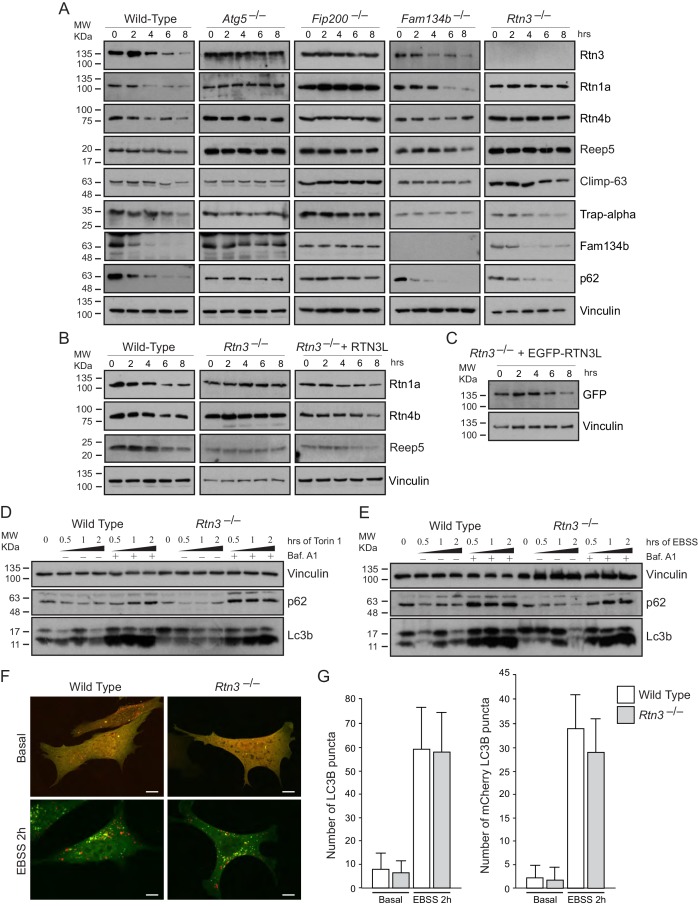
Figure 4. RTN3 absence impairs ER tubules turnover but not macro-autophagy flux.
(A) Western blot analysis of ER protein turnover in wild-type, Atg5–/–, Fip200–/–, Fam134b–/– and Rtn3–/– MEFs. Cells were starved with EBSS for the indicate time in the presence of 100 µM cicloheximide. SQSTM1 (p62) has been used as positive control for autophagy induction. (B) Western blot analysis of ER tubules markers in wild-type, Rtn3–/– MEFs and Rtn3–/– MEFs reconstituted with the human EGFP-RTN3L. (C) Western blot for GFP in Rtn3–/– MEFs transfected with human EGFP-RTN3L. (D,E) Western blot analysis of Lc3b and p62 in wild-type and Rtn3–/– MEFs. Cells were treated with 250 nM Torin1 (D) or EBSS (E) in the presence or absence of Bafilomycin A1, 200 ng/ml, for the indicated time. (F) Representative confocal imagines of wild-type and Rtn3 knockout MEFs, transfected with mCherry-EGFP-LC3B, in standard conditions (DMEM with 10% FBS) and after 6 hr EBSS treatment. Scale bars: 10 µm. (G) Quantification of LC3B positive autophagy puncta in wild-type and Rtn3–/– MEFs transfected with mCherry-EGFP-LC3B. Cells were grown in standard conditions or treated with EBSS for 2 hr. Number of cells >50 for each condition. Data are representative of three independent biological replicates. Error bars indicate s.d. No significant differences were detected between wild-type and Rtn3–/– MEFs.


