Abstract
Background
Computerized tomography (CT) angiography is an important tool for evaluation of coronary artery disease (CAD), but often correlates poorly with myocardial ischemia. Current dynamic CT perfusion techniques can assess ischemia, but have limited accuracy and deliver high radiation dose. Therefore, an accurate, low-dose, dynamic CT perfusion technique is needed.
Methods and Results
A total of 20 contrast enhanced CT volume scans were acquired in 5 swine (40 ± 10 kg) to generate CT angiography and perfusion images. Varying degrees of stenosis were induced using a balloon catheter in the proximal left anterior descending (LAD) coronary artery and a pressure wire was used for reference fractional flow reserve (FFR) measurement. Perfusion measurements were made with only two volume scans using a new first-pass analysis (FPA) technique and with 20 volume scans using an existing maximum slope model (MSM) technique. Perfusion (P) and FFR measurements were related by PFPA = 1.01 FFR − 0.03 (R2 = 0.85) and PMSM = 1.03 FFR − 0.03 (R2 = 0.80) for FPA and MSM techniques, respectively. Additionally, the effective radiation doses were calculated to be 2.64 and 26.4 mSv for FPA and MSM techniques, respectively.
Conclusions
A new FPA-based dynamic CT perfusion technique was validated in a swine animal model. The results indicate that the FPA technique can potentially be used for improved anatomical and functional assessment of CAD at a relatively low radiation dose.
Keywords: Angiography, Coronary Disease, Imaging, Perfusion, Tomography
Coronary artery disease (CAD) is the leading cause of morbidity and mortality worldwide, with extensive CAD and its resultant ventricular dysfunction strongly predictive of future cardiac events. Fortunately, morbidity and mortality are significantly reduced when patients are risk stratified using computed tomography (CT) angiography1, 2 and treated appropriately with medical therapy or revascularization3, 4. However, CT angiography is fundamentally limited in that lesion severity is based solely on lesion morphology; hence, vessel collateralization, coronary calcification, and image artifacts confound diagnostic results1, 2, 5. Furthermore, subjective visual grading of lesions results in high intra- and interobserver variability6–8, with poor correlation between lesion severity and myocardial ischemia, especially for intermediate stenoses (30–70% luminal narrowing)5, 9, 10. Hence, CT angiography alone cannot fully characterize coronary lesions10, 11, and functional assessment techniques, in concert with CT angiography, are needed for more objective indication of coronary lesion significance6–8, 12–14. As an initial solution, many dynamic CT perfusion techniques, such as the maximum slope model (MSM), have been developed and implemented using 64-slice CT technology, with recent reports confirming the value of dynamic CT perfusion in the functional assessment of CAD15–17. In general, these techniques monitor myocardial uptake of contrast material, i.e., changes in myocardial enhancement, within a tissue slab of interest over time to derive relevant perfusion data. Unfortunately, despite positive correlation with single-photon emission computed tomography (SPECT)17 and invasive fractional flow reserve (FFR)15, 18, such techniques are inaccurate and underestimate absolute perfusion19. Specifically, most dynamic CT perfusion techniques operate under the assumption that contrast material does not exit the myocardial tissue volume-of-interest (VOI) over the measurement time. However, due to the limited cranio-caudal coverage of 64-slice CT technology, such techniques utilize small tissue VOIs to derive perfusion. Thus, when considering the myocardial transit time of 3–5 seconds from coronary artery to coronary sinus at maximal hyperemia20, significant contrast material loss from those small VOIs is unavoidable, resulting in underestimation of perfusion. Furthermore, due to the poor signal-to-noise ratio (SNR) associated with small volume measurement, such techniques require image acquisition over many cardiac cycles to generate reliable perfusion metrics, leading to cumulative radiation doses of up to 10–15 mSv per exam21–23. While some radiation dose reduction is possible through tube voltage (kVp) and photon fluency (mAs) optimization, as well as through iterative reconstruction24, 25, the fundamental limitations of measurement inaccuracy and large radiation dose have hampered dynamic CT perfusion’s widespread clinical utility.
To overcome such obstacles, this study validated a new CT-based approach to anatomical and functional assessment of CAD. Specifically, simultaneous acquisition of CT angiography and dynamic CT perfusion data with a whole-heart CT scanner, combined with a novel first-pass analysis (FPA) technique, enables reliable assessment of CAD, with invasive fractional flow reserve (FFR) as the reference standard. Further, by using a two volume scan acquisition protocol, both the radiation and contrast dose per exam can be reduced, making comprehensive CT-based evaluation of CAD more accessible and impactful to patients in need.
Methods
First-Pass Analysis Model
Our low-dose dynamic CT perfusion technique is based on a first-pass analysis (FPA) model and conservation of contrast material mass26, 27. Specifically, any coronary perfusion territory distal to a stenosis may be modeled as a single compartment with a unique entrance and exit vessel, as described in Figure 1. By definition, the compartmental perfusion (PFPA) is proportional to the mass of contrast material that accumulates in the compartment per unit time (dMC/dt), divided by the incoming contrast concentration (Cin) and compartment tissue mass (MT), prior to significant contrast exit. Using cardiac CT data, dMC/dt may be derived from the change in integrated Hounsfield Units (HU) within the compartment, while Cin may be estimated from the arterial input function (AIF)28.
Figure 1.
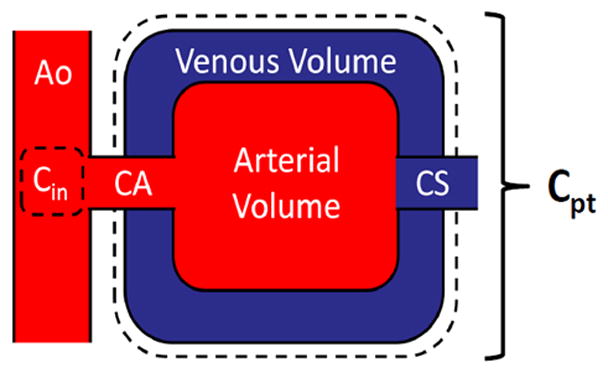
Coronary perfusion compartment model used for FPA perfusion measurement, indicating the aortic (Ao) input (Cin), coronary artery of interest (CA), distal perfusion territory of interest (Cpt), and coronary sinus (CS). The compartment tissue mass is defined as MT in Equation 1.
| (1) |
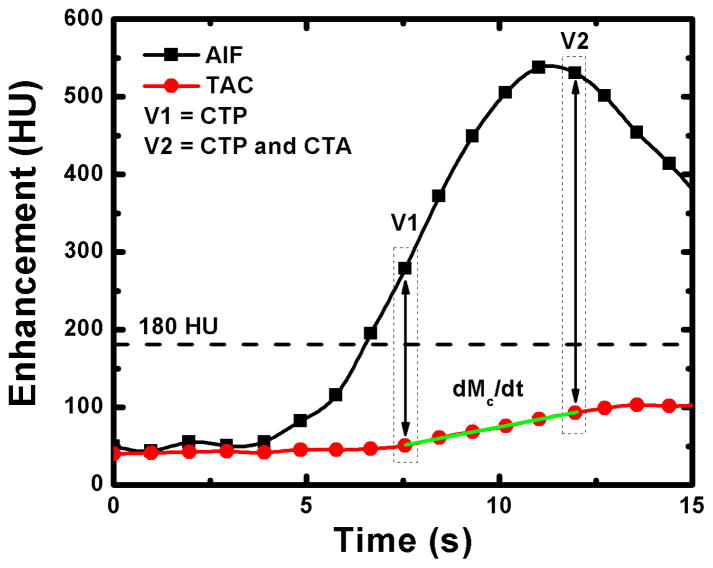
As previously reported28, only two volume scans, denoted as V1 and V2 in Figure 2, are necessary for perfusion measurement with our FPA technique. V1 is used for dynamic CT perfusion measurement and is the first volume scan after the AIF exceeds 180 HU, while V2 is used for both dynamic CT perfusion measurement and CT angiography and is the first volume scan after the AIF reaches its peak. In general, such volume scans always occur less than five seconds apart, and ensure that the maximum rate of contrast material mass accumulation (dMC/dt) in any perfusion compartment of interest is always captured for dynamic CT perfusion measurement prior to significant contrast exit, while maximal coronary opacification is always achieved for CT angiography.
Figure 2.
Two volume scans, denoted as V1 and V2, are used for FPA perfusion measurement. The integrated change in myocardial HU is derived from the tissue time attenuation curve (TAC), while the average input concentration is estimated from the arterial input function (AIF). The volume scan at maximal enhancement (V2) is also used for CT angiography.
Maximum Slope Model
The maximum slope model (MSM) is a dynamic CT perfusion technique that defines perfusion (PMSM) as the maximum upslope of the tissue time attenuation curve (TAC), divided by the maximum of the AIF and tissue density (ρ). In general, the MSM generates tissue TACs using small volumes-of-interest (VOI), on the order of 1.5 cm2 × 0.5 cm each, that are placed in a coronary perfusion territory of interest distal to a stenosis, and assumes no contrast exit from those VOIs over the measurement time. Unfortunately, given the low SNR of the resulting tissue TACs, the maximum upslope is difficult to determine, therefore, the average upslope is more often used19, 22, as seen in Equation 2.
| (2) |
Animal Preparation
The study was approved by the animal care committee and institutional review board for the care of animal subjects and was performed in agreement with the position of the American Heart Association on research animal use. Specifically, an animal model was created that allowed several levels of single vessel disease to be induced in the proximal left anterior descending (LAD) coronary artery. Sex-based differences in disease were not present; hence, five male Yorkshire swine (weight: 40 ± 10 kg) were sufficient for validation of the FPA technique. Anesthesia was induced with Telazol (4.4mg/kg), Ketamine (2.2 mg/kg), and Xylazine (2.2 mg/kg). After induction, each animal was intubated (Covedien, Mansfield, MA) and ventilated (Highland Medical Equipment, Temecula, CA) with an oxygen-air-mixture containing 1.5–2.5% Isoflurane anesthetic (Baxter, Deerfield, IL). ECG, O2 saturation, temperature, and end-tidal CO2 were monitored and a warming blanket (HTP-1500, Adroit Medical Systems, Loudon, TN) was used to prevent hypothermia.
The right carotid artery, right femoral artery, and both femoral veins were cannulated under ultrasonic guidance (Vivid E9, GE Healthcare). 6 and 7F sheaths (Terumo Interventional Systems, Somerset, NJ) were placed in the arteries and veins respectively. Blood pressure was monitored from the carotid sheath, the left femoral vein was used for contrast injection, and the right femoral vein was used for drug and fluid administration. Prior to cardiac catheterization, heparin was administered (10,000 unit bolus followed by 1,000 units/hour). A 6F Judkins right guiding catheter (Cordis Corporation, Miami, FL) was used to engage the left main coronary artery and a 0.014″ intracoronary pressure wire (PrimeWire PRESTIGE® Pressure Guide Wire, Volcano Corp, Rancho Cordova, CA) was placed into the distal LAD. A balance middleweight (BMW) 0.014″ coronary guide wire (Abbott Vascular, Abbott Park, IL) was also placed in the distal LAD and a balloon catheter was passed over the BMW wire into the proximal LAD.
Prior to stenosis induction, intracoronary adenosine was infused at a rate of 240 μg/min (Harvard Apparatus, Model 55-2222) to produce maximal hyperemia in the LAD. Intracoronary adenosine was used rather than intravenous adenosine to prevent reflex-tachycardia-dependent motion artifact, as swine under anesthesia experience profound hypotension from intravenous adenosine. Once hyperemia was achieved in the LAD, the balloon was inflated to induce several different levels of stenosis. Stenosis severity was assessed via fractional flow reserve (FFR) measurement (ComboMap, Volcano Corp., Rancho Cordova, CA). Specifically, FFR is defined as the ratio of pressure distal to a stenosis (Pd) to the pressure proximal to a stenosis (Pa) at maximal hyperemia and has a normal value of 1.0. FFR is particularly useful in characterizing the functional significance of intermediate severity stenoses29, 30; hence, it was used as the reference standard for validation of the FPA technique. The entire interventional setup is illustrated in Figure 3. Finally, after all equipment was in place, each animal was positioned in the CT gantry and imaged. At each stenosis level, reference standard FFR was recorded continuously (MP150, Biopac Systems, Inc., Goleta, CA). Overall, FFRs from 0.4 to 1.0 were evaluated.
Figure 3.
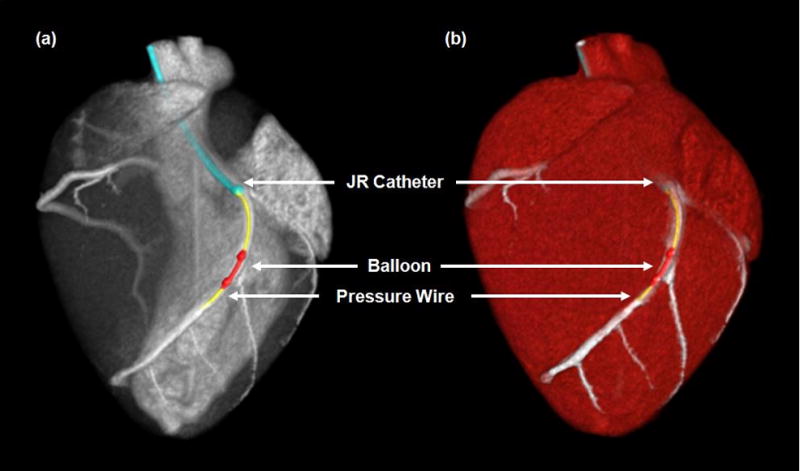
CT projection (a) and angiographic (b) images of the interventional setup, with the Judkins right (JR) catheter (blue), pressure wire (yellow), and balloon catheter (red) displayed.
CT Imaging Protocol
At each stenosis level, contrast-enhanced (Isovue 370, Bracco Diagnostics, Princeton, NJ) whole-heart imaging was performed with a 320-slice CT scanner (Aquilion One, Toshiba American Medical Systems, Tustin, CA) using 320 × 0.5 mm collimation at 100 kVp and 200 mA. All contrast injections (Empower CTA, Acist Medical Systems, Eden Prairie, MN) were made peripherally (50 mL at 5 mL/s) and were followed by a saline chaser (25 mL at 5 mL/s). Twenty consecutive volume scans were acquired for MSM implementation. However, only two volume scans less than five seconds apart, denoted as V1 and V2 in Figure 2, were used for FPA perfusion measurement. For all acquisitions, diastolic-phase images were reconstructed at 75% of the R-R interval using an FC03 kernel with standard beam hardening corrections and a voxel size of 0.43 × 0.43 × 0.5 mm. Full projection data was used to avoid partial scan artifacts, but limited temporal resolution to 0.35 seconds31. The dose-length product was also recorded and was converted into effective radiation dose using an adult chest conversion factor of 0.015. However, given that the kV, mA, and volume scan number were all fixed, the effective radiation dose per volume scan was the same for all acquisitions across all animals, independent of animal size.
Image Processing
FPA perfusion was derived in the distal LAD using a novel image processing scheme, as summarized in Figure 4. First, the volume scans of interest were registered32 and combined into a single maximum intensity projection (MIP) volume. Semi-automatic segmentation of the MIP was performed, yielding a binary myocardial mask. The coronary vessel centerlines of the LAD, left circumflex coronary artery (LCx), and right coronary artery (RCA) were then extracted with a Vitrea workstation (Vitrea fX ver6.0, Minnetonka, MN, USA). From the myocardial mask and coronary centerlines, vessel-specific myocardial assignment was performed using a minimum-cost-path approach33, 34, yielding three separate perfusion territories, one for each major coronary vessel, with the LAD territory further partitioned to isolate the diseased distal tissue compartment. Using the compartment mass, the average of the AIF, and the integrated change in myocardial HU between V1 and V2, FPA perfusion was derived for each acquisition. Finally, MSM perfusion was derived in the distal LAD using a single VOI, measuring 1.5 cm2 × 0.5 cm, placed within the anterior wall of the left ventricle distal to the stenosis. Given the average rate of dynamic enhancement within that VOI, the maximum of the AIF, and the myocardial density, MSM perfusion was derived for each acquisition.
Figure 4.
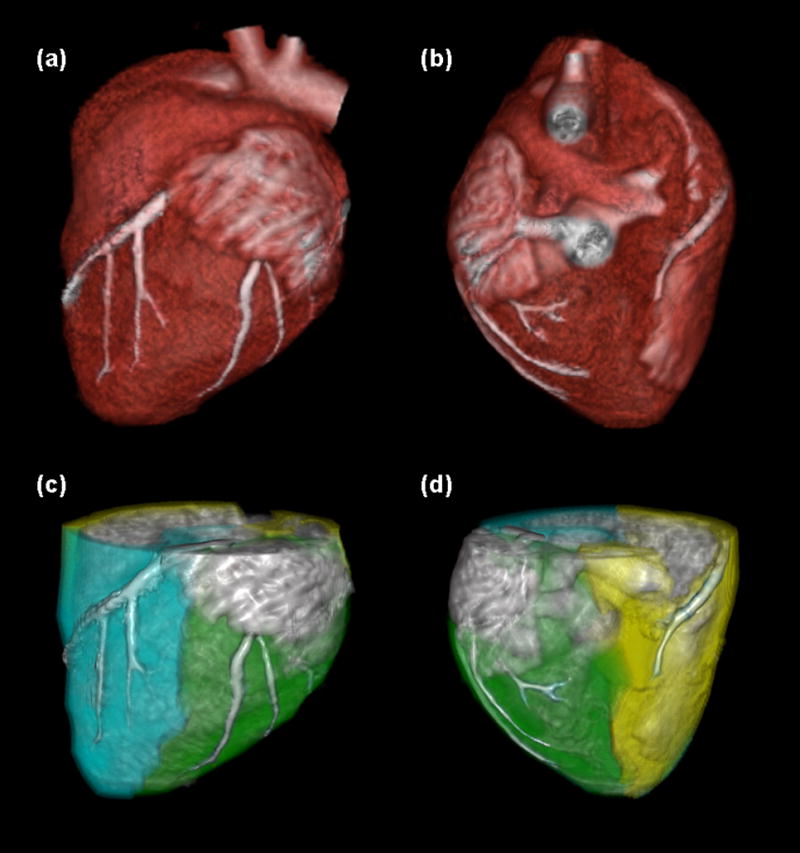
Image processing scheme for the FPA technique. The myocardium is segmented and coronary centerlines are extracted (a, b). Myocardial assignment is performed, with the LAD territory further partitioned to isolate the diseased distal tissue (c, d: cyan = total LAD territory, green = total LCX territory, yellow = total RCA territory).
Relative Perfusion
The FPA technique can accurately measure absolute perfusion28. However, for the purposes of this study, absolute perfusion measurement could not be validated against FFR as FFR is a relative metric. Thus, respective absolute perfusion measurements (PFPA and PMSM) were normalized into relative perfusion measurements, where relative perfusion was defined as the ratio of perfusion in the presence of a stenosis to perfusion in the absence of a stenosis, at maximal hyperemia. Such a ratio corrected for the semi-quantitative nature of the MSM technique, enabling one-to-one comparison between FPA and MSM perfusion measurements. Additionally, the ratio enabled validation of two-volume FPA perfusion measurement against reference standard FFR measurement.
Statistical Approach
As a wide range of stenotic disease was evaluated in each animal, with no repeat measurements made per stenosis level, all measurements were assumed to be independent. Relative FPA and MSM perfusion measurements were compared to reference standard FFR measurements using linear regression and Bland-Altman analysis. The coefficient of determination (R2), root-mean-square error (RMSE), root-mean-square deviation (RMSD), and concordance correlation coefficient (CCC)35 were also computed. Based on a recent study, a correlation of at least r = 0.76 was expected between relative perfusion and reference standard FFR measurement18. However, as indicated by our previous work28, the FPA technique improves perfusion measurement correlation. Therefore, given a significance level of 0.05 and a power of 0.80, a sample size of 15 independent measurements was projected to adequately power the study. Finally, the area under the curve (AUC) of the receiver operator characteristic (ROC) was computed, with reference standard FFR measurement less than or equal to 0.8 classified as functionally significant, in order to determine the diagnostic sensitivity and specificity of relative FPA and MSM perfusion measurement in detection of functionally significant stenoses.
Results
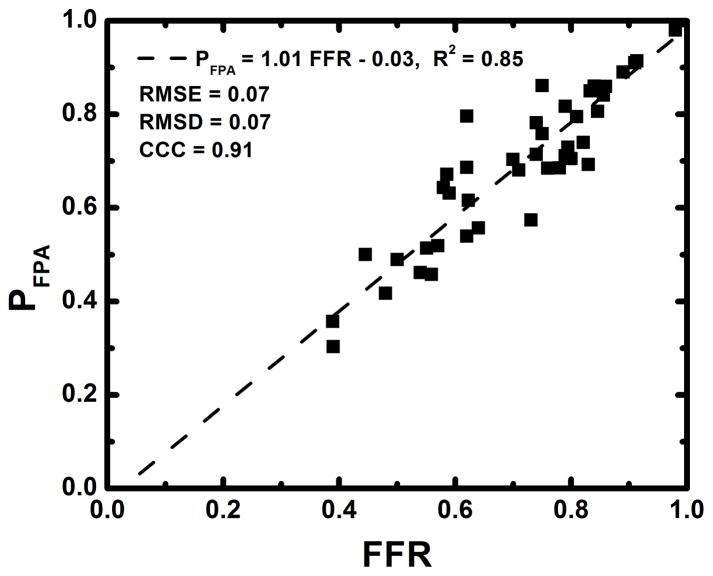
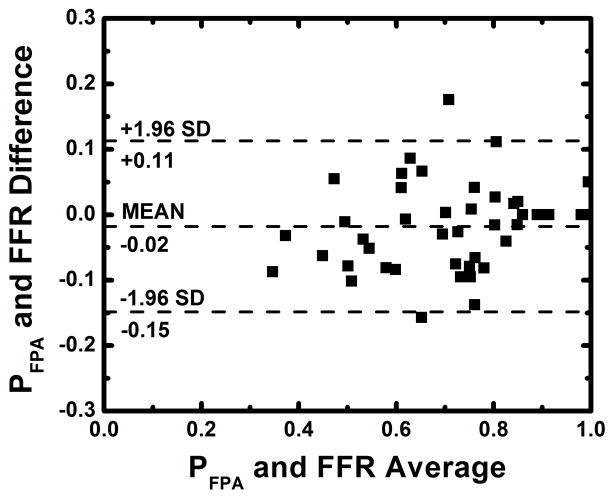
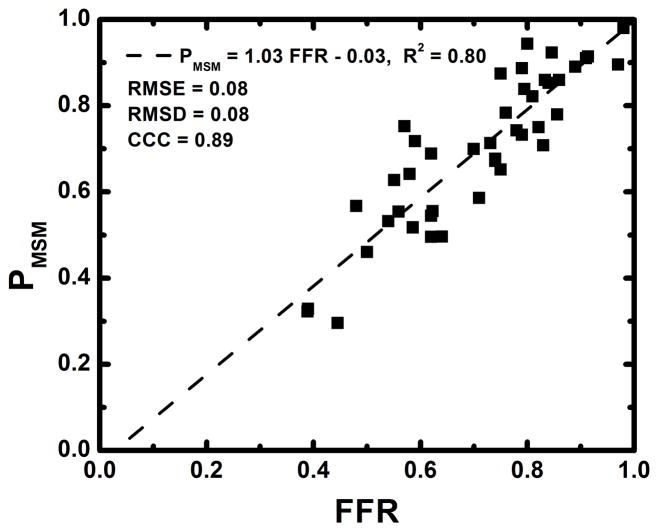
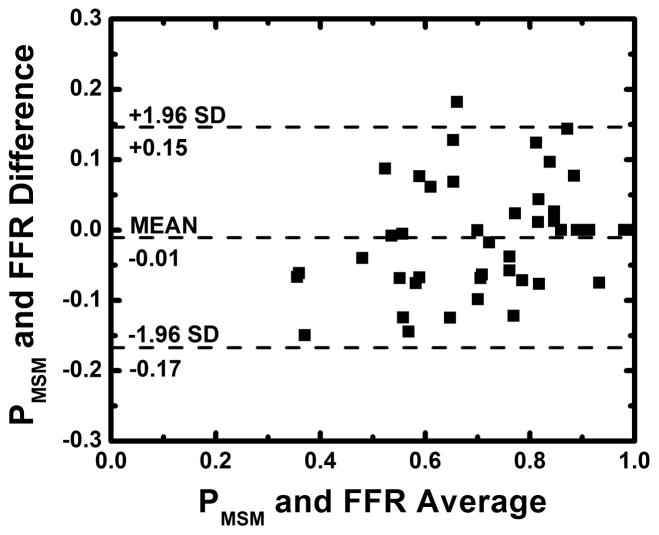
The average heart rate and mean arterial pressure (MAP) during imaging were 84 beats per minute and 77 mmHg, respectively, as shown in Table 1. The average radiation dose of FPA perfusion measurement was 2.64 mSv; much lower than the 26.4 mSv dose of MSM perfusion measurement. Additionally, as indicated by Table 2, the result of absolute FPA perfusion measurement at baseline and maximal hyperemia agreed well with corresponding quantitative [15O] H2O PET perfusion measurement reported by the literature36, while MSM perfusion measurement systematically underestimated flow. As shown in Figure 5, the result of relative FPA perfusion measurement was in good agreement with reference standard FFR measurement (PFPA = 1.01 FFR – 0.03 (95% CI = [0.87 1.14]), R2 = 0.85 (95% CI = [0.74 0.92]), P < 0.001). The RMSE was 0.07, and Bland-Altman analysis demonstrated negligible systematic measurement bias. The RMSD was 0.07, and the majority of the data fell within the limits of agreement. Additionally, the CCC was found to be ρ = 0.91 (95% CI = [0.84 0.95]), indicating excellent agreement between relative FPA perfusion measurement and reference standard FFR measurement. As shown in Figure 6, the result of relative MSM perfusion measurement was in good agreement with reference standard FFR measurement (PMSM = 1.03 FFR – 0.03 (95% CI = [0.87 1.18]), R2 = 0.80 (95% CI = [0.67 0.89]), P < 0.001). The RMSE was 0.08, and Bland-Altman analysis demonstrated negligible systematic measurement bias. The RMSD was 0.08, and the majority of the data fell within the limits of agreement. Additionally, the CCC was found to be ρ = 0.89 (95% CI = [0.81 0.94]), indicating good agreement between relative MSM perfusion measurement and reference standard FFR measurement.
Table 1.
Animal parameters
| Parameter | Mean ± SD |
|---|---|
| Weight (kg) | 40 ± 10 |
| HR (beats/min) | 84 ± 10.4 |
| MAP (mmHg) | 77 ± 9.4 |
Table 2.
Comparison of dynamic CT perfusion to quantiative [15O] H2O PET
| Modality | Baseline Perfusion (mL/min/g) | Hyperemic Perfusion (mL/min/g) |
|---|---|---|
| PET | 1.00 ± 0.25 | 3.26 ± 1.04 |
| FPA | 1.18 ± 0.58 | 5.44 ± 1.44 |
| MSM | 0.54 ± 0.12 | 1.82± 0.43 |
Figure 5.
Regression analysis comparing the result of relative FPA perfusion measurement to reference standard FFR measurement (a). Bland-Altman analysis was also performed (b).
Figure 6.
Regression analysis comparing the result of relative MSM perfusion measurement to reference standard FFR measurement (a). Bland-Altman analysis was also performed (b).
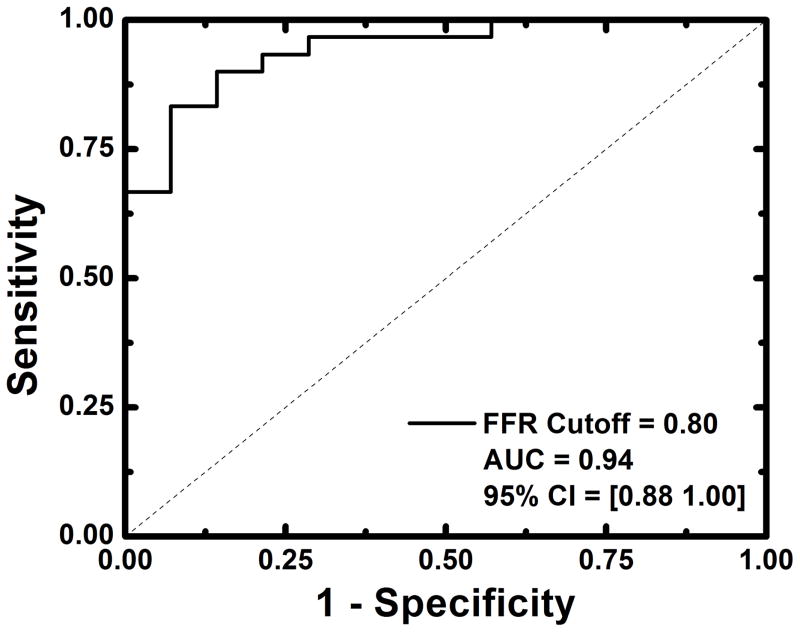
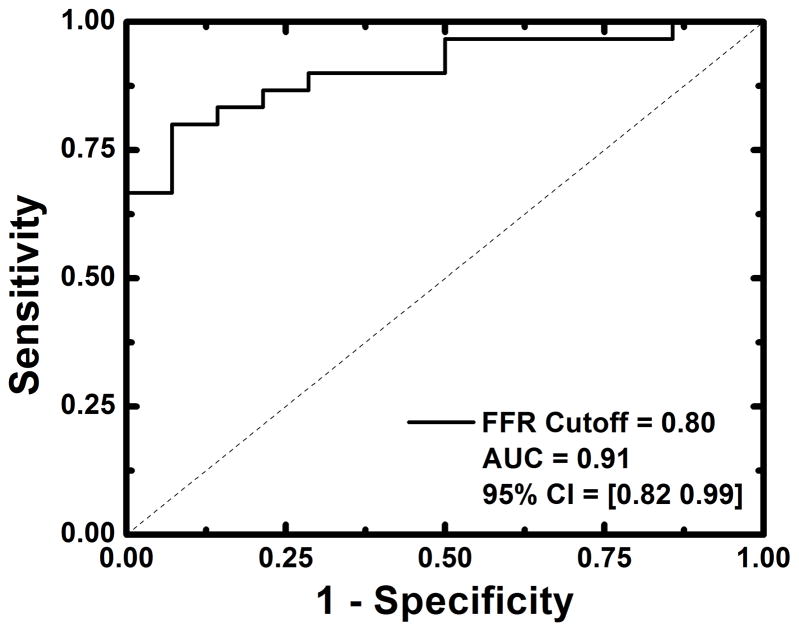
Detection of functionally significant stenoses, classified as having FFRs less than or equal to 0.80, was also evaluated. For relative FPA perfusion measurement, the diagnostic sensitivity, specificity, positive predictive value, and negative predictive value was 93% (95% CI = [78% – 99%]), 79% (95% CI = [49% – 95%]), 90% (95% CI = [74% – 98%]), and 85% (95% CI = [55% – 98%]), respectively, while the diagnostic accuracy was 94% (95% CI = [88% – 100%]), as indicated by the AUC of the ROC in Figure 7a. For relative MSM perfusion measurement, the diagnostic sensitivity, specificity, positive predictive value, and negative predictive value was 87% (95% CI = [69% – 96%]), 79% (95% CI = [49% – 95%]), 90% (95% CI = [73% – 98%]), and 73% (95% CI = [45% – 92%]), respectively, while the diagnostic accuracy was 91% (95% CI = [82% – 99%]), as indicated by the AUC of the ROC in Figure 7b.
Figure 7.
Diagnostic performance of relative FPA and relative MSM perfusion measurement as compared to reference standard FFR measurement (a, b). Functionally significant stenoses were classified as having FFRs less than or equal to 0.8.
Discussion
We have developed a technique to improve anatomical and functional assessment of CAD using whole-heart CT scanner technology and a novel FPA approach. As previously described26–28, our technique assumes that contrast material does not exit the myocardial tissue VOI over the measurement time. However, by dramatically increasing the size of that VOI to encompass the entire coronary perfusion territory distal to a stenosis, while also reducing the time necessary to measure perfusion, the problem of contrast material loss from the VOI over the measurement time is eliminated, i.e., the problem of perfusion underestimation19 is solved. Isolation of entire coronary perfusion territories and reduced measurement time is made possible by whole-heart CT scanner technology37 which allows the entire heart to be imaged in a single cardiac cycle. Furthermore, such technology enables simultaneous acquisition of CT angiography and dynamic CT perfusion data using a single contrast injection, ultimately reducing radiation and contrast dose to patients per CAD exam. Moreover, the improvements in measurement SNR afforded by whole-heart CT scanner technology and the FPA technique minimizes the number of volume scans necessary for perfusion measurement, reducing the radiation dose to 2.64 mSv; much lower than the 10–15 mSv dose of current dynamic CT perfusion techniques21–23, 38. Thus, the proposed FPA technique is novel in its approach to CAD diagnosis and evaluation. By isolating patient-specific coronary anatomy from CT angiography, low-dose, vessel-specific dynamic CT perfusion measurement in the LAD, LCx and RCA perfusion territories is feasible.
Given the results of the study, the FPA technique performed as well as the MSM technique in characterization of functionally significant lesions, as indicated by the ROC curve analysis, with additional gains in sensitivity and negative predictive value. While both techniques agreed well with reference standard FFR measurement, the FPA technique demonstrated better concordance correlation and tighter limits of agreement, as compared to the MSM technique. Such findings suggest that large reductions in radiation dose are possible, without sacrificing measurement reliability, by using the FPA technique for noninvasive assessment of CAD.
Despite the apparent advantages of the FPA technique, limitations do exist. Specifically, for the purposes of this study, absolute perfusion measurements were normalized into relative perfusion measurements for one-to-one comparison to reference standard FFR, with relative perfusion defined as the ratio of perfusion in the presence of a stenosis to perfusion in the absence of a stenosis, at maximal hyperemia. However, since intracoronary adenosine was used, hyperemic perfusion measurements in the presence and absence of stenoses were derived solely from the distal LAD. This differs from clinical practice in that such a ratio is normally computed using perfusion measurements from diseased and healthy remote perfusion territories. In either case, relative perfusion is still a valuable metric for assessing the functional severity of single vessel disease. However, it cannot accurately assess multi-vessel or balanced three-vessel disease. Only absolute perfusion (mL/min/g) measurement can overcome such deficiencies39, enabling evaluation of single vessel, multi-vessel, balanced three-vessel, and even microvascular disease. Fortunately, the FPA technique can also measure absolute perfusion, as previously reported28 and demonstrated by general comparison to quantitative [15O] H2O PET from the literature36. Specifically, absolute FPA perfusion measurement at baseline was found to be slightly higher than corresponding quantitative PET perfusion measurement. However, such increases in baseline flow are expected and can be attributed to contrast-induced vasodilation40. Absolute FPA perfusion measurement at maximal hyperemia was also found to be higher than corresponding quantitative PET perfusion measurement. Such increases in hyperemic flow are also expected, however, as the use of intracoronary adenosine enabled full coronary vasodilation while maintaining a high mean systemic driving pressure; a difficult condition to achieve when using intravenous stress agents due to peripheral vasodilation and systemic pressure drop.
Nevertheless, this study only validated FPA-based assessment of proximal vessel disease as compared to FFR, and did not compute branch-specific measurements. While evaluation of such major arterial distributions was sufficient for comparison to FFR, in clinical practice, decision making relies on stress flow mapping of the entire heart. Fortunately, our minimum-cost-path myocardial assignment algorithm enables sub-segmental and branch-specific coronary territory assignment, possibly allowing for more focal FPA perfusion measurement, although further validation is necessary. Furthermore, simultaneous acquisition of whole-heart CT angiography and dynamic CT perfusion data is not possible with 64-slice CT scanners due to limited cranio-caudal coverage that necessitates helical scanning or step-and-shoot acquisition modes for whole-heart imaging. Hence, widespread utilization of the FPA technique depends largely on the availability of whole-heart imaging systems. Fortunately, such systems are becoming more prevalent. Additionally, 128- and 256-slice CT scanners with eight centimeters of cranio-caudal coverage are also becoming more prevalent, with a recent report41 indicating that it is possible to image the entire heart within eight centimeters of cranio-caudal coverage if systolic-phase data is acquired during an end-expiratory breath hold. Hence, the reach of our FPA technique may also be extended to clinical centers with 128- and 256-slice CT scanner technology, although further validation is necessary.
The diagnostic performance of the FPA technique is also directly impacted by several error contributors: physiology, physics, protocol, and processing. Regarding physiology, when imaging at heart rates above 65 beats per minute, blurring of coronary vasculature on CT angiography and spatial misalignment of myocardial voxels between temporally separate dynamic CT perfusion images is bound to occur. Fortunately, the FPA technique derives perfusion from the integrated change in HU within large tissue compartments of interest over the measurement time, thus the relative error contributed by motion artifact is small, as such artifacts generally only affect the voxels along a compartment’s periphery. As a result, the FPA technique is much less affected by heart-rate-dependent motion artifact, as compared to current dynamic CT perfusion techniques, which rely on small volume imaging. Nevertheless, to minimize the effects of high heart rate on FPA and MSM computation, intracoronary adenosine was used rather than intravenous adenosine, preventing hypotension and its associated reflex tachycardia, but was invasive and limited the study to the LAD alone. If intravenous adenosine were to be used instead, as is the clinical standard, concurrent beta blockade could help to reduce heart rate, while enabling functional evaluation of all three major coronary perfusion territories. Moreover, deformable image registration can be used for additional improvements in voxel alignment. Specifically, a 3D image-based motion correction algorithm32 was already integrated into the FPA technique. Finally, with respect to physics, highly attenuating contrast material, as well as metal from the balloon catheter and pressure wire, can generate significant beam hardening artifacts. While manufacturer-specific beam hardening correction algorithms were already used, additional image-based correction algorithms42 could be implemented.
Regarding the imaging protocol, 20 volume scans were used for MSM computation, at a total radiation dose of 26.4 mSv. However, only two volume scans less than five seconds apart were used for FPA computation, at a total radiation dose of 2.64 mSv, indicating the potential for substantial dose reduction in dynamic CT perfusion. That being said, validation of a true, prospective, two-volume FPA acquisition scheme is still necessary. Fortunately, such a scheme is realizable, with only minor increases in dose, through the use dynamic bolus tracking. Hence, a three- to four-fold reduction in radiation dose is achievable with the FPA technique, as compared to the 10–15 mSv dose of current dynamic CT perfusion techniques21–23, 38, with additional reduction possible through mA optimization and iterative reconstruction24, 25. Finally, with respect to image processing, vessel-specific FPA perfusion measurement depends on accurate minimum-cost-path myocardial assignment33, 34. While our assignment algorithm enables the perfusion compartment distal to any coronary stenosis to be isolated, regardless of stenosis location, the accuracy of assignment depends on the spatial resolution of the CT angiogram, i.e., the more extensive the angiogram, the better the result of assignment. While preliminary data suggest that our angiogram quality and assignment algorithm are sufficient, additional validation to determine the minimum vessel sparseness necessary for accurate assignment is still needed.
Conclusions
The results of this work indicate the potential for low-dose, vessel-specific, anatomical and functional assessment of CAD using the FPA technique, as compared to the MSM technique, with invasive FFR as the reference standard. By validating a combined approach to anatomical and functional assessment of CAD, the FPA technique could improve CAD diagnosis and treatment. Furthermore, by reducing the number of volume scans necessary for reliable perfusion measurement, the FPA technique could substantially reduce both radiation and contrast dose per CAD imaging exam, making CT-based assessment of CAD more accessible and impactful to patients in need.
Clinical Perspective.
Coronary artery disease (CAD) is the leading cause of morbidity and mortality worldwide. As a risk factor, CAD and its resultant ischemic cardiomyopathy are strongly predicative of future cardiac events. Fortunately, morbidity and mortality are significantly reduced when patients are appropriately risk stratified using computed tomography (CT) angiography. However, CT angiography is fundamentally limited as a diagnostic modality in that lesion severity is based solely on lesion morphology, often leading to poor correlation with downstream myocardial ischemia, especially for intermediate severity stenoses. Hence, CT-based functional assessment techniques capable of accurate myocardial perfusion measurement are necessary, in concert with CT angiography, for more objective indication of coronary lesion significance. As an initial solution, many dynamic CT perfusion techniques have been developed. Unfortunately, such techniques are quantitatively inaccurate and deliver unacceptably high radiation dose, hampering their widespread clinical utility and overall impact. To overcome such obstacles, this paper validates a new, low-dose, CT angiography and dynamic CT perfusion technique based on first-pass analysis for combined anatomical and functional assessment of CAD, as compared to invasive fractional flow reserve. Specifically, simultaneous acquisition of CT angiography and dynamic CT perfusion data with a whole-heart CT scanner enables vessel-specific, first-pass evaluation of CAD using only two prospectively gated volume scans and a single contrast injection. Hence, this research may reduce both radiation and contrast dose per CAD exam, while improving measurement accuracy, making anatomical and functional assessment of CAD more accessible and impactful to patients in need.
Acknowledgments
The authors thank Drs. Erin Angel and Di Zhang from Toshiba America Medical Systems and Mr. Brian Dertli for their technical support in this work.
Sources of Funding: This work was supported, in part, by the Department of Radiological Sciences at the University of California, Irvine, and by the National Heart, Lung, and Blood Institute of the NIH under award number T32HL116270.
Footnotes
Disclosures: Sabee Molloi, Ph.D., has previously received grants from Toshiba America Medical Systems and Philips Medical Systems.
References
- 1.Miller JM, Rochitte CE, Dewey M, Arbab-Zadeh A, Niinuma H, Gottlieb I, Paul N, Clouse ME, Shapiro EP, Hoe J, Lardo AC, Bush DE, de Roos A, Cox C, Brinker J, Lima JA. Diagnostic performance of coronary angiography by 64-row ct. N Engl J Med. 2008;359:2324–2336. doi: 10.1056/NEJMoa0806576. [DOI] [PubMed] [Google Scholar]
- 2.Meijboom WB, Meijs MF, Schuijf JD, Cramer MJ, Mollet NR, van Mieghem CA, Nieman K, van Werkhoven JM, Pundziute G, Weustink AC, de Vos AM, Pugliese F, Rensing B, Jukema JW, Bax JJ, Prokop M, Doevendans PA, Hunink MG, Krestin GP, de Feyter PJ. Diagnostic accuracy of 64-slice computed tomography coronary angiography: A prospective, multicenter, multivendor study. J Am Coll Cardiol. 2008;52:2135–2144. doi: 10.1016/j.jacc.2008.08.058. [DOI] [PubMed] [Google Scholar]
- 3.Varnauskas E. Long-term results of prospective randomized study of coronary-artery bypass-surgery in stable angina-pectoris. Lancet. 1982;2:1173–1180. [PubMed] [Google Scholar]
- 4.Fisher L. Coronary-artery surgery study (cass) - a randomized trial of coronary-artery bypass-surgery - survival-data. Circulation. 1983;68:939–950. doi: 10.1161/01.cir.68.5.939. [DOI] [PubMed] [Google Scholar]
- 5.Bartunek J, Sys SU, Heyndrickx GR, Pijls NH, De Bruyne B. Quantitative coronary angiography in predicting functional significance of stenoses in an unselected patient cohort. J Am Coll Cardiol. 1995;26:328–334. doi: 10.1016/0735-1097(95)80003-y. [DOI] [PubMed] [Google Scholar]
- 6.Zir LM, Miller SW, Dinsmore RE, Gilbert JP, Hawthorne JW. Interobserver variability in coronary angiography. Circulation. 1976;53:627–632. doi: 10.1161/01.cir.53.4.627. [DOI] [PubMed] [Google Scholar]
- 7.Detre KM, Wright E, Murphy ML, Takaro T. Observer agreement in evaluating coronary angiograms. Circulation. 1975;52:979–986. doi: 10.1161/01.cir.52.6.979. [DOI] [PubMed] [Google Scholar]
- 8.DeRouen TA, Murray JA, Owen W. Variability in the analysis of coronary arteriogram. Circulation. 1977;55:324–328. doi: 10.1161/01.cir.55.2.324. [DOI] [PubMed] [Google Scholar]
- 9.Di Carli M, Czernin J, Hoh CK, Gerbaudo VH, Brunken RC, Huang SC, Phelps ME, Schelbert HR. Relation among stenosis severity, myocardial blood flow, and flow reserve in patients with coronary artery disease. Circulation. 1995;91:1944–1951. doi: 10.1161/01.cir.91.7.1944. [DOI] [PubMed] [Google Scholar]
- 10.Topol EJ, Nissen SE. Our preoccupation with coronary luminology. The dissociation between clinical and angiographic findings in ischemic heart disease. Circulation. 1995;92:2333–2342. doi: 10.1161/01.cir.92.8.2333. [DOI] [PubMed] [Google Scholar]
- 11.Tobis JM, Mallery J, Mahon D, Lehmann K, Zalesky P, Griffith J, Gessert J, Moriuchi M, McRae M, Dwyer ML. Intravascular ultrasound imaging of human coronary arteries in vivo. Analysis of tissue characterizations with comparison to in vitro histological specimens. Circulation. 1991;83:913–926. doi: 10.1161/01.cir.83.3.913. [DOI] [PubMed] [Google Scholar]
- 12.Robbins SL, Rodrequez FL, Wragg AL, Fish SJ. Problems in quantitation of coronary atheroscelerosis. Am J Cardiol. 1966;18:153–159. doi: 10.1016/0002-9149(66)90026-9. [DOI] [PubMed] [Google Scholar]
- 13.Vlodaver Z, Frech R, Van Tassel RA, Edwards JE. Correlation of the antemortem coronary angiogram and the postmortem specimen. Circulation. 1973;47:162–169. doi: 10.1161/01.cir.47.1.162. [DOI] [PubMed] [Google Scholar]
- 14.White CW, Wright CB, Doty DB, Hiratza LF, Eastham CL, Harrison DG, Marcus ML. Does visual interpretation of the coronary arteriogram predict the physiologic importance of a coronary stenosis? N Engl J Med. 1984;310:819–824. doi: 10.1056/NEJM198403293101304. [DOI] [PubMed] [Google Scholar]
- 15.Bamberg F, Becker A, Schwarz F, Marcus RP, Greif M, von Ziegler F, Blankstein R, Hoffmann U, Sommer WH, Hoffmann VS, Johnson TR, Becker HC, Wintersperger BJ, Reiser MF, Nikolaou K. Detection of hemodynamically significant coronary artery stenosis: Incremental diagnostic value of dynamic ct-based myocardial perfusion imaging. Radiology. 2011;260:689–698. doi: 10.1148/radiol.11110638. [DOI] [PubMed] [Google Scholar]
- 16.Mahnken AH, Klotz E, Pietsch H, Schmidt B, Allmendinger T, Haberland U, Kalender WA, Flohr T. Quantitative whole heart stress perfusion ct imaging as noninvasive assessment of hemodynamics in coronary artery stenosis: Preliminary animal experience. Invest Radiol. 2010;45:298–305. doi: 10.1097/RLI.0b013e3181dfa3cf. [DOI] [PubMed] [Google Scholar]
- 17.Wang Y, Qin L, Shi X, Zeng Y, Jing H, Schoepf UJ, Jin Z. Adenosine-stress dynamic myocardial perfusion imaging with second-generation dual-source ct: Comparison with conventional catheter coronary angiography and spect nuclear myocardial perfusion imaging. AJR Am J Roentgenol. 2012;198:521–529. doi: 10.2214/AJR.11.7830. [DOI] [PubMed] [Google Scholar]
- 18.Kono AK, Coenen A, Lubbers M, Kurata A, Rossi A, Dharampal A, Dijkshoorn M, van Geuns RJ, Krestin GP, Nieman K. Relative myocardial blood flow by dynamic computed tomographic perfusion imaging predicts hemodynamic significance of coronary stenosis better than absolute blood flow. Invest Radiol. 2014;49:801–807. doi: 10.1097/RLI.0000000000000087. [DOI] [PubMed] [Google Scholar]
- 19.Bindschadler M, Modgil D, Branch KR, La Riviere PJ, Alessio AM. Comparison of blood flow models and acquisitions for quantitative myocardial perfusion estimation from dynamic ct. Phys Med Biol. 2014;59:1533–1556. doi: 10.1088/0031-9155/59/7/1533. [DOI] [PMC free article] [PubMed] [Google Scholar]
- 20.Pijls NH, Uijen GJ, Hoevelaken A, Arts T, Aengevaeren WR, Ros HS, Fast JH, Van Leeuwen KL, Van der Werf T. Mean transit time for the assessment of myocardial perfusion by videodensitometry. Circulation. 1990;81:1331–1340. doi: 10.1161/01.cir.81.4.1331. [DOI] [PubMed] [Google Scholar]
- 21.Ho KT, Chua KC, Klotz E, Panknin C. Stress and rest dynamic myocardial perfusion imaging by evaluation of complete time-attenuation curves with dual-source ct. JACC Cardiovasc Imaging. 2010;3:811–820. doi: 10.1016/j.jcmg.2010.05.009. [DOI] [PubMed] [Google Scholar]
- 22.Rossi A, Merkus D, Klotz E, Mollet N, de Feyter PJ, Krestin GP. Stress myocardial perfusion: Imaging with multidetector ct. Radiology. 2014;270:25–46. doi: 10.1148/radiol.13112739. [DOI] [PubMed] [Google Scholar]
- 23.Weininger M, Schoepf UJ, Ramachandra A, Fink C, Rowe GW, Costello P, Henzler T. Adenosine-stress dynamic real-time myocardial perfusion ct and adenosine-stress first-pass dual-energy myocardial perfusion ct for the assessment of acute chest pain: Initial results. Eur J Radiol. 2012;81:3703–3710. doi: 10.1016/j.ejrad.2010.11.022. [DOI] [PubMed] [Google Scholar]
- 24.Greif M, von Ziegler F, Bamberg F, Tittus J, Schwarz F, D’Anastasi M, Marcus RP, Schenzle J, Becker C, Nikolaou K, Becker A. Ct stress perfusion imaging for detection of haemodynamically relevant coronary stenosis as defined by ffr. Heart. 2013;99:1004–1011. doi: 10.1136/heartjnl-2013-303794. [DOI] [PubMed] [Google Scholar]
- 25.Einstein AJ. Multiple opportunities to reduce radiation dose from myocardial perfusion imaging. Eur J Nucl Med Mol Imaging. 2013;40:649–651. doi: 10.1007/s00259-013-2355-5. [DOI] [PMC free article] [PubMed] [Google Scholar]
- 26.Molloi S, Bednarz G, Tang J, Zhou Y, Mathur T. Absolute volumetric coronary blood flow measurement with digital subtraction angiography. Int J Cardiovas Imag. 1998;14:137–145. doi: 10.1023/a:1006059709539. [DOI] [PubMed] [Google Scholar]
- 27.Molloi S, Zhou Y, Kassab GS. Regional volumetric coronary blood flow measurement by digital angiography: In vivo validation. Academic Radiology. 2004;11:757–766. doi: 10.1016/j.acra.2004.04.002. [DOI] [PubMed] [Google Scholar]
- 28.Ziemer BP, Hubbard L, Lipinski J, Molloi S. Dynamic ct perfusion measurement in a cardiac phantom. Int J Cardiovas Imag. 2015;31:1451–1459. doi: 10.1007/s10554-015-0700-4. [DOI] [PMC free article] [PubMed] [Google Scholar]
- 29.Kern MJ, Lerman A, Bech JW, De Bruyne B, Eeckhout E, Fearon WF, Higano ST, Lim MJ, Meuwissen M, Piek JJ, Pijls NH, Siebes M, Spaan JA. Physiological assessment of coronary artery disease in the cardiac catheterization laboratory: A scientific statement from the american heart association committee on diagnostic and interventional cardiac catheterization, council on clinical cardiology. Circulation. 2006;114:1321–1341. doi: 10.1161/CIRCULATIONAHA.106.177276. [DOI] [PubMed] [Google Scholar]
- 30.Kern MJ, Samady H. Current concepts of integrated coronary physiology in the catheterization laboratory. J Am Coll Cardiol. 2010;55:173–185. doi: 10.1016/j.jacc.2009.06.062. [DOI] [PubMed] [Google Scholar]
- 31.Haridasan V, Nandan D, Raju D, Rajesh GN, Sajeev CG, Vinayakumar D, Muneer K, Babu K, Krishnan MN. Coronary sinus filling time: A novel method to assess microcirculatory function in patients with angina and normal coronaries. Indian Heart J. 2013;65:142–146. doi: 10.1016/j.ihj.2013.02.002. [DOI] [PMC free article] [PubMed] [Google Scholar]
- 32.Modat M, Ridgway GR, Taylor ZA, Lehmann M, Barnes J, Hawkes DJ, Fox NC, Ourselin S. Fast free-form deformation using graphics processing units. Comput Methods Programs Biomed. 2010;98:278–284. doi: 10.1016/j.cmpb.2009.09.002. [DOI] [PubMed] [Google Scholar]
- 33.Le H, Wong JT, Molloi S. Estimation of regional myocardial mass at risk based on distal arterial lumen volume and length using 3d micro-ct images. Comput Med Imaging Graph. 2008;32:488–501. doi: 10.1016/j.compmedimag.2008.05.002. [DOI] [PMC free article] [PubMed] [Google Scholar]
- 34.Le HQ, Wong JT, Molloi S. Allometric scaling in the coronary arterial system. Int J Cardiovas Imag. 2008;24:771–781. doi: 10.1007/s10554-008-9303-7. [DOI] [PubMed] [Google Scholar]
- 35.Lin LI. A concordance correlation coefficient to evaluate reproducibility. Biometrics. 1989;45:255–268. [PubMed] [Google Scholar]
- 36.Danad I, Uusitalo V, Kero T, Saraste A, Raijmakers PG, Lammertsma AA, Heymans MW, Kajander SA, Pietilä M, James S, Sörensen J, Knaapen P, Knuuti J. Quantitative assessment of myocardial perfusion in the detection of significant coronary artery diseasecutoff values and diagnostic accuracy of quantitative [15o]h2o pet imaging. J Am Coll Cardiol. 2014;64:1464–1475. doi: 10.1016/j.jacc.2014.05.069. [DOI] [PubMed] [Google Scholar]
- 37.Chen MY, Shanbhag SM, Arai AE. Submillisievert median radiation dose for coronary angiography with a second-generation 320-detector row ct scanner in 107 consecutive patients. Radiology. 2013;267:76–85. doi: 10.1148/radiol.13122621. [DOI] [PMC free article] [PubMed] [Google Scholar]
- 38.Huber AM, Leber V, Gramer BM, Muenzel D, Leber A, Rieber J, Schmidt M, Vembar M, Hoffmann E, Rummeny E. Myocardium: Dynamic versus single-shot ct perfusion imaging. Radiology. 2013;269:378–386. doi: 10.1148/radiology.13121441. [DOI] [PubMed] [Google Scholar]
- 39.Hagemann CE, Ghotbi AA, Kjær A, Hasbak P. Quantitative myocardial blood flow with rubidium-82 pet: A clinical perspective. Am J Nucl Med Mol Imaging. 2015;5:457–468. [PMC free article] [PubMed] [Google Scholar]
- 40.Baile EM, Paré PD, D’yachkova Y, Carere RG. Effect of contrast media on coronary vascular resistance: Contrast-induced coronary vasodilation. Chest. 1999;116:1039–1045. doi: 10.1378/chest.116.4.1039. [DOI] [PubMed] [Google Scholar]
- 41.Kurata A, Kawaguchi N, Kido T, Inoue K, Suzuki J, Ogimoto A, Funada J, Higaki J, Miyagawa M, Vembar M, Mochizuki T. Qualitative and quantitative assessment of adenosine triphosphate stress whole-heart dynamic myocardial perfusion imaging using 256-slice computed tomography. Plos One. 2013;8:e83950. doi: 10.1371/journal.pone.0083950. [DOI] [PMC free article] [PubMed] [Google Scholar]
- 42.Kitagawa K, George RT, Arbab-Zadeh A, Lima JA, Lardo AC. Characterization and correction of beam-hardening artifacts during dynamic volume ct assessment of myocardial perfusion. Radiology. 2010;256:111–118. doi: 10.1148/radiol.10091399. [DOI] [PubMed] [Google Scholar]


