

Abstract
Background
Standard repetitive transcranial magnetic stimulation (rTMS) devices generate bidirectional biphasic sinusoidal pulses that are energy efficient, but may be less effective than monophasic pulses that induce a more unidirectional electric field. To enable pulse shape optimization, we developed a controllable pulse parameter TMS (cTMS) device.
Objective
We quantified changes in cortical excitability produced by conventional sinusoidal bidirectional pulses and by three rectangular-shaped cTMS pulses, one bidirectional and two unidirectional (in opposite directions), and compared their efficacy in modulating motor evoked potentials (MEPs) produced by stimulation of motor cortex.
Methods
Thirteen healthy subjects completed four sessions of 1 Hz rTMS of the left motor cortex. In each session, the rTMS electric field pulse had one of the four shapes. Excitability changes due to rTMS were measured by applying probe TMS pulses before and after rTMS, and comparing resultant MEP amplitudes. Separately, we measured the latency of the MEPs evoked by each of the four pulses.
Results
While the three cTMS pulses generated significant mean inhibitory effects in the subject group, the conventional biphasic cosine pulses did not. The strongest inhibition resulted from a rectangular unidirectional pulse with dominant induced current in the posterior–anterior direction. The MEP latency depended significantly on the pulse shape.
Conclusions
The pulse shape is an important factor in rTMS-induced neuromodulation. The standard cosine biphasic pulse showed the smallest effect on cortical excitability, while the greatest inhibition was observed for an asymmetric, unidirectional, rectangular pulse. Differences in MEP latency across the various rTMS pulse shapes suggest activation of distinct subsets of cortical microcircuitry.
Keywords: Repetitive transcranial magnetic stimulation, cTMS, inhibitory, low frequency, pulse shape, latency
Introduction
Transcranial magnetic stimulation (TMS) is an established technique for noninvasive brain stimulation. In addition to evoking action potentials in neurons with single strong magnetic pulses, repetitive TMS (rTMS) protocols modulate the endogenous activity of brain circuits by either increasing or reducing excitability (1–3). Neuromodulation with rTMS is an indispensable technique in experimental brain sciences (4–6) and a promising tool in neurology and psychiatry that is FDA-approved for the treatment of depression (7–15).
Although rTMS serves well as a noninvasive tool for studying basic scientific questions in sufficiently large subject groups, the strength of neuromodulatory effects is relatively low and competes with often stronger ongoing endogenous activity in the brain, resulting in substantial variability of the neuromodulatory effects within and across subjects (16–20). This is unfortunate for both neuroscientific and therapeutic applications, where strong and reliable effects are desired. However, neuromodulatory effects in in-vivo and in-vitro animal studies suggest that stronger effects may be possible (21–24).
Various parameters of rTMS have been studied to increase efficacy (25–29), including pulse repetition rate (21,30–32) and coil size and shape (33). In comparison, the influence of the pulse shape, i.e., the coil current or the induced electric field waveform as a function of time, has been considered only within narrow limits (34–41). This has been due primarily to technological reasons, as currently available devices can only generate a few distinct pulse shapes (42). At present, rTMS neuromodulation is almost exclusively induced with sinusoidal biphasic pulses, although experiments in the primary motor cortex have shown that this pulse shape has a relatively low neuromodulation strength relative to other shapes, such as sinusoidal monophasic (2,34,38–41). Unfortunately, pulse shapes that are more effective cannot be generated at train frequencies greater than approximately 1–2 Hz with standard devices (43,44). Furthermore, the parameter space of pulse shapes has barely been explored, again primarily due technological limitations, and it is unknown which characteristics render a pulse more effective or how pulses could be optimized.
To address these technological limitations we developed a controllable pulse parameter TMS (cTMS) device that enables the efficient generation of pulses with various shapes (45,46). In the present study, we used a cTMS device and a standard rTMS device to stimulate motor cortex to compare the average effects on motor evoked potentials (MEPs) amplitude of 1 Hz trains of several novel types of pulse shapes with the standard biphasic sinusoidal pulse. rTMS with 1 Hz trains tends to have an inhibitory effect, and is therefore a relatively safe paradigm to explore novel pulse shapes with unknown effects. We programmed the cTMS device to produce a rectangular bidirectional pulse shape, as well as a rectangular predominantly unidirectional pulse shape with amplitudes of the anterior–posterior (AP) and posterior–anterior (PA) electric field phases that differed by more than five fold. These pulses were designed such that they can be generated efficiently using cTMS at high repetition rates in subsequent excitatory mono-frequency and theta-burst protocols (47–49).
In addition, there are various options for probing the cortical excitability change in MEPs from pre to post rTMS intervention, and there is currently no consensus on the best approach. While several studies compared different rTMS pulse shapes by probing MEP excitability with the pulse type used for the rTMS intervention (35,38,39), others use the same monophasic shape for the test probe regardless of the rTMS condition (40,50–52). However, the apparent excitability change resulting from rTMS can vary when detected with different probing pulse types (18,34). Specifically, in inhibitory protocols, monophasic probing pulses result in larger apparent changes in MEP amplitude than biphasic probing pulses. To our knowledge, the effects of the directionality of the probing pulses have not yet been studied, and therefore we quantified the influence of different probing pulse conditions (directionality and amplitude) in pre- and post-intervention testing.
Materials and Methods
Subjects
21 healthy subjects (median age 21, age range 18–48 years, 14 female, 7 male, all right-handed) were recruited and provided written informed consent. The study was approved by the Duke University Medical School IRB. Subjects were excluded if they had a history of any Axis I DSM-IV psychiatric disorder including substance abuse or dependence, as well as any current medications or history of any neurological disease or other illness that would present a risk with TMS or would potentially confound effects of TMS on cortical excitability. All subjects were screened with urine drug tests to verify reported use. Women of childbearing capacity underwent a pregnancy test. Subjects were tested for right-handedness (modified Edinburgh handedness questionnaire). Thirteen subjects completed all rTMS sessions of the study (8 female, 5 male, age range 18–44). The other eight subjects dropped out or were excluded due to very high stimulation thresholds that precluded implementation of the experimental procedure (3 subjects), repeated no-shows, or withdrawal for personal reasons. Participants were questioned concerning side effects of TMS in each TMS session.
Study design
The study comprised five sessions. In the first session, we applied single TMS pulses spaced at least 7 s apart to the left primary motor cortex to familiarize the subject with the setup, test tolerability, determine motor thresholds, measure motor evoked potential (MEP) latencies, and calibrate the robotic coil holder for the study (see below). In the remaining four sessions, we tested four different rTMS pulse conditions in the primary motor cortex. Each of these sessions was performed exclusively with a different rTMS pulse shape so that every subject received all four conditions. The sequence of the conditions within a subject was counterbalanced across subjects. The effectiveness of counterbalancing was ascertained with a nominal logistic model with session number as independent variable and rTMS type as dependent variable as well as a Pearson Chi2 test, none of which were significant (p > 0.577 and p > 0.630, respectively). The rTMS sessions were at least five days apart, and started approximately at the same time of day for each subject (± 1 h).
Repetitive TMS
In each rTMS session, after estimation of the motor threshold and coil positioning, subjects received 80 test pulses, taking about 13 minutes, followed by a 1000 s (16 min, 40 s) rTMS train. This was immediately followed by a series of 180 test pulses, which took approximately 30 minutes (see Figure 1).
Figure 1.
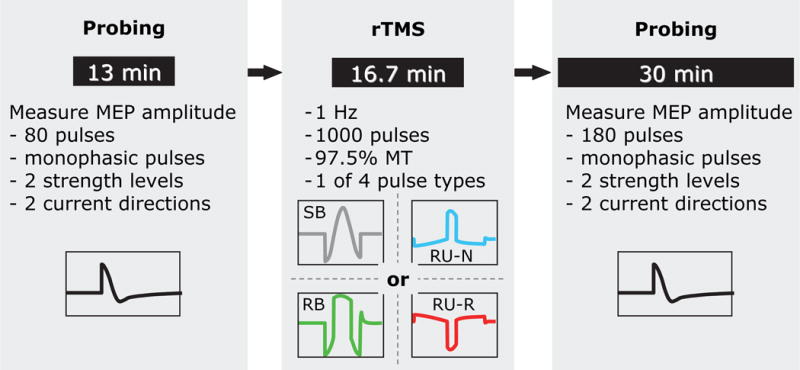
Structure of the rTMS sessions: the rTMS intervention, which uses one of four pulse shapes in a 1 Hz, 1000 pulse train at 97.5% of resting motor threshold (MT), is preceded by an approximately 13 minute excitability probing train (80 pulses comprising equal numbers of four different probing pulse conditions) to establish a baseline. A corresponding probing train (180 pulses) is applied immediately after the rTMS intervention to quantify excitability changes. The rTMS and probing pulse shapes are defined and illustrated in Figure 2.
The rTMS interventions consisted of 1000 pulses of one of the four rTMS pulse types at a pulse rate of 1 Hz with a stimulation strength of 97.5% of the individual resting motor threshold, defined as the pulse amplitude producing an average peak-to-peak MEP amplitude of 50 μV. This choice of pulse amplitude was based on the following considerations. Prior studies of similar design showing stronger inhibitory effect of monophasic versus biphasic sinusoidal pulses were conducted at subthreshold intensity (90% of resting motor threshold) (34,35). On the other hand, for biphasic pulses, as in this study, inhibitory effects have been reported for stimulation strengths between 90% and 125% of motor threshold (1,3,19,33,35,52–56), with evidence that stronger rTMS stimuli are more effective (52,57,58). Therefore, we chose to use a stimulus intensity that is higher than 90% of motor threshold, potentially increasing the likelihood of significant inhibitory effects, but that is not too high so as not to saturate possible pulse-shape-dependent selective neural recruitment effects in the cortex and to limit spinal modulation effects (19,59). Of course, the motor threshold is not an abrupt cutoff for motor responses but is rather a point on the continuous recruitment curve that corresponds to a specific but arbitrary average MEP amplitude (50 μV here, as standard in TMS). Thus, our choice of stimulus intensity is one of many possible levels on the motor recruitment curve that is within the range for reported inhibitory effects.
The four different rTMS pulses (see Figure 2) comprise
SB: the conventional sinusoidal biphasic bidirectional (similar electric field amplitude in both polarities) pulse with initially AP induced current direction, 296 μs pulse duration;
RB: a rectangular bidirectional pulse with initially AP induced current direction and a total pulse duration of 323 μs;
RU-N: a rectangular unidirectional pulse, i.e., with unequal electric field phase amplitudes so that a dominant phase is formed, with initially AP induced current direction and a total pulse duration of 577 μs; and
RU-R: the unidirectional pulse from (c) with initially PA induced current direction.
Figure 2.
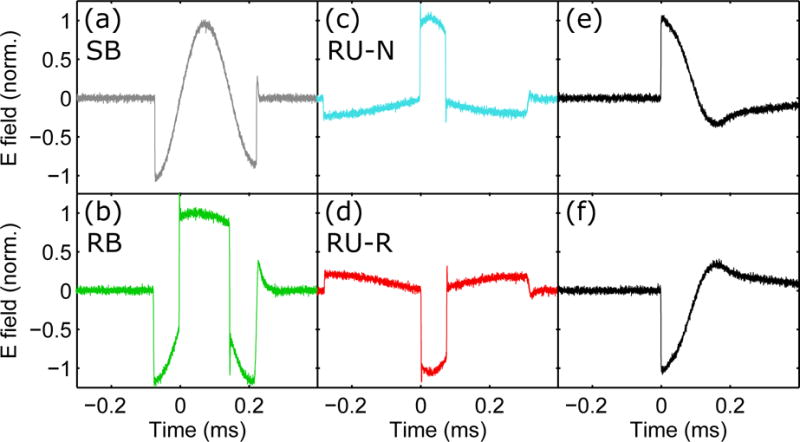
Recorded electric field waveforms of the four rTMS pulses (a)–(d) and the two probing pulses (e)–(f): (a) conventional sinusoidal bidirectional, SB; (b) rectangular bidirectional, RB; (c) rectangular unidirectional with initial anterior–posterior (AP) induced current, RU-N; (d) rectangular unidirectional with initial posterior–anterior (PA) induced current, RU-R; and (e), (f) conventional sinusoidal monophasic pulse with PA and AP initial induced current, respectively. The pulse amplitude was normalized to unity for all pulses. Positive and negative electric field values correspond respectively to PA and AP direction of the current induced in the brain under the center of the figure-of-eight coil.
Note that all these pulses correspond to biphasic magnetic pulses; the electric field phase amplitudes are manipulated by changing the magnetic field rise and fall times (46). Phases with positive polarity in Figure 2 correspond to induced current flowing in the PA direction in the brain under the center of the figure-of-eight coil, whereas phases with negative polarity correspond to induced current in the AP direction.
Cortical excitability probing with single-pulse TMS
In every rTMS session, the excitability change due to the rTMS intervention was detected by comparing the amplitude of MEPs evoked by probing pulses before and after the rTMS train. In accordance with conventional TMS protocols, these probing pulses had a monophasic shape (Magventure Magpro X100 Option, rise time 104 μs) (34,40,50,52,60). To detect potential effects of the probing pulse parameters on the detection of excitability changes, we used four probing conditions: probing pulses were applied in both current directions induced in the brain (AP and PA) and at different stimulation levels (baseline MEP amplitude of approximately 750 μV and 1200 μV). For the baseline excitability level, 20 probing pulses of each type were administered in an interleaved manner with pseudo-random order before the rTMS intervention so that the test pulses of each probing condition were spread throughout the probing interval. Similarly, post-intervention probing was started immediately after each rTMS intervention and comprised 45 interleaved and pseudo-randomized probing pulses of each of the four conditions (both current directions, each with two different stimulation levels) for a total of 180 pulses. The inter-pulse timing of the probing pulses was jittered to reduce expectation effects and ranged between 8 s and 12 s.
TMS devices, targeting, and thresholding
The biphasic pulse (SB) for rTMS and the monophasic probing pulses are conventional pulses and were generated with a commercial MagVenture MagPro X100 in standard and power mode, respectively. A repetitive cTMS device, custom built in our lab, provided the other three rTMS pulses (i.e., RB, RU-N, RU-R), which conventional stimulators cannot generate (42).
Both probing and rTMS pulses were applied with the same figure-of-eight coil (MagVenture Cool-B65 with liquid cooling). The coil was positioned at the location over left primary motor cortex that led to the strongest MEPs in the right first dorsal interosseus (FDI) muscle, using a systematic search. The coil was oriented approximately 45° to the midline of the head with the coil handle pointing posteriorly. This coil position was used for all TMS conditions, while changes in current direction were controlled by the stimulation devices.
A robotic system with adaptive positioning (ANT Neuro, Enschede, Netherlands) was used to hold the coil at the position identified initially for maximum FDI response and to compensate minor head movements of the subjects. In addition, all subjects were instructed to sit as still as possible and avoid head movements. The coil position relative to the target was constantly monitored with an additional stereotactic neuronavigation system (Brainsight, Rogue Research, Montreal, Canada). All pulses, including thresholding, probing, and rTMS, were applied under robot positioning.
The resting motor threshold corresponding to 50 μV peak-to-peak MEP amplitude and the probing levels were detected with an adaptive maximum-likelihood threshold estimator (61–63). The optimal stimulation site, probing pulse levels, and resting motor threshold were individually reestablished and refined using EMG at the beginning of each session.
Electromyography
Electromyographic (EMG) recording of MEPs in the right FDI muscle was conducted with Ag/AgCl foam electrodes (Kendall 133, Covidien LLC, Mansfield, USA) and an EMG amplifier (K800 with a SX230FW pre-amplifier, Biometrics Ltd., Gwent, UK). The MEPs were sampled with 16 bit resolution at 5 kHz, and stored for analysis. Recordings that showed activity of more than 40 μV peak-to-peak amplitude within the 200 ms interval immediately before the TMS pulse were marked as facilitated and excluded from the analysis.
MEP latency analysis
The onset latencies of MEPs produced with the four different pulse types used for rTMS were measured in the first session to provide evidence for potentially different activation sites in motor cortex neurons due to the pulse shape that could explain potential differences in their rTMS neuromodulatory effects. Test pulses were applied as widely-spaced single pulses with pseudo-randomized inter-stimulus intervals as described above to counteract the subjects’ expectancy. Since for rTMS the four pulse shapes are administered at stimulation strength slightly below motor threshold, we measured the onset latency of the MEPs at each pulse’s individual motor threshold. In addition, we measured the MEP latency at stimulation strength that evokes MEPs with a peak-to-peak amplitude of approximately 1 mV. This latency measure is more common in the literature, although it is likely associated with stimulation of additional neuron populations compared to motor-threshold-level TMS, since the MEP is close to saturation for some subjects and known to evoke different I-wave components than stimulation at the resting motor threshold (64,65). The onset of an MEP was defined as that time point after the TMS pulse where the EMG signal exceeded the +/− 20 μV band the last time before the first of the two peaks of the MEP. This detection level was a compromise between avoiding false triggering from EMG noise and, on the other hand, detecting small MEP amplitudes. EMG recordings without a detectable MEP were excluded from the latency estimation.
All latencies are referenced to the respective TMS pulse’s dominant phase for neural activation (see time zero in Figure 2). For all of the rTMS pulses, the dominant electric field phase is the second one (42,66). This definition is intended to eliminate latency differences that are caused by the long, low-amplitude leading phases of the unidirectional pulses that are not expected to trigger neural activation.
Statistical Analysis
For high sensitivity of the statistical analysis, we took into account every single sample without averaging. To normalize the known skewness of MEP data, we log-transformed all MEP peak-to-peak amplitudes (67–70). Subsequently, we normalized the log-transformed post-intervention amplitudes by the log-transformed mean of the corresponding pre-intervention amplitudes for each subject, session, and probing condition (current direction and stimulation level). To evaluate the time course of the neuromodulatory effect and the contribution of the various factors, we used a mixed–effects model for the post-intervention probing MEPs with subject as a random factor and gender, rTMS pulse type, post-intervention time, probing pulse current direction, as well as probing pulse stimulation strength as fixed factors. Furthermore, we included the interactions of the rTMS pulse type with probing pulse current direction and probing pulse stimulation strength, respectively. For post-hoc analysis, we applied Tukey’s range test.
While the mixed-effects model shows whether there is significant variation of the MEP amplitude over time, it does not provide significance of the MEP changes at specific time points. Therefore, to contrast the time course of the modulatory effect after rTMS, we averaged the log-transformed and normalized MEP amplitudes within several time bins. Binning is the most common analysis approach in the TMS literature (25,33,34,38–40,56). To evaluate the immediate effects of rTMS, we averaged the MEPs from the first 3.3 minutes after the end of the stimulation train (20 pulses), for each subject and session. To explore the time course of the aftereffects, the MEP data were further averaged into three 10-minute bins starting at the end of rTMS. We used a Wilcoxon rank test for an analysis of the MEP amplitude change relative to baseline in the averaged time bins.
We used a mixed effects model and post-hoc Tukey’s range test to analyze the motor threshold and MEP latency data. To separate pulse-specific threshold and latency differences from individual differences, we treated TMS pulse shape as a fixed effect and subjects as a random effect.
Results
Side effects
All rTMS conditions were well tolerated by the subjects. The subjects reported few side effects: across 81 total sessions, there was 1 report of mild headache and 13 of mild-to-moderate stiff neck/neck pain. Of the side effects that were reported, those occurring with rTMS using the three novel pulse shapes did not differ significantly from rTMS with the conventional pulse. rTMS pulse type showed no significant influence on neck pain (F(4, 56) = 0.73; p = 0.58). No scalp pain, impaired cognition, concentration problems, or acute mood changes were reported.
Motor threshold and MEP latency
The resting motor thresholds as percentage of the respective machine’s maximum output were 50.5% ± 10.0% (mean ± standard deviation) for SB pulses, 34.1% ± 6.0% for RB, 28.8% ± 5.5% for RU-N, and 39.8% ± 7.9% RU-R. The corresponding peak voltage at maximum output is 1800 V for the MagVenture MagPro device, which is used for SB pulses, and 2800 V for the cTMS device, which is used for RB, RU-N, and RU-R pulses. The motor thresholds, converted to pulse amplitude in volts so they can be compared between the two devices, are summarized in Figure 3(a). The pulse type had significant influence on the motor threshold (F(3, 47.1) = 62.1; p < 0.001). Notably, the RU-N and RU-R pulses had significantly different motor thresholds according to the post-hoc tests (p < 0.001), supporting the notion that the RU pulse is indeed highly unidirectional.
Figure 3.
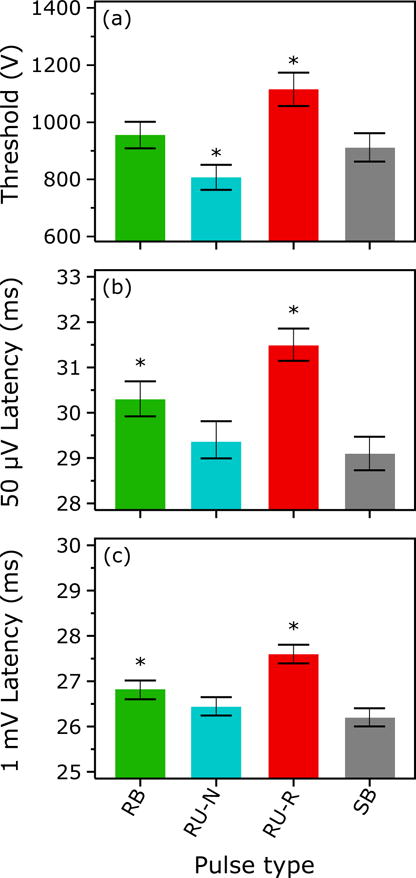
(a) Resting motor thresholds of the four pulse shapes used for rTMS. The threshold is measured as the peak coil voltage to enable comparison between the two different TMS pulse generation devices (cTMS and MagPro) used in the study. (b) Corresponding MEP onset latencies detected in a single-pulse measurement at the resting motor threshold (50 μV peak-to-peak MEP amplitude) in the first session. (c) Same as (b) but for stimulation intensity corresponding to approximately 1 mV peak-to-peak MEP amplitude. Bars and whiskers indicate mean and standard error, respectively. Asterisk (*) indicates conditions that are significantly different from all other conditions (p < 0.05).
The MEP onset latencies for the four rTMS pulse types are reported in Figure 3(b) and (c) for approximately 50 μV and 1 mV MEPs, respectively. Figure S1 shows the raw EMG data for one subject to illustrate the latency differences. The pulse type had significant influence on the MEP onset latency (F(3, 714.3) = 31.4; p < 0.001 for 50 μV and F(3, 1081) = 132.9; p < 0.001 for 1 mV). The pulses formed three significantly different groups determined by the post-hoc test (p < 0.015): The earliest responses were evoked by the SB (on average 29.1 ms for 50 μV and 26.2 ms for 1 mV) and the RU-N pulses (29.4 ms for 50 μV and 26.5 ms for 1 mV), forming the first group. The response to the RB pulse (30.3 ms for 50 μV and 26.8 ms for 1 mV), forming the second group, arrived approximately a millisecond later. The last group was formed by the responses to the RU-R pulses (31.5 ms for 50 μV and 27.6 ms for 1 mV), which occurred approximately another millisecond later.
Neuromodulatory effects
The mixed effects model of the averaged MEPs showed significant influence of the rTMS pulse type (F(3, 8921) = 18; p < 0.001), time (F(1, 8920) = 22; p < 0.001), probing pulse current direction (F(1, 8921) = 8; p < 0.006), and the interaction of probing pulse level and rTMS pulse type (F(3, 8920) = 7; p < 0.001). The post-hoc test showed that the four rTMS pulses can be separated into three significantly different groups by their neuromodulatory effect (p < 0.02): The RU-N rTMS pulse showed the strongest inhibition, followed by the RU-R and the RB pulses with approximately the same effect, and the conventional SB pulse inducing weakest inhibition (Figure 4). Gender (F(1, 11) = 0.0177; p = 0.90), the probing pulse level by itself (F(1, 8921) = 0.41; p = 0.52), or the interaction of probing pulse direction and rTMS pulse type ((F(3, 8921) = 0.23; p = 0.08) did not appear to influence the outcome.
Figure 4.
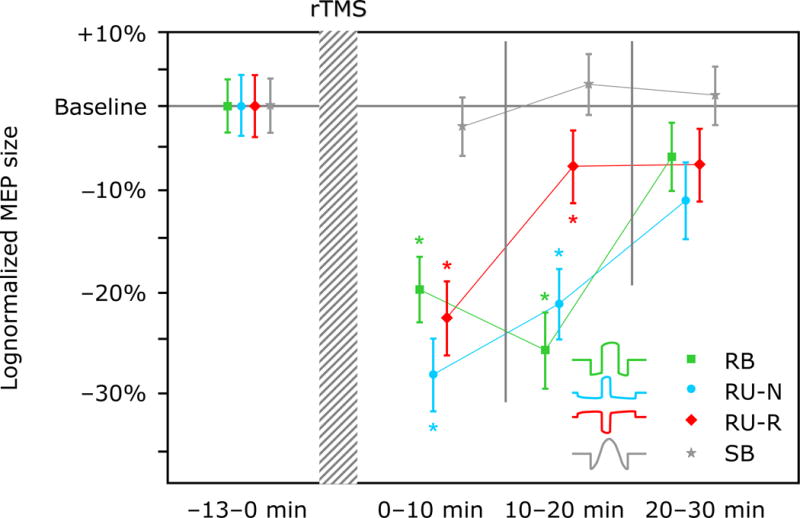
Percentage change of average MEP amplitude relative to baseline after rTMS with each of the four different pulse shapes. The MEP data is binned and log-averaged over three intervals of approximately 10 min duration. Markers and whiskers indicate logmean and lognormal standard error, respectively. Asterisk (*) indicates conditions that are significantly different from baseline (p < 0.05).
We found inhibitory effects, manifested as a reduction of the average post-intervention MEP amplitude, of at least ten minutes duration in three of the four rTMS conditions (both unidirectional and the bidirectional cTMS pulses). The Wilcoxon rank test indicated that within the first three-minute bin after the rTMS intervention, there were significant reductions of the excitability for RB, RU-N, and RU-R pulses. The reductions amounted to −14.5% (p = 0.078) for RB, −33.0% (p < 0.001) for RU-N, and −24.5% (p = 0.002) for RU-R. For the conventional SB pulse, there was a nonsignificant average increase of 2.87% (p = 0.245). As illustrated in Figure 4, the MEP size averaged over the first three bins changed relative to baseline by −20.3% (p < 0.001) for RB, −28.4% (p < 0.001) for RU-N, and −23.2% (p < 0.001) for RU-R, while for SB there was a nonsignificant change by −2.46% (p = 0.100). During this time interval, we observed a reduction of the log average MEP amplitude by more than 5.0% (more than 20% in parentheses) in only 4 (3) subjects for the standard SB rTMS, compared to 10 (8) for RU-N, 10 (6) for RU-R, and 8 (4) for RB. In fact, 6 (3) subjects exhibited an increase of the average MEP amplitude of more than 5.0% (20%) for SB rTMS, compared to 3 (2) for RU-N, 2 (1) for RU-R, and 4 (2) for RB. Figure 4 further shows that the significant inhibitory effects after rTMS disappear for all but the RB pulse condition in the second 10 min interval. By the last 10 min interval, the MEP amplitude averages of RB, RU-N, and RU-R are below the baseline and of SB are above the baseline, although none is significant.
Over time, the MEP amplitudes for all four rTMS conditions returned to the vicinity of baseline. There was a nonsignificant trend for different rates of the neuromodulation wash-out across the pulse conditions. It was slowest for the conventional SB pulse and faster for the other three pulse types, which were similar to each other. The RB condition showed a trend for increasing inhibition in the second 10 min interval compared to the first 10 min interval after rTMS. Due to the log-transformation, linear slopes correspond to exponential decays.
Figure 5 shows the average effect of the four different probing pulse conditions across the entire post-rTMS probing period. The strongest inhibitory effect was detected with the monophasic PA probing pulse, and was significantly different from the MEP amplitude change seen with the AP probing pulses (p < 0.006; see Figure 5(a)). Further, there was a significant interaction of probing level and rTMS pulse type. For all but the RU-N condition, the high strength probing pulses detected more inhibition than the weaker probing pulses, but this effect was significant only for the RB rTMS pulse (p = 0.008). For the RU-N pulse there was an opposite, nonsignificant trend.
Figure 5.
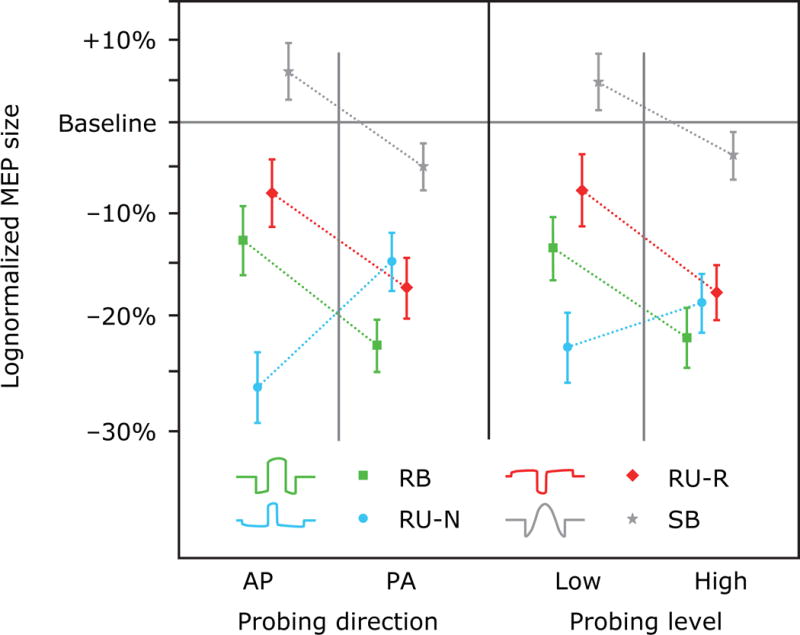
Influence of (a) the probing direction (AP vs. PA) and (b) the probing pulse level on the MEP amplitude change after rTMS with each of the four pulse shapes. Markers and whiskers indicate logmean and lognormal standard error, respectively.
Discussion
Effect of pulse characteristics on neuromodulation strength
In the present study, we altered the shape of biphasic magnetic pulses in a controlled manner for the first time using a cTMS device. The novel unidirectional as well as bidirectional rectangular electric field pulses applied to motor cortex at 1 Hz generated greater inhibition of subsequent MEP amplitude than the standard SB pulse, which did not produce a significant change in excitability in the primary motor cortex. The lack of reliable inhibitory effects using SB pulses in 1 Hz rTMS is consistent with reports in the literature, which indicate that the effects are variable and subtle compared to endogenous excitability changes, and often not detected at all (17,34,38–41,71). As well, our finding of superior effectiveness of unidirectional shapes is supported by the literature: A high asymmetry of the electric field amplitude in the two polarities of a pulse is also a characteristic of the standard monophasic pulse, which is reported to be more effective than biphasic rTMS pulses in the majority of excitatory (38–40) and inhibitory (34,35,41) paradigms.
The conventional monophasic pulse, however, has the limitation that it cannot be generated at high repetition rates with available devices. The reason for that limitation is the high power requirement and heat dissipation associated with the conventional circuit for generating the monophasic pulse (42). The novel approach taken in this study was to generate biphasic magnetic pulses with different rise and fall times, resulting in differing degrees of bidirectionality (45,46). The more unidirectional of these pulses (RU-N and RU-R) have electric fields similar to conventional monophasic pulses, but can be generated at higher repetition rates with the existing cTMS device. Alternative approaches could involve device developments that would allow the generation of unidirectional monophasic pulses at high repetition rates. In principle, the cTMS device power supply could be modified to accomplish this, or a novel circuit topology that allows the efficient generation of virtually any pulse shape could be deployed (42,45,46,72).
With the high asymmetry in the unidirectional shape, another parameter gains importance: the electric field direction of a pulse. In the present study, the rectangular unidirectional pulse that was most effective in producing inhibition was asymmetric in its effects, i.e., the induced electric field in one direction (RU-N) produced stronger inhibition than that in the other (RU-R). Notably, the absolute electric field strength of the less effective unidirectional pulse (RU-R) was greater than that of the more effective one (RU-N) since the motor threshold of the former was higher. Thus, higher absolute field strength of the pulse did not result in stronger inhibition in this case. The different neuromodulatory effect could have occurred for reasons of the spatial relation between the induced current direction and the predominant axon geometry and orientation of the neurons in the stimulated region. This hypothesis is also supported by the different MEP onset latencies of the two current directions of the unidirectional pulse, which argues for different activation sites. However, pulse direction comparisons in the literature are not consistent. While some studies show a trend that the AP monophasic pulse direction generates stronger effects (36), others report equal (39) or stronger effects for the PA induced current direction (38). The inconsistency among outcomes raises the question whether the average difference in effects with the two current directions is small compared to endogenous excitability fluctuations; whether other parameters which may vary across studies, such as stimulation strength or probing pulse type as well as directionality, modulate the effects; or whether the detection method, i.e., probing with test pulses, is not sensitive enough.
An explanation of our observation that rectangular pulses, including the bidirectional pulse, showed on average stronger effects than the conventional sinusoidal biphasic pulse, seems to be beyond what currently available models can provide, although features such as the sharp edges or the residual asymmetry in the bidirectional pulses could be contributing factors. However, further investigation is needed to see if the rectangular shape of the pulses is indeed an important factor, and in case it is, how this could be explained.
This study represents only one step in strengthening neuromodulatory effects through new pulse types. Our choice of rTMS train intensity, frequency, and duration constitute a single point in a large parameter space, within which we explored the effect of pulse shape with relatively arbitrary pulse designs. Like in other similar studies, our results are limited to the specific rTMS parameter choices. Furthermore, we did not characterize systematically the variability of the neuromodulatory effects within and between subjects. Nevertheless, taken together with other studies of rTMS-induced excitability changes, our results help to map out the wide parameter space. A systematic way to identify optima for neuromodulation strength will require a deeper understanding of the neural mechanisms involved, which could then be applied, for example, in a systematic optimization framework (73,74).
Effect of pulse characteristics on neural activation site
The onset latencies of the MEPs evoked by the four pulses used for rTMS were significantly different between some of the pulses. For the asymmetric, unidirectional pulse, the onset latency was also strongly dependent on current direction, with a delay between the two directions (RU-N and RU-R) of about two milliseconds. Such directionality differences were also observed using other pulse types (75–78).
The onset latency is thought to be a reliable measure of the site of action potential initiation in the cortical microcircuitry. The relative MEP delay is thought to reflect the number of synapses that the corticospinal volley has to traverse on its way from the cortex to the target muscle (64). According to that framework the pulses with lowest latencies, SB and RU-N, may (co-)activate directly axons closest to the upper motor neurons—potentially the upper motor neurons themselves or their excitatory inputs (64). The RB pulse, in contrast, with its delayed response could preferentially activate synaptic inputs of the latter two groups (64,79). Finally, the RU-R pulse may primarily affect even earlier, e.g., interneuron stages in the circuit.
The different onset latencies support the possibility that three of the four pulses chosen for rTMS activated different sites in the microcircuitry of the primary motor cortex at stimulation amplitudes around the resting motor threshold. Furthermore, the different activation sites may reflect separate function, i.e., inhibitory or excitatory input (64,80), and may lead to explanations of the different effects of neuromodulatory interventions with these pulses.
However, the latencies seen for the SB and RU-N pulses challenge such a classification. Despite their similar MEP latency, their rTMS effects were significantly different. This could have various reasons. For example, the onset latency could be determined by the activation site closest to the upper motor neuron, irrespective of additional, potentially dominant activation sites in the circuit that may be at another, earlier stage of the motor system, and that may differ between the two pulses.
Influence of probing pulses
Across three of the four rTMS pulse shapes (RB, RU-R, and SB), a stronger inhibition in MEP amplitude was observed to probing pulses with higher stimulation levels (see Figure 5(b)). This observation is compatible with earlier observations that rTMS affects the upper sections of input-output curves, i.e., MEPs in response to higher stimulation amplitudes, more strongly than the lower ones (18,81). Whereas these studies compared absolute MEP size changes and did not correct for the exponential characteristic of the I-O curve (67,68,82), we confirmed this relationship for the relative MEP changes in the log-transformed data. Gangitamo et al. speculate that such a MEP amplitude dependency may be the effect of a changed saturation level, which could be an indicator of the balance of inhibitory and excitatory influences in the motor cortex (18). Synaptic modulation of either inhibitory or excitatory circuits would accordingly shift the level. On the other hand, such an effect could also be explained by the model that rTMS mostly affects certain components of the corticospinal volleys such as later I-waves (65,83). Since these later I-waves have been found preferentially in response to stronger test stimuli (64,65,83), a suppression by inhibitory rTMS would affect preferentially MEP responses to these higher stimulation levels.
For RU-N rTMS the trend was reversed, i.e., stronger inhibition was detected for the lower probing level. This observation could potentially show that rTMS pulses stimulate and modulate different neuron populations since probing pulses with different stimulation strength are considered to recruit different corticospinal volleys (64). This interpretation is consistent with the fact that the RU-N pulse had the strongest neuromodulatory effect, implying a neural activation pattern different from that of the other rTMS pulses. However, it should be noted that subtle measurements such as the different effect of the rTMS pulses on the various probing conditions may be too fine to be measured robustly in our study if it is assumed that the relatively weak rTMS-induced neuromodulation effects were perturbed by strong endogenous excitability fluctuations. This may have been the case, given that the two probing levels were relatively close to one another due to the high slope of the corticospinal input–output curve. Across all subjects, the stronger probing TMS pulse had on average only 7% higher stimulation amplitude than the weaker one. Furthermore, the interaction of probing conditions and rTMS pulse types may have been strongly influenced by anatomy specific to each individual.
Finally, stronger inhibition was detected with PA monophasic probing pulses compared to the AP probing pulses. This observation may concur with a differential effect on certain components of the induced corticospinal volley. For example, the observation that AP monophasic pulses recruit later I-waves to a larger degree than their PA counterparts (64), would suggest that these two pulse conditions are probing different subsets of the cortical microcircuitry. On the other hand, the neural sites that generate the later I-waves were identified in some studies as the most responsive elements to conventional 1 Hz SB rTMS (83). A simple interpretation of these observations would suggest that we would expect the AP probing pulses to reveal a stronger neuromodulation effect, which is opposite to our findings, except for the RU-N condition. These observations underscore the complexity of the neural response to rTMS, its probing, as well as its analysis, and call for more detailed studies of the neuron-level activation and modulation patterns resulting from rTMS.
Conclusion
In this study, conventional sinusoidal biphasic pulses, which are presently the standard for rTMS neuromodulation in experimental brain research and medical therapy, had a lower effectiveness than rectangular rTMS pulse shapes in a 1 Hz inhibitory paradigm. The strongest inhibition was achieved with a pulse with a rectangular unidirectional electric field generated by a cTMS device. Furthermore, different rTMS pulse shapes may be activating distinct sites in the cortical microcircuitry, which could provide a potential explanation for the differences in neuromodulation efficacy. Overall, the higher effectiveness of novel pulse shapes is encouraging, but more research is required to understand the underlying basis for these differences. Enhanced mechanistic understanding could enable the design of even more effective pulses and translation of these paradigms to other cortical targets. Modeling the effects of the various pulses at both a local neuronal level and at a larger anatomical level, incorporating individual features of TMS targets, will likely play an important role in translation to clinical applications, especially in brain areas outside primary motor cortex. Finally, rTMS devices with flexible pulse shaping enable optimized neuromodulation paradigms and will help uncover underlying mechanisms.
Supplementary Material
Acknowledgments
This work was supported by a Duke-Coulter Translational Partnership Grant. The cTMS device used in the study was developed with support from NIH (R21EB006855), Columbia Technology Ventures Seed Fund, and Magstim Co. (hardware donation).
Financial Disclosure
S. M. Goetz, S. H. Lisanby, D. L. Murphy, and A. V. Peterchev are inventors on patents and patent applications on TMS technology. In the past 2 years, S. H. Lisanby has served as Principal Investigator on industry-sponsored research grants to Duke (ANS/St. Jude Medical, NeoSync, Brainsway); equipment loans to Duke (Magstim, MagVenture); is supported by grants from NIH (R01MH091083, 5U01MH084241, 5R01MH060884), Stanley Medical Research Institute, Brain and Behavior Research Foundation, and the Wallace H. Coulter Foundation; and has no consultancies, speakers bureau memberships, board affiliations, or equity holdings in related device industries. A. V. Peterchev has received research and travel support as well as patent royalties from Rogue Research for cTMS technology licensed to them, research and travel support from Tal Medical related to TMS technology, as well as a TMS equipment loan from MagVenture. B. Luber, I. C. Kozyrkov, and W. M. Grill report no relevant disclosures.
Footnotes
Parts of this work were presented in abstract form at the 52rd Meeting of the American College of Neuropsychopharmacology in 2013, Minnesota Neuromodulation Symposium in 2014, and IEEE EMBS BRAIN Grand Challenges Conference in 2014.
References
- 1.Chen R, Classen J, Gerloff C, et al. Depression of motor cortex excitability by low-frequency transcranial magnetic stimulation. Neurology. 1997;48:1398–1403. doi: 10.1212/wnl.48.5.1398. [DOI] [PubMed] [Google Scholar]
- 2.Pascual-Leone A, Valls-Solé J, Wassermann EM, et al. Responses to rapid-rate transcranial magnetic stimulation of the human motor cortex. Brain. 1994;117:847–858. doi: 10.1093/brain/117.4.847. [DOI] [PubMed] [Google Scholar]
- 3.Wassermann EM, Grafman J, Berry C, et al. Use and safety of a new repetitive transcranial magnetic stimulator. Electroencephalography and Clinical Neurophysiology/Electromyography and Motor Control. 1996;101:412–417. [PubMed] [Google Scholar]
- 4.Sandrini M, Umiltà C, Rusconi E. The use of transcranial magnetic stimulation in cognitive neuroscience: A new synthesis of methodological issues. Neuroscience & Biobehavioral Reviews. 2011;35:516–536. doi: 10.1016/j.neubiorev.2010.06.005. [DOI] [PubMed] [Google Scholar]
- 5.Dayan E, Censor N, Buch ER, et al. Noninvasive brain stimulation: from physiology to network dynamics and back. Nat Neurosci. 2013;16:838–844. doi: 10.1038/nn.3422. [DOI] [PMC free article] [PubMed] [Google Scholar]
- 6.Luber B, Lisanby SH. Enhancement of human cognitive performance using transcranial magnetic stimulation (TMS) NeuroImage. 2013 doi: 10.1016/j.neuroimage.2013.06.007. online preprint. [DOI] [PMC free article] [PubMed] [Google Scholar]
- 7.Johnson KA, Baig M, Ramsey D, et al. Prefrontal rTMS for treating depression: Location and intensity results from the OPT-TMS multi-site clinical trial. Brain Stimulation. 2013;6:108–117. doi: 10.1016/j.brs.2012.02.003. [DOI] [PMC free article] [PubMed] [Google Scholar]
- 8.Lisanby SH, Husain MM, Rosenquist PB, et al. Daily Left Prefrontal Repetitive Transcranial Magnetic Stimulation in the Acute Treatment of Major Depression: Clinical Predictors of Outcome in a Multisite, Randomized Controlled Clinical Trial. Neuropsychopharmacology. 2008;34:522–534. doi: 10.1038/npp.2008.118. [DOI] [PubMed] [Google Scholar]
- 9.Rosa MA, Lisanby SH. Somatic Treatments for Mood Disorders. Neuropsychopharmacology. 2012;37:102–116. doi: 10.1038/npp.2011.225. [DOI] [PMC free article] [PubMed] [Google Scholar]
- 10.O’Reardon JP, Solvason HB, Janicak PG, et al. Efficacy and Safety of Transcranial Magnetic Stimulation in the Acute Treatment of Major Depression: A Multisite Randomized Controlled Trial. Biol Psychiatry. 2007;62:1208–1216. doi: 10.1016/j.biopsych.2007.01.018. [DOI] [PubMed] [Google Scholar]
- 11.McClintock SM, Freitas C, Oberman L, et al. Transcranial Magnetic Stimulation: A Neuroscientific Probe of Cortical Function in Schizophrenia. Biol Psychiatry. 2011;70:19–27. doi: 10.1016/j.biopsych.2011.02.031. [DOI] [PMC free article] [PubMed] [Google Scholar]
- 12.Fitzgerald PB, Herring S, Hoy K, et al. A study of the effectiveness of bilateral transcranial magnetic stimulation in the treatment of the negative symptoms of schizophrenia. Brain Stimulation. 2008;1:27–32. doi: 10.1016/j.brs.2007.08.001. [DOI] [PubMed] [Google Scholar]
- 13.Lefaucheur J-P, Drouot X, Von Raison F, et al. Improvement of motor performance and modulation of cortical excitability by repetitive transcranial magnetic stimulation of the motor cortex in Parkinson’s disease. Clinical neurophysiology. 2004;115:2530–2541. doi: 10.1016/j.clinph.2004.05.025. [DOI] [PubMed] [Google Scholar]
- 14.Kim Y-H, You SH, Ko M-H, et al. Repetitive Transcranial Magnetic Stimulation–Induced Corticomotor Excitability and Associated Motor Skill Acquisition in Chronic Stroke. Stroke. 2006;37:1471–1476. doi: 10.1161/01.STR.0000221233.55497.51. [DOI] [PubMed] [Google Scholar]
- 15.Theodore W, Hunter K, Chen R, et al. Transcranial magnetic stimulation for the treatment of seizures A controlled study. Neurology. 2002;59:560–562. doi: 10.1212/wnl.59.4.560. [DOI] [PubMed] [Google Scholar]
- 16.Ridding MC, Ziemann U. Determinants of the induction of cortical plasticity by non-invasive brain stimulation in healthy subjects. J Physiol. 2010;588:2291–2304. doi: 10.1113/jphysiol.2010.190314. [DOI] [PMC free article] [PubMed] [Google Scholar]
- 17.Hamada M, Murase N, Hasan A, et al. The Role of Interneuron Networks in Driving Human Motor Cortical Plasticity. Cerebral Cortex. 2013;23:1593–1605. doi: 10.1093/cercor/bhs147. [DOI] [PubMed] [Google Scholar]
- 18.Gangitano M, Valero-Cabré A, Tormos JM, et al. Modulation of input–output curves by low and high frequency repetitive transcranial magnetic stimulation of the motor cortex. Clinical Neurophysiology. 2002;113:1249–1257. doi: 10.1016/s1388-2457(02)00109-8. [DOI] [PubMed] [Google Scholar]
- 19.Romero JR, Anschel D, Sparing R, et al. Subthreshold low frequency repetitive transcranial magnetic stimulation selectively decreases facilitation in the motor cortex. Clinical Neurophysiology. 2002;113:101–107. doi: 10.1016/s1388-2457(01)00693-9. [DOI] [PubMed] [Google Scholar]
- 20.Weisz N, Steidle L, Lorenz I. Formerly known as inhibitory: effects of 1-Hz rTMS on auditory cortex are state-dependent. European Journal of Neuroscience. 2012;36:2077–2087. doi: 10.1111/j.1460-9568.2012.08097.x. [DOI] [PubMed] [Google Scholar]
- 21.Bliss TVP, Lømo T. Long-lasting potentiation of synaptic transmission in the dentate area of the anaesthetized rabbit following stimulation of the perforant path. J Physiol. 1973;232:331–356. doi: 10.1113/jphysiol.1973.sp010273. [DOI] [PMC free article] [PubMed] [Google Scholar]
- 22.Abraham WC, Logan B, Greenwood JM, et al. Induction and experience-dependent consolidation of stable long-term potentiation lasting months in the hippocampus. The Journal of neuroscience. 2002;22:9626–9634. doi: 10.1523/JNEUROSCI.22-21-09626.2002. [DOI] [PMC free article] [PubMed] [Google Scholar]
- 23.Chen WR, Lee S, Kato K, et al. Long-term modifications of synaptic efficacy in the human inferior and middle temporal cortex. Proceedings of the National Academy of Sciences. 1996;93:8011–8015. doi: 10.1073/pnas.93.15.8011. [DOI] [PMC free article] [PubMed] [Google Scholar]
- 24.Gubellini P, Salin P, Kerkerian-Le Goff L, et al. Deep brain stimulation in neurological diseases and experimental models: From molecule to complex behavior. Progress in Neurobiology. 2009;89:79–123. doi: 10.1016/j.pneurobio.2009.06.003. [DOI] [PubMed] [Google Scholar]
- 25.Huang Y-Z, Edwards MJ, Rounis E, et al. Theta Burst Stimulation of the Human Motor Cortex. Neuron. 2005;45:201–206. doi: 10.1016/j.neuron.2004.12.033. [DOI] [PubMed] [Google Scholar]
- 26.Stefan K, Kunesch E, Cohen LG, et al. Induction of plasticity in the human motor cortex by paired associative stimulation. Brain. 2000;123:572–584. doi: 10.1093/brain/123.3.572. [DOI] [PubMed] [Google Scholar]
- 27.Thickbroom GW, Byrnes ML, Edwards DJ, et al. Repetitive paired-pulse TMS at I-wave periodicity markedly increases corticospinal excitability: A new technique for modulating synaptic plasticity. Clinical neurophysiology. 2006;117:61–66. doi: 10.1016/j.clinph.2005.09.010. [DOI] [PubMed] [Google Scholar]
- 28.Klimesch W, Sauseng P, Gerloff C. Enhancing cognitive performance with repetitive transcranial magnetic stimulation at human individual alpha frequency. European Journal of Neuroscience. 2003;17:1129–1133. doi: 10.1046/j.1460-9568.2003.02517.x. [DOI] [PubMed] [Google Scholar]
- 29.Hamada M, Terao Y, Hanajima R, et al. Bidirectional long-term motor cortical plasticity and metaplasticity induced by quadripulse transcranial magnetic stimulation. J Physiol. 2008;586:3927–3947. doi: 10.1113/jphysiol.2008.152793. [DOI] [PMC free article] [PubMed] [Google Scholar]
- 30.Larson J, Wong D, Lynch G. Patterned stimulation at the theta frequency is optimal for the induction of hippocampal long-term potentiation. Brain Research. 1986;368:347–350. doi: 10.1016/0006-8993(86)90579-2. [DOI] [PubMed] [Google Scholar]
- 31.Staubli U, Lynch G. Stable hippocampal long-term potentiation elicited by ‘theta’ pattern stimulation. Brain Research. 1987;435:227–234. doi: 10.1016/0006-8993(87)91605-2. [DOI] [PubMed] [Google Scholar]
- 32.Bear MF, Abraham WC. Long-Term Depression in Hippocampus. Annual Review of Neuroscience. 1996;19:437–462. doi: 10.1146/annurev.ne.19.030196.002253. [DOI] [PubMed] [Google Scholar]
- 33.Lang N, Harms J, Weyh T, et al. Stimulus intensity and coil characteristics influence the efficacy of rTMS to suppress cortical excitability. Clinical neurophysiology. 2006;117:2292–2301. doi: 10.1016/j.clinph.2006.05.030. [DOI] [PubMed] [Google Scholar]
- 34.Taylor JL, Loo CK. Stimulus waveform influences the efficacy of repetitive transcranial magnetic stimulation. Journal of Affective Disorders. 2007;97:271–276. doi: 10.1016/j.jad.2006.06.027. [DOI] [PubMed] [Google Scholar]
- 35.Sommer M, Lang N, Tergau F, et al. Neuronal tissue polarization induced by repetitive transcranial magnetic stimulation? Neuroreport. 2002;13:809–811. doi: 10.1097/00001756-200205070-00015. [DOI] [PubMed] [Google Scholar]
- 36.Sommer M, Norden C, Schmack L, et al. Opposite optimal current flow directions for induction of neuroplasticity and excitation threshold in the human motor cortex. Brain Stimulation. 2013;6:363–370. doi: 10.1016/j.brs.2012.07.003. [DOI] [PubMed] [Google Scholar]
- 37.Antal A, Kincses TZ, Nitsche MA, et al. Pulse configuration-dependent effects of repetitive transcranial magnetic stimulation on visual perception. Neuroreport. 2002;13:2229–2233. doi: 10.1097/00001756-200212030-00013. [DOI] [PubMed] [Google Scholar]
- 38.Tings T, Lang N, Tergau F, et al. Orientation-specific fast rTMS maximizes corticospinal inhibition and facilitation. Experimental brain research. Experimentelle Hirnforschung. Experimentation cerebrale. 2005;164:323–333. doi: 10.1007/s00221-005-2253-6. [DOI] [PubMed] [Google Scholar]
- 39.Arai N, Okabe S, Furubayashi T, et al. Comparison between short train, monophasic and biphasic repetitive transcranial magnetic stimulation (rTMS) of the human motor cortex. Clinical neurophysiology. 2005;116:605–613. doi: 10.1016/j.clinph.2004.09.020. [DOI] [PubMed] [Google Scholar]
- 40.Arai N, Okabe S, Furubayashi T, et al. Differences in after-effect between monophasic and biphasic high-frequency rTMS of the human motor cortex. Clinical Neurophysiology. 2007;118:2227–2233. doi: 10.1016/j.clinph.2007.07.006. [DOI] [PubMed] [Google Scholar]
- 41.Hosono Y, Urushihara R, Harada M, et al. Comparison of monophasic versus biphasic stimulation in rTMS over premotor cortex: SEP and SPECT studies. Clinical neurophysiology. 2008;119:2538–2545. doi: 10.1016/j.clinph.2008.07.279. [DOI] [PubMed] [Google Scholar]
- 42.Peterchev AV, Deng Z-D, Goetz SM. Advances in transcranial magnetic stimulation technology. In: Reti IM, editor. Brain Stimulation: Methodologies and Interventions. Hoboken, NJ: John Wiley & Sons; 2015. [Google Scholar]
- 43.Schmid M, Weyh T, Meyer B-U. Entwicklung, Optimierung und Erprobung neuer Geräte für die magnetomotorische Stimulation von Nervenfasern/Development, Optimization and Testing of New Devices for Magnetomotive Nerve Fibre Stimulation. Biomedizinische Technik/Biomedical Engineering. 1993;38:317–324. doi: 10.1515/bmte.1993.38.12.317. [DOI] [PubMed] [Google Scholar]
- 44.Riehl M. TMS stimulator design. In: Wassermann E, Epstein C, Ziemann U, et al., editors. Oxford Handbook of Transcranial Stimulation. Oxford: Oxford University Press; 2008. pp. 13–23. [Google Scholar]
- 45.Peterchev AV, D’Ostilio K, Rothwell JC, et al. Controllable pulse parameter transcranial magnetic stimulator with enhanced circuit topology and pulse shaping. J Neural Eng. 2014;11:056023. doi: 10.1088/1741-2560/11/5/056023. [DOI] [PMC free article] [PubMed] [Google Scholar]
- 46.Peterchev AV, Murphy DL, Lisanby SH. Repetitive transcranial magnetic stimulator with controllable pulse parameters. Journal of Neural Engineering. 2011;8:036016. doi: 10.1088/1741-2560/8/3/036016. [DOI] [PMC free article] [PubMed] [Google Scholar]
- 47.Hannah R, Ciocca M, Sommer M, et al. Continuous theta burst stimulation with monophasic pulses: effect of current direction. Clinical neurophysiology. 2014;125:S332–S333. [Google Scholar]
- 48.Sommer M, Ciocca M, Hannah R, et al. Intermittent theta burst stimulation inhibits human motor cortex when applied with mostly monophasic (anterior-posterior) pulses. Clinical neurophysiology. 2014;125:S228. [Google Scholar]
- 49.Sommer M, D’Ostilio K, Ciocca M, et al. TMS can selectively activate and condition two different sets of excitatory synaptic inputs to corticospinal neurones in human. SFN Society for Neuroscience. 2014;542 [Google Scholar]
- 50.Quartarone A, Bagnato S, Rizzo V, et al. Distinct changes in cortical and spinal excitability following high-frequency repetitive TMS to the human motor cortex. Experimental brain research. Experimentelle Hirnforschung. Experimentation cerebrale. 2005;161:114–124. doi: 10.1007/s00221-004-2052-5. [DOI] [PubMed] [Google Scholar]
- 51.Siebner HR, Lang N, Rizzo V, et al. Preconditioning of Low-Frequency Repetitive Transcranial Magnetic Stimulation with Transcranial Direct Current Stimulation: Evidence for Homeostatic Plasticity in the Human Motor Cortex. Journal of Neuroscience. 2004;24:3379–3385. doi: 10.1523/JNEUROSCI.5316-03.2004. [DOI] [PMC free article] [PubMed] [Google Scholar]
- 52.Fitzgerald PB, Brown TL, Daskalakis ZJ, et al. Intensity-dependent effects of 1 Hz rTMS on human corticospinal excitability. Clinical Neurophysiology. 2002;113:1136–1141. doi: 10.1016/s1388-2457(02)00145-1. [DOI] [PubMed] [Google Scholar]
- 53.Fitzgerald PB, Brown TL, Marston NAU, et al. Reduced plastic brain responses in schizophrenia: a transcranial magnetic stimulation study. Schizophrenia Research. 2004;71:17–26. doi: 10.1016/j.schres.2004.01.018. [DOI] [PubMed] [Google Scholar]
- 54.Muellbacher W, Ziemann U, Boroojerdi B, et al. Effects of low-frequency transcranial magnetic stimulation on motor excitability and basic motor behavior. Clinical neurophysiology. 2000;111:1002–1007. doi: 10.1016/s1388-2457(00)00284-4. [DOI] [PubMed] [Google Scholar]
- 55.Fitzgerald PB, Fountain S, Daskalakis ZJ. A comprehensive review of the effects of rTMS on motor cortical excitability and inhibition. Clinical neurophysiology. 2006;117:2584–2596. doi: 10.1016/j.clinph.2006.06.712. [DOI] [PubMed] [Google Scholar]
- 56.Maeda F, Keenan JP, Tormos JM, et al. Modulation of corticospinal excitability by repetitive transcranial magnetic stimulation. Clinical neurophysiology. 2000;111:800–805. doi: 10.1016/s1388-2457(99)00323-5. [DOI] [PubMed] [Google Scholar]
- 57.Gerschlager W, Siebner HR, Rothwell JC. Decreased corticospinal excitability after subthreshold 1 Hz rTMS over lateral premotor cortex. Neurology. 2001;57:449–455. doi: 10.1212/wnl.57.3.449. [DOI] [PubMed] [Google Scholar]
- 58.Lang N, Harms J, Weyh T, et al. Stimulus intensity and coil characteristics influence the efficacy of rTMS to suppress cortical excitability. Clinical Neurophysiology. 2006;117:2292–2301. doi: 10.1016/j.clinph.2006.05.030. [DOI] [PubMed] [Google Scholar]
- 59.D’Ostilio K, Goetz SM, Ciocca M, et al. Effect of coil orientation on strength-duration time constant with controllable pulse parameter transcranial magnetic stimulation. Clinical Neurophysiology. 2014;125(Suppl. 1):S123. doi: 10.1016/j.clinph.2015.05.017. [DOI] [PMC free article] [PubMed] [Google Scholar]
- 60.Touge T, Gerschlager W, Brown P, et al. Are the after-effects of low-frequency rTMS on motor cortex excitability due to changes in the efficacy of cortical synapses? Clinical Neurophysiology. 2001;112:2138–2145. doi: 10.1016/s1388-2457(01)00651-4. [DOI] [PubMed] [Google Scholar]
- 61.Treutwein B. YAAP: yet another adaptive procedure. Spatial Vision. 1997;11:129. [PubMed] [Google Scholar]
- 62.Treutwein B, Strasburger H. Fitting the psychometric function. Perception & Psychophysics. 1999;61:87–106. doi: 10.3758/bf03211951. [DOI] [PubMed] [Google Scholar]
- 63.Qi F, Wu AD, Schweighofer N. Fast estimation of transcranial magnetic stimulation motor threshold. Brain Stimulation. 2011;4:50–57. doi: 10.1016/j.brs.2010.06.002. [DOI] [PubMed] [Google Scholar]
- 64.Di Lazzaro V, Profice P, Ranieri F, et al. I-wave origin and modulation. Brain Stimulation. 2012;5:512–525. doi: 10.1016/j.brs.2011.07.008. [DOI] [PubMed] [Google Scholar]
- 65.Di Lazzaro V, Ziemann U, Lemon RN. State of the art: Physiology of transcranial motor cortex stimulation. Brain Stimulation. 2008;1:345–362. doi: 10.1016/j.brs.2008.07.004. [DOI] [PubMed] [Google Scholar]
- 66.Corthout E, Barker A, Cowey A. Transcranial magnetic stimulation. Which part of the current waveform causes the stimulation? Experimental brain research. Experimentelle Hirnforschung. Experimentation cerebrale. 2001;141:128–132. doi: 10.1007/s002210100860. [DOI] [PubMed] [Google Scholar]
- 67.Nielsen JF. Logarithmic distribution of amplitudes of compound muscle action potentials evoked by transcranial magnetic stimulation. J Clin Neurophysiol. 1996;13:423–434. doi: 10.1097/00004691-199609000-00005. [DOI] [PubMed] [Google Scholar]
- 68.Peterchev AV, Goetz SM, Westin GG, et al. Pulse width dependence of motor threshold and input–output curve characterized with controllable pulse parameter transcranial magnetic stimulation. Clinical Neurophysiology. 2013;124:1364–1372. doi: 10.1016/j.clinph.2013.01.011. [DOI] [PMC free article] [PubMed] [Google Scholar]
- 69.Goetz SM, Luber B, Lisanby SH, et al. Dual-source variability model for estimating and predicting brain-stimulation-evoked responses. Brain Stimulation. 2014;7:541–552. doi: 10.1016/j.brs.2014.03.002. [DOI] [PMC free article] [PubMed] [Google Scholar]
- 70.Goetz SM, Peterchev AV. A model of variability in brain stimulation evoked responses. Proc IEEE Conf Med Biol Soc. 2012;34:6434–6437. doi: 10.1109/EMBC.2012.6347467. [DOI] [PubMed] [Google Scholar]
- 71.Maeda F, Keenan JP, Tormos JM, et al. Interindividual variability of the modulatory effects of repetitive transcranial magnetic stimulation on cortical excitability. Experimental brain research. Experimentelle Hirnforschung. Experimentation cerebrale. 2000;133:425–430. doi: 10.1007/s002210000432. [DOI] [PubMed] [Google Scholar]
- 72.Goetz SM, Pfaeffl M, Huber J, et al. Circuit topology and control principle for a first magnetic stimulator with fully controllable waveform. Proc IEEE Conf Med Biol Soc. 2012;2012:4700–4703. doi: 10.1109/EMBC.2012.6347016. [DOI] [PubMed] [Google Scholar]
- 73.Goetz SM, Truong NC, Gerhofer MG, et al. Optimization of magnetic neurostimulation waveforms for minimum power loss. Proc IEEE Conf Med Biol Soc. 2012;2012:4652–4655. doi: 10.1109/EMBC.2012.6347004. [DOI] [PubMed] [Google Scholar]
- 74.Goetz SM, Truong CN, Gerhofer MG, et al. Analysis and Optimization of Pulse Dynamics for Magnetic Stimulation. PLoS ONE. 2013;8:e55771. doi: 10.1371/journal.pone.0055771. [DOI] [PMC free article] [PubMed] [Google Scholar]
- 75.Werhahn KJ, Fong JKY, Meyer BU, et al. The effect of magnetic coil orientation on the latency of surface EMG and single motor unit responses in the first dorsal interosseous muscle. Electroencephalography and Clinical Neurophysiology. 1994;93:138–146. doi: 10.1016/0168-5597(94)90077-9. [DOI] [PubMed] [Google Scholar]
- 76.Wilson SA, Day BL, Thickbroom GW, et al. Spatial differences in the sites of direct and indirect activation of corticospinal neurones by magnetic stimulation. Electroencephalography and Clinical Neurophysiology/Electromyography and Motor Control. 1996;101:255–261. doi: 10.1016/0924-980x(96)95148-6. [DOI] [PubMed] [Google Scholar]
- 77.Kaneko K, Kawai S, Fuchigami Y, et al. The effect of current direction induced by transcranial magnetic stimulation on the corticospinal excitability in human brain. Electroencephalography and Clinical Neurophysiology. 1996;101:478–482. doi: 10.1016/s0013-4694(96)96021-x. [DOI] [PubMed] [Google Scholar]
- 78.Sommer M, Alfaro A, Rummel M, et al. Half sine, monophasic and biphasic transcranial magnetic stimulation of the human motor cortex. Clinical neurophysiology. 2006;117:838–844. doi: 10.1016/j.clinph.2005.10.029. [DOI] [PubMed] [Google Scholar]
- 79.Markram H, Toledo-Rodriguez M, Wang Y, et al. Interneurons of the neocortical inhibitory system. Nat Rev Neurosci. 2004;5:793–807. doi: 10.1038/nrn1519. [DOI] [PubMed] [Google Scholar]
- 80.Esser SK, Hill SL, Tononi G. Modeling the Effects of Transcranial Magnetic Stimulation on Cortical Circuits. Journal of Neurophysiology. 2005;94:622–639. doi: 10.1152/jn.01230.2004. [DOI] [PubMed] [Google Scholar]
- 81.Wassermann EM, Wedegaertner FR, Ziemann U, et al. Crossed reduction of human motor cortex excitability by 1-Hz transcranial magnetic stimulation. Neuroscience Letters. 1998;250:141–144. doi: 10.1016/s0304-3940(98)00437-6. [DOI] [PubMed] [Google Scholar]
- 82.Choudhury KR, Boyle L, Burke M, et al. Intra subject variation and correlation of motor potentials evoked by transcranial magnetic stimulation. Ir J Med Sci. 2011;180:873–880. doi: 10.1007/s11845-011-0722-4. [DOI] [PubMed] [Google Scholar]
- 83.Di Lazzaro V, Pilato F, Dileone M, et al. Low-frequency repetitive transcranial magnetic stimulation suppresses specific excitatory circuits in the human motor cortex. J Physiol. 2008;586:4481–4487. doi: 10.1113/jphysiol.2008.159558. [DOI] [PMC free article] [PubMed] [Google Scholar]
Associated Data
This section collects any data citations, data availability statements, or supplementary materials included in this article.