

SUMMARY
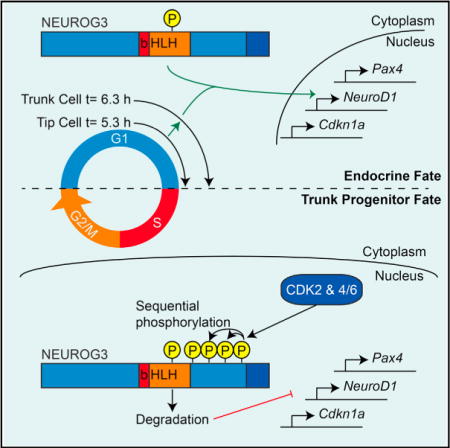
During pancreatic development, proliferating pancreatic progenitors activate the proendocrine transcription factor neurogenin 3 (NEUROG3), exit the cell cycle, and differentiate into islet cells. The mechanisms that direct robust NEUROG3 expression within a subset of progenitor cells control the size of the endocrine population. Here we demonstrate that NEUROG3 is phosphorylated within the nucleus on serine 183, which catalyzes its hyperphosphorylation and proteosomal degradation. During progression through the progenitor cell cycle, NEUROG3 phosphorylation is driven by the actions of cyclin-dependent kinases 2 and 4/6 at G1/S cell-cycle checkpoint. Using models of mouse and human pancreas development, we show that lengthening of the G1 phase of the pancreatic progenitor cell cycle is essential for proper induction of NEUROG3 and initiation of endocrine cell differentiation. In sum, these studies demonstrate that progenitor cell-cycle G1 lengthening, through its actions on stabilization of NEUROG3, is an essential variable in normal endocrine cell genesis.
Graphical Abstract
INTRODUCTION
Diabetes mellitus is characterized by chronic hyperglycemia resulting from the loss or dysfunction of the insulin-producing β cells located in the pancreatic islets. A current treatment for diabetes is to replace these damaged cells through islet transplantation (Shapiro et al., 2000), which is limited by donor tissue availability. Production of large numbers of functional β cells from human embryonic stem cells (hESCs) could address this unmet need. Over the past decade, efforts to generate these cells have culminated in “β-like cells,” which resemble β cells yet remain functionally immature (Johnson, 2016; Kieffer, 2016; Pagliuca and Melton, 2013). However, the number of β-like cells that are formed varies between biological replicates and laboratories (Rezania et al., 2014), making consistent endocrine cell formation difficult and expensive (Rostovskaya et al., 2015). Understanding the mechanisms that control endocrine cell differentiation during pancreas development will uncover ways to more uniformly generate mature β-like cells that could be used to treat those with diabetes (McKnight et al., 2010).
Pancreas formation is marked by the appearance of Pdx1-expressing pancreatic progenitor cells (Gu et al., 2002) that rapidly differentiate into two populations by approximately embryonic day 12 (E12): the tip progenitors that are competent to form all pancreatic cell types and the trunk cells that are lineage-restricted to endocrine and ductal fates (Zhou et al., 2007). Expression of Neurog3 induces trunk progenitor cell commitment to the endocrine lineage in a cell-autonomous manner (Apelqvist et al., 1999) and is required for the formation of endocrine cells during both mouse (Gradwohl et al., 2000) and human development (McGrath et al., 2015). High induction of Neurog3 is critical for proper commitment to the endocrine lineage (Wang et al., 2010) with glucagon (α) cells forming earliest in development, followed by insulin (β), pancreatic polypeptide (PP), and somatostatin (δ) cells (Johansson et al., 2007). Upon activation of Neurog3, pancreatic progenitors exit the cell cycle and differentiate, a process that is partially driven by Neurog3-dependent upregulation of Cdkn1a/p21 (Desgraz and Herrera, 2009; Gu et al., 2002; Miyatsuka et al., 2011).
The decision either to exit the cell cycle and differentiate or to undergo cell division occurs during the G1 phase of the cell cycle. Progression through the cell cycle is controlled by cyclins and cyclin-dependent kinases (CDKs). During late G1, the cyclin D/CDK4/6 and cyclin E/CDK2 complexes phosphorylate the retinoblastoma protein (Rb), resulting in the commitment to cell division with progression through the G1-S phase transition. During the development of some tissues, G1 lengthening is positively correlated with progenitor differentiation (Lange and Calegari, 2010). This correlation suggests that the cell cycle itself may directly regulate differentiation by altering the stability of obligatory, lineage-establishing transcription factors. For example, the CDK inhibitor P27Xic1 promotes neurogenesis by stabilizing Xenopus (Vernon, 2003) and mouse neurogenic transcription factors (Nguyen et al., 2006) through reductions in their ubiquitin-mediated proteasomal degradation (Vosper et al., 2007, 2009; Roark et al., 2012).
While cell-cycle proteins, such as P21, have been implicated in endocrine differentiation downstream of Neurog3, cell-cycle changes that might underlie induction of Neurog3 itself have not been investigated. As such, the aim of this work was to determine whether cell cycling itself regulates endocrine pancreas differentiation through fine-tuning the stability of Neurog3. This work demonstrates that lengthening of the G1 cell-cycle phase is necessary for NEUROG3 stabilization and its transcriptional activity. Furthermore, hyperphosphorylation by CDK2 and CDK4/6 in rapidly cycling cells leads to NEUROG3 degradation and maintenance of the progenitor fate. Herein, a mechanistic link between progenitor cell-cycle length and endocrine pancreas genesis has been defined, explaining why only a subset of cycling progenitors robustly express NEUROG3 and differentiate to endocrine islet cells.
RESULTS
Cell-Cycle Length Increases during Early Pancreatic Development
As cell-cycle lengthening has been correlated with differentiation of embryonic, neural, and hematopoietic stem cells (Lange and Calegari, 2010), we first set out to understand whether a similar paradigm exists in mouse pancreas development. To accomplish this, we used cumulative 5-ethynyl-2′-deoxyuridine (EdU) labeling to experimentally determine the length of cell-cycle phases in mouse pancreatic progenitors between E11.5 and E13.5 (Arai et al., 2011). This approach requires serial injections of EdU to label all S-phase cells in vivo. The time required for a cell that started in S phase to complete the rest of the cell cycle (G2-M-G1) and re-enter S phase (Figure 1A) is measured by the time to reach maximal EdU labeling, i.e., the growth fraction (GF; Figure 1B), and equals the cell-cycle length (TC; Figure 1B) less the S-phase length (TS) (X0 = TC−TS; Figure 1B). Segmental linear regression establishes the y intercept (y-int = TS/TC * GF; Figure 1B) and slope (m = GF/TC). Using these data, TS = y-int/m and TC = y-int/m + X0. To measure the length of G2-M (TG2-M), we experimentally determine the time for all EdU-labeled cells to transit through G2 and enter mitosis (pHH3+) following a single bolus of EdU (Figure 1E). The length of G1 (TG1) can then be calculated by TC − TS − TG2-M.
Figure 1. The Length of the G1 Phase of the Cell Cycle Increases during Mouse Pancreatic Development.
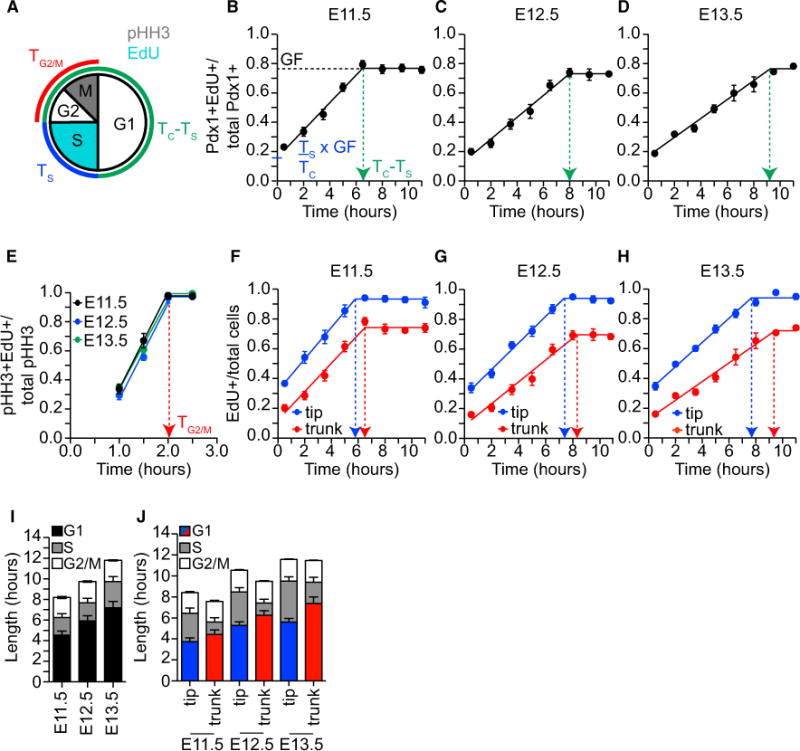
(A) Schematic describing experimental approach used to measure the lengths of the G1 (TG1), S (TS), and G2-M (TG2-M) cell-cycle phases with cumulative EdU labeling of cells in S phase (light blue) and the M-phase marker pHH3 (gray). The lengths of the G1, S, and G2-M phases of the cell cycle were determined from measurements of TC − TS (green), TS (blue), and TG2-M (red).
(B) Cumulative EdU labeling of Pdx1+ cells at E11.5. Green arrow (TC − TS) indicates the length of time it takes to reach plateau (dotted black line = growth fraction [GF]). y intercept represents (TS/TC) * GF. Embryos (n = 4–13) from two dams were analyzed at each time point.
(C) Cumulative EdU labeling of Pdx1+ cells at E12.5. n = 4–13 embryos from two dams at each time point.
(D) Cumulative EdU labeling of Pdx1+ cells at E13.5. n = 4–13 embryos from two dams at each time point.
(E) The proportion of pHH3+ cells labeled with EdU after 1.0, 1.5, 2.0, and 2.5 hr at E11.5 (black), E12.5 (blue), and E13.5 (green). Red arrow indicates the length of G2-M (TG2-M). n = 3 embryos from two dams at each time point.
(F–H) Cumulative EdU labeling of Pdx1+Cpa1+ tip (blue) and Pdx1+Cpa1− trunk progenitors (red) at (F) E11.5, (G) E12.5, and (H) E13.5. Arrows indicate time to reach GF. n = 4–13 embryos from two dams at each time point.
(I) The length in hours of the G1 (black), S (gray), and G2-M (white) phases of the cell cycle at E11.5, E12.5, and E13.5 in the Pdx1+ progenitor population.
(J) Calculated cell-cycle parameters for tip and trunk progenitors at E11.5, E12.5, and E13.5: G1 (red or blue), S (gray), and G2-M (white).
Data are presented as mean ± SEM. See also Figure S1 and Table 1.
Using this approach, the time for Pdx1 immunoreactive (+) pancreatic progenitors to reach the GF was 6.50 ± 0.38, 7.98 ± 0.51, and 9.26 ± 0.60 hr at E11.5, E12.5, and E13.5, respectively (Figures 1B–1D). TC increased from 8.20 ± 0.68 to 11.70 ± 0.93 hr while both TS and TG2-M remained similar for each developmental day (Figures 1B–1E and Table 1). Therefore, the increases in total cell-cycle length were solely due to G1 phase lengthening from 4.54 ± 0.40 to 7.19 ± 0.83 hr (Figure 1I and Table 1).
Table 1.
Cell-Cycle Phase Lengths of Pdx1+ Pancreatic Epithelium, Pdx1+Cpa1+ Tip, and Pdx1+Cpa1− Trunk Progenitor Cells during Mouse Embryonic Development
| TC | TG1 | TS | TG2-M | GF | ||
|---|---|---|---|---|---|---|
| Pdx1+ | E11.5 | 8.20 ± 0.68 | 4.54 ± 0.40 | 1.70 ± 0.38 | 1.96 ± 0.10 | 0.75 ± 0.02 |
| E12.5 | 9.73 ± 0.86 | 5.91 ± 0.51 | 1.75 ± 0.46 | 2.07 ± 0.07 | 0.73 ± 0.01 | |
| E13.5 | 11.79 ± 0.93 | 7.19 ± 0.48 | 2.53 ± 0.48 | 2.07 ± 0.05 | 0.78 ± 0.01 | |
| Pdx1+Cpa1+ | E11.5 | 8.41 ± 0.74 | 3.74 ± 0.35 | 2.71 ± 0.49 | 1.96 ± 0.10 | 0.94 ± 0.02 |
| E12.5 | 10.54 ± 0.66 | 5.29 ± 0.34 | 3.18 ± 0.41 | 2.07 ± 0.07 | 0.94 ± 0.02 | |
| E13.5 | 11.57 ± 0.66 | 5.62 ± 0.34 | 3.89 ± 0.40 | 2.07 ± 0.05 | 0.95 ± 0.02 | |
| Pdx1+Cpa1− | E11.5 | 7.57 ± 0.74 | 4.41 ± 0.43 | 1.20 ± 0.41 | 1.96 ± 0.10 | 0.73 ± 0.03 |
| E12.5 | 9.49 ± 0.67 | 6.24 ± 0.44 | 1.17 ± 0.37 | 2.07 ± 0.07 | 0.70 ± 0.02 | |
| E13.5 | 11.47 ± 0.95 | 7.36 ± 0.64 | 2.04 ± 0.47 | 2.07 ± 0.05 | 0.74 ± 0.01 |
Mean values ± SEM of total cell-cycle length (TC), G1 phase length (TG1), S phase length (TS), and G2-M phase length (TG2-M)
Close examination of the EdU labeling revealed that the EdU+ cells appeared in clusters near the tips prior to the trunks of the epithelium (Figure S1), suggesting a difference in cell-cycle length between the Pdx1+Cpa1+ tip and the Pdx1+Cpa1− trunk progenitors. The time to reach the GF increased from E11.5 to E13.5 in both tip (5.70 ± 0.33 to 7.69 ± 0.34 hr) and trunk cells (6.38 ± 0.42 to 9.43 ± 0.64 hr) (Figures 1F–1H). In addition, on each developmental day the time to reach the GF differed between the tip and trunk cells, resulting in a G1 phase length that is ~25% longer in the more differentiated trunk progenitors (4.41 ± 0.43 to 7.36 ± 0.64 hr) than in tip progenitors (3.74 ± 0.35 to 5.62 ± 0.34 hr) (Figure 1J and Table 1). Despite the increased G1 length in trunk cells, their TC was similar due to a reduction in the TS (Figure 1J and Table 1). Taken together, these findings demonstrate that G1 lengthening occurs within both progenitor pools during pancreas development.
Cell-Cycle Lengthening in Trunk Cells Allows Endocrine Differentiation during Pancreatic Development
To understand whether G1 lengthening has functional consequences for endocrine pancreas development, we utilized two mouse models to manipulate pancreatic progenitor G1 phase length. We previously noted (Chamberlain et al., 2014), and confirm here, that heterozygous Kras loss-of-function (KrasLSL) pancreata have significantly more Neurog3 cells at E13.5 (Figures S2A and S2B). Since Kras activates cell cycling by driving G1/S progression (Wennerberg et al., 2005), we hypothesized that the 1.2-fold increase in Neurog3+ cells in the KrasLSL embryos resulted from G1 lengthening. To determine whether Kras expression levels affected cell-cycle length, we carried out EdU labeling for 3.5 hr before harvest on E12.5 (Figure S2C). This EdU schedule targets the steep, linear phase of the labeling curve at E12.5 (Figure 1) and therefore enables inference of small changes in cell-cycle length. The proportion of Pdx1+EdU+ pancreatic progenitors was significantly reduced in KrasLSL embryos at E12.5 (Figure S2D). While not significant, the Kras gain-of-function (KrasG12D) embryos had slightly more EdU-labeled progenitor cells (Figure S2D), suggesting that they cycle more quickly. As the majority of Neurog3+ cells derive from the trunk cells, we next investigated whether changes in Kras signaling differentially affect the cell cycle of tip and trunk cells. EdU+ tip and trunk cells decreased in the KrasLSL model and increased in the KrasG12D model (Figures S2E and S2F) without affecting total cell numbers (Figure S2G). Notably, KrasLSL tip cell EdU incorporation rates were similar to those of wild-type (WT) trunk cells, suggesting that their cell-cycle parameters and developmental competencies are similar (Figures S2D and S2E). In addition, altering Kras signaling during embryonic development does not significantly change the proportion of tip and trunk progenitor cells (Figure S2H). Taken together, these results suggest that altering cell-cycle length during mouse pancreatic development affects the generation of Neurog3+ endocrine progenitors.
To more directly test the consequence of altering G1 length, we ectopically expressed Cdkn1b—a cyclin-dependent kinase inhibitor not normally expressed in Sox9-expressing pancreatic progenitor cells that blocks the G1/S transition (Miyatsuka et al., 2011)—in a doxycycline-inducible manner. Control embryos were either single transgenic (ST) Sox9-rtTA or tetO-Cdkn1b littermates of Cdkn1b-expressing Sox9-rtTA;tetO-Cdkn1b double transgenic (DT) embryos. Pregnant dams were injected with doxycycline on the morning of E12.5 and embryos were collected for analysis 9.5 hr later (Figure 2A). Both Cdkn1b+ and Neurog3+ cells increased significantly (Figures 2A and 2B), suggesting that Cdkn1b expression is sufficient to increase the number of Neurog3+ cells without altering total cell number (Figure 2C). To determine whether ectopic Cdkn1b expression slowed S-phase transition, doxycycline was given from E10.5 to E12.5, and EdU-labeling was carried out for 3.5 hr before harvest on E12.5 (Figure 2D) as described above. As expected, the proportion of EdU+ pancreatic progenitor cells significantly decreased in DT embryos (Figure 2E). To ensure that ectopic Cdkn1b expression did not cause cell-cycle exit, we quantified the GF using 11 hr of EdU labeling (GF; Figure 1C); no differences were observed between control ST and DT mice (Figure 2F).
Figure 2. Ectopic Expression of Cdkn1b (P27) in Sox9+ Progenitors Causes Endocrine Cell Differentiation.
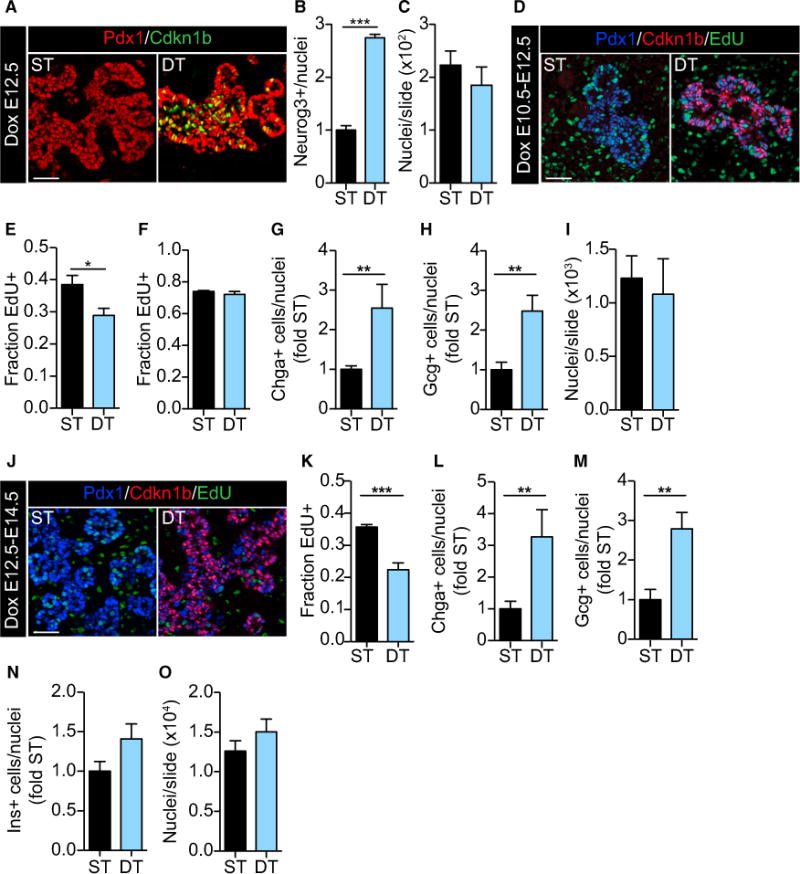
(A) One injection of doxycycline (Dox) at E12.3 increased Cdkn1b (green) expression in the pancreatic epithelium (Pdx1+; red) of double transgenic (DT) but not single transgenic (ST) mice at E12.7.
(B) 9.5 hr of Cdkn1b induction at E12.5 significantly increased the number of Neurog3+ cells in DT embryos. n = 3. ***p < 0.0001 by unpaired t test.
(C) Ectopic expression of Cdkn1b (9.5 hr) did not alter the total number of pancreatic cells. n = 6.
(D) At E12.5, Cdkn1b-expressing (red) pancreatic epithelial cells (Pdx1+; blue) from Dox-treated (E10.5–12.5) DT embryos incorporated less EdU (green) at 3.5 hr.
(E) Significantly fewer Pdx1+EdU+ cells were counted following 3.5 hr of labeling of DT embryos. n = 7. *p < 0.05 by unpaired t test.
(F) Ectopic Cdkn1b expression did not alter the fraction of EdU+ progenitor cells (the GF) after 11 hr of labeling, indicating that cells remained in the cell cycle. n = 3.
(G) Chga+ cells were significantly increased at E12.5 DT embryos following 48 hr of Dox. n = 5. **p < 0.01 by Mann-Whitney U test.
(H) Gcg+ cells were significantly increased at E12.5 in DT embryos following 48 hr of Dox. n = 6. **p < 0.01 by unpaired t test.
(I) Ectopic expression of Cdkn1b (E10.5–12.5) did not reduce total pancreatic cells at E12.5. n = 7.
(J) Dox treatment (E12.5–14.5) of DT embryos increased Cdkn1b (red) expression in subset of Pdx1+ (blue) trunk cells.
(K) Dox-treated (E12.5–14.5) DT embryos showed significantly reduced EdU+ labeling after 3.5 hr at E14.5. n = 4. ***p < 0.0001 by unpaired t test.
(L) More Chga+ cells were present in Dox-treated (E12.5–14.5) DT embryos at E14.5. n = 5. **p < 0.001 by Mann-Whitney U test.
(M) More Gcg+ cells were present in Dox-treated (E12.5–14.5) DT embryos at E14.5. n = 5. **p < 0.01 by unpaired t test.
(N) Ins+ cells were not significantly changed in Dox-treated (E12.5–14.5) DT embryos. n = 9. p = 0.09 by unpaired t test.
(O) The number of pancreatic cells per slide was unchanged, suggesting that growth was not affected by 48 hr of Cdkn1b expression at E14.5. n = 5.
Data are presented as mean ± SEM. Scale bars, 50 μm. See also Figure S2.
Notably, 48 hr of Cdkn1b expression resulted in a 2.5-fold increase in both chromogranin A (Chga)+ cells (Figure 2G) and glucagon (Gcg; α)+ cells at E12.5 (Figure 2H) but did not significantly affect overall cell numbers (Figure 2I). These results suggest that the increase in Neurog3+ endocrine progenitors caused an increase in endocrine cell formation that was predominantly of the α-cell lineage. As competency of Neurog+ cells is predominantly down the α-cell lineage during early pancreas development (Johansson et al., 2007), we next asked whether Cdkn1b expression promotes the formation of other endocrine cell types later in pancreas development by administering doxycycline from E12.5 to E14.5 (Figure 2J). This doxycycline dosing regimen resulted in a significant decrease in the number of EdU+ cells at E14.5 after 3.5 hr of EdU labeling (Figure 2K) and a 3.3-fold increase in Chga+ endocrine cells at E14.5 (Figure 2L). In addition, the numbers of Gcg+ (2.8-fold; Figure 2M) and Ins+ (1.4-fold; Figure 2N) cells increased without affecting pancreatic size (Figure 2O). Consistent with their formation later in pancreas development, we did not observe any changes in the formation of δ or PP cells (data not shown). Combined with studies reported in Figure 1, these in vivo studies suggest that G1 lengthening permits efficient Neurog3 expression and endocrine differentiation. Furthermore, ectopic expression of Cdkn1b, a G1-S CDK inhibitor, suggests that the activities of G1-S CDKs in the progenitor cells prevents efficient endocrine differentiation and maintains progenitor cell state.
Serine 174 and 183 Are Critical NEUROG3 Phosphorylation Sites
As it has previously been demonstrated that Neurog3 message expression is more prevalent than its protein expression in rapidly cycling pancreatic progenitors (Bechard et al., 2016; Villasenor et al., 2008), we next sought to understand how NEUROG3 stabilization in pancreatic progenitors results in endocrine differentiation. Since CDKs regulate protein phosphorylation in a cell-cycle-dependent manner, we hypothesized that NEUROG3 phosphorylation in rapidly cycling progenitors results in its degradation. At its peak of expression in the mouse embryonic pancreas (Villasenor et al., 2008) and as previously noted (Wang et al., 2009), Neurog3 displays multiple distinct electrophoretic mobilities, consistent with phosphorylation (Figure 3A). To determine which regions of NEUROG3 are phosphorylated, we generated three N-terminally FLAG-tagged human NEUROG3 truncation mutants. In addition, a phospho-mutant (T120A) was generated that is analogous to the T118 phosphorylation site of Xenopus Neurog2. Threonine 118 is required for the interaction and complex formation of Neurog2 with its heterodimerization partner, BETA-2/E12/E47, and acts to counter ubiquitination, prolonging its half-life (Vosper et al., 2007). The slower migrating forms of NEUROG3 were sensitive to phosphatase treatment, but Δ145–187 showed only a single, phosphatase-insensitive band (Figure 3B), implying the presence of key phosphorylation sites between the helix-loop-helix (HLH) and activation domains of NEUROG3. We were unable to visualize Δ6–78 on western blot despite significant effort (data not shown), possibly, as outlined below, because it lacks nuclear localization sequences important for stabilization.
Figure 3. Wild-Type Mouse and Human Neurog3 Can Be Hyperphosphorylated.
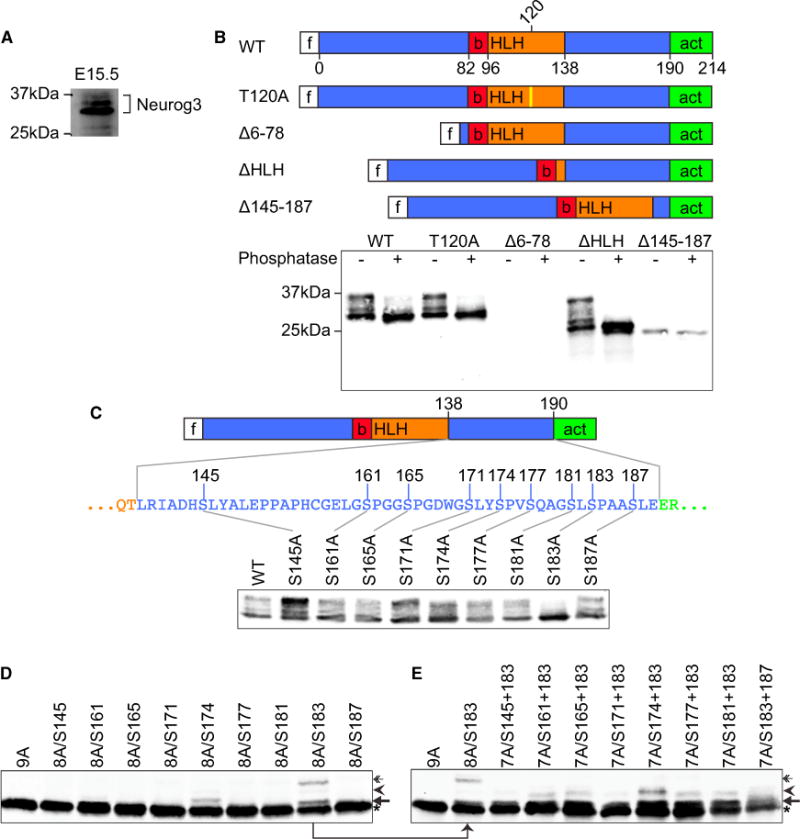
(A) Western blot from E15.5 mouse pancreas reveals multiple Neurog3 bands.
(B) Schematic of FLAG-tagged (f) human NEUROG3 mutants: wild-type (WT), T→A mutation predicted to prevent dimerization with E47 (T120A), basic (b), helix-loop-helix (HLH), activation (act) domains. Anti-FLAG western blot of lysates from HeLa cells expressing indicated mutants with (+) or without (−) phosphatase treatment.
(C) Anti-FLAG western blots of HeLa cell lysates expressing WT-Neurog3 (lane 1) and mutants that had one of the nine serine residues in the 138–190 region mutated to alanine as indicated.
(D) Anti-FLAG western blots of HeLa cell lysates expressing NEUROG3 variants with all nine serine residues in the 138–190 region mutated to alanine (9A) and variants with eight (8A) serine residues mutated to alanine, with indicated residue(s) left untouched.
(E) Anti-FLAG western blots of HeLa cell lysates expressing NEUROG3 variants with all nine serine residues in the 138–190 region mutated to alanine (9A) and variants with seven (7A) or eight (8A) serine residues mutated to alanine, with indicated residue(s) left untouched.
Asterisks, arrows, arrowheads, and double arrows represent the first, second, third, and fourth band, respectively. See also Figure S4.
As CDKs are serine/threonine kinases, we mutated each of the nine serine residues in the 145–187 region to alanine. Remarkably, mutating S183 alone prevented all phosphorylation, suggesting that S183 phosphorylation seeds subsequent multi-site phosphorylation (Figure 3C). A series of multi-serine mutations revealed that only S174 and S183 were phosphorylated when all the other serine residues were mutated (arrow and arrowhead in Figure 3D), indicating that in addition to S183, S174 can act as an initial phosphorylation target. A third series of mutants that leave S183 and a second serine intact revealed a third band in the presence of S161, S165, S174, S177, and S181 (arrowhead in Figure 3E). Combined, these data show that NEUROG3 is subject to sequential phosphorylation initiated by phosphorylation of S183.
NEUROG3 Phosphorylation Regulates Transcriptional Activity, but Not Nuclear Localization
Phosphorylation commonly serves to change transcription factor activity. Using a NEUROG3-responsive PAX4 luciferase reporter (Smith et al., 2003), the functional consequences of NEUROG3 phosphorylation were assessed. As previously reported for T118 of Xenopus Neurog2, T120A showed reduced transcriptional activity relative to WT NEUROG3 (Figure 4A), as did Δ6–78, R93L (Wang et al., 2006), and removal of the HLH domain. S183A and a number of other serine mutations increased trans-activation using this reporter (Figure 4A). Furthermore, induction of Pax4, NeuroD1, and Sst expression in mPAC cells (Gasa et al., 2004) were significantly increased following transfection of the NEUROG3 phosphomutants (S183A, 8A/S183; Figures 4B–4D). Therefore, phosphorylation of the C-terminal region of NEUROG3 reduces transcriptional activity.
Figure 4. Hyperphosphorylation Reduces the Transcriptional Activity of NEUROG3.
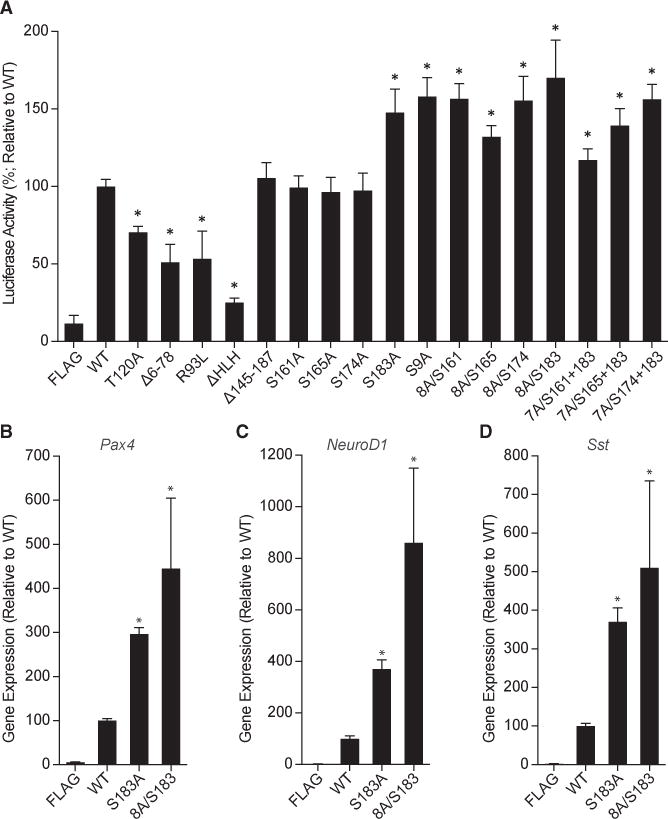
(A) PAX4 minienhancer-driven luciferase transcription is reduced by NEUROG3 phosphorylation. HeLa cells were cotransfected with the mini-enhancer, an Hnf1α overexpression construct, and FLAG-tag control (FLAG) or WT or mutant forms of NEUROG3.
(B) mPAC cells were transfected with FLAG-tag control, WT-NEUROG3, or the indicated mutants and analyzed for expression of endogenous Pax4 by qPCR.
(C) mPAC cells were transfected with FLAG-tag control, WT-NEUROG3, or the indicated mutants and analyzed for expression of endogenous NeuroD1 by qPCR.
(D) mPAC cells were transfected with FLAG-tag control, WT-NEUROG3, or the indicated mutants and analyzed for expression of endogenous Somatostatin (Sst) by qPCR.
Data are presented as mean ± SEM. n = 3. *p < 0.05 by one-way ANOVA and Dunnett’s post hoc test. See also Figures S3 and S4.
Phosphorylation of NEUROG3 could influence transcriptional activity by altering NEUROG3 subcellular localization. WT NEUROG3 accumulated exclusively in the nucleus (Figure S3A) but Δ6–78 showed impaired nuclear targeting (Figure S3B), suggesting that the N-terminal region harbors a nuclear localization sequence (NLS). Mutations of the other domains did not affect nuclear localization (Figures S3 and S4; data not shown), although Δ145–187 was enriched in the nucleoli marked by fibrillarin staining (Figure S3E). Transfected mPAC cells showed similar nuclear distributions of NEUROG3, S183A, and 8A/S183 (data not shown); thus, altered nuclear import does not explain the differences in transcriptional activity of the C-terminal NEUROG3 phosphomutants.
NEUROG3 Hyperphosphorylation Requires Nuclear Import
As C-terminal phosphorylation did not alter NEUROG3 subcellular localization, we next asked whether subcellular location affects NEUROG3 phosphorylation. Alanines were substituted for arginine and lysine in the predicted NLSs at 58–64, 79–82, and 84–87. None of the three individual region mutants reduced nuclear localization (Figures S3F–S3I), but mutating two out of the three NLSs impaired nuclear import (Figures S3J–S3M), even when nuclear export was blocked with leptomycin B (Figures S4A–S4J). As expected, mutating two out of the three NLSs also impaired NEUROG3 transcriptional activity (Figure S4P). Thus, NEUROG3 contains two redundant NLSs (58–64; 84–87), one of which overlaps with the basic DNA-binding domain (Figure 3B), as is common in other transcription factors (Cokol et al., 2000).
NLS mutation also reduced phosphorylation (Figures S4Q and S4R). However, the presence of a slower migrating form, most obvious for the cytoplasmically localized NLS58–64/84–87A (Figure S4Q, arrow), shows that some phosphorylation can occur outside the nucleus. Overexpression of E47, the basic HLH (bHLH) heterodimer partner of NEUROG3, rescued nuclear localization of the NLS mutants, but not the NLS58–64/84–87A/T120A mutant (Figures S4K–S4O), suggesting that E47 complexes with NEUROG3 outside the nucleus in a T120-phosphorylation-dependent manner and then tows NEUROG3 into the nucleus, as previously described for Neurog2 (Vosper et al., 2007). In sum, these studies show that C-terminal hyperphosphorylation of NEUROG3 occurs in the nucleus where the cell-cycle kinases typically function (Fiaschi-Taesch et al., 2013).
Phosphorylated NEUROG3 Is Degraded during G2-M
As NEUROG3 phosphorylation reduced transcriptional activity, we next asked whether phosphomutant forms of NEUROG3 were able to elicit one of its main biological roles in the pancreas: to regulate G1 cell-cycle arrest (Miyatsuka et al., 2011). Transfected HeLa cells were stained for DNA content and pHH3 to infer cell-cycle stage using flow cytometry. Overexpression of WT or phosphomutant NEUROG3 reduced cells in G2-M by 2-fold and increased G1-phase cells by 15% (Figure 5A), confirming that phosphomutant NEUROG3 remains able to arrest cells in G1. Only deletion of the HLH domain, which is essential for NEUROG3 dimerization with E47 and transcriptional activation of their targets (Figure 4A), abolished this property (Figure 5A). This observation demonstrates that NEUROG3 requires its bHLH binding partner, E47, and subsequent transcriptional activation (e.g., P21), but not phosphorylation, to arrest cells in G1.
Figure 5. Phosphorylation of S183 Occurs during G2-M Phase and Is Not Required for G1-S Cell-Cycle Arrest.
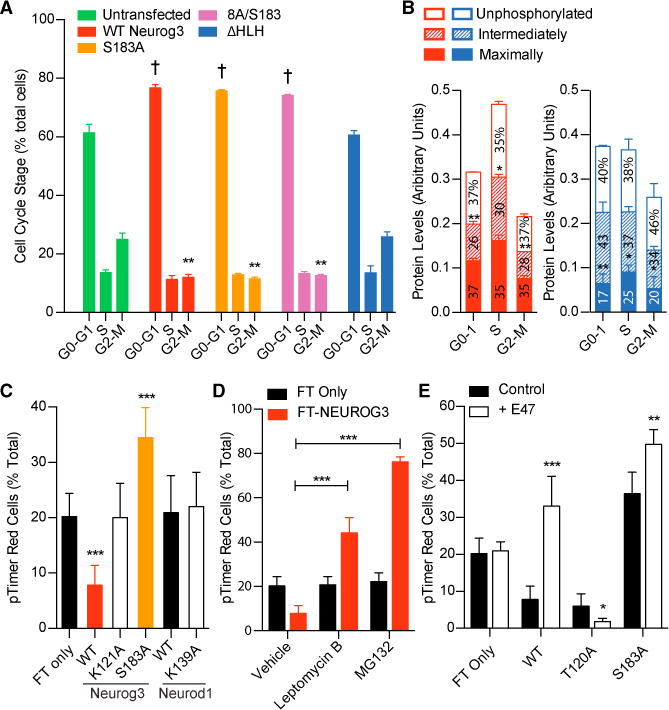
(A) Untransfected HeLa cells and those expressing FLAG-tagged NEUROG3 variants were trypsinized, fixed, and stained with anti-FLAG, anti-pHH3 antibodies, and DAPI, and flow cytometry utilized to determine the number of transfected cells in G0-G1, S, and G2-M. ** or †p < 0.005 compared with untransfected by one-way ANOVA and Dunnett’s post hoc test.
(B) Live HeLa cells expressing FLAG-tagged WT NEUROG3 (red) or NEUROG3ΔHLH (blue) were trypsinized and sorted by FACS into G0-G1, S, and G2-M populations. For each population, the fast-, medium-, and slow-migrating NEUROG3 species (i.e., unphosphorylated, intermediately phosphorylated, and maximally phosphorylated forms, respectively) were quantified by western blotting with anti-FLAG antibody and normalized to β-actin levels. Relative protein levels within each cell-cycle phase that are significantly different from others are indicated by asterisks above that phosphorylation form; *p < 0.05, **p < 0.005 by one-way ANOVA. n = 3.
(C–E) HeLa cells expressing the indicated fluorescence timer (pTimer/FT)-fusion proteins were untreated (C), incubated with leptomycin B or MG132 (D), or cotransfected with E47 (E), prior to flow cytometric analyses to determine the percentage of FT red-containing cells. Significant differences from FT only (C and E) or vehicle (D) are indicated by *p < 0.05, **p < 0.005, and ***p < 0.0005 by one-way ANOVA and Dunnett’s post hoc test. n = 3.
Data are presented as mean ± SEM.
To determine whether NEUROG3 is phosphorylated in a cell-cycle-dependent manner, we isolated G1, S, and G2-M populations by fluorescence-activated cell sorting (FACS), and used western blots to quantify the fastest, intermediate, and slowest migrating NEUROG3 bands. For each phosphoform of WT NEUROG3, expression was notably lowest in G2-M (Figure 5B). Within every cell-cycle stage, the unphosphorylated (fast) and maximally phosphorylated (slow) species of WT NEUROG3 were present at similar levels, while the level of intermediately phosphorylated forms was significantly lower (Figure 5B, red bars). NEUROG3ΔHLH, which does not cause differentiation and G1 arrest (Figure 5A), had similar levels of the unphosphorylated and intermediately phosphorylated species at each stage, but the level of the maximally phosphorylated form was significantly lower (Figure 5B, blue bars). Furthermore, the relative amounts of total WT NEUROG3 were highest at S phase and lowest at G2-M phase, whereas NEUROG3ΔHLH levels were equal at G0-G1 and S phase while only slightly lower at G2-M phase (cf. total red and blue bar heights in Figure 5B). Combined with the findings that WT NEUROG3 arrests the cells during S phase while NEUROG3ΔHLH does not (Figure 5A), these results suggest that maximally phosphorylated WT NEUROG3 levels decline beyond S phase. Therefore, when NEUROG3 cannot heterodimerize to drive target gene transcription—which causes cell-cycle exit and differentiation—it is rapidly degraded.
To monitor the synthesis and degradation of NEUROG3, we generated fusion proteins with a fluorescent timer (FT) that changes its emission spectrum from green to red over several hours (Miyatsuka et al., 2009; Subach et al., 2009). Significantly fewer WT-NEUROG3 transfected cells expressed red protein than controls (FT only or FT-NEUROD1; Figure 5C), demonstrating that NEUROG3 has a short half-life and suggesting its presence promotes degradation of fused FT. Mutation of a putative ubiquitin/SUMO target residue (K121A) or the phosphorylation initiation site (S183A) stabilized fused FT, while mutating the analogous SUMOylation (K139A) site in NEUROD1 had no effect (Figure 5C). Blocking nuclear export (leptomycin B; Figure S4) or inhibiting the proteasome (MG132) significantly increased red WT-NEUROG3-expressing cells (Figure 5D), demonstrating that NEUROG3 is targeted for proteasomal degradation outside the nucleus. Coexpression of NEUROG3 heterodimerization partner E47 significantly increased the red population of WT-NEUROG3-expressing cells but not that of cells expressing T120A (Figure 5E), showing that E47 interaction stabilizes NEUROG3. Notably, S183A significantly increased NEUROG3 half-life (Figures 5C and 5E), confirming that S183 destabilizes NEUROG3 by allowing phosphorylation and degradation. These results indicate that phosphorylated NEUROG3 is targeted for cytoplasmic proteosomal degradation during G2-M and that the S183 is the phosphorylation seed region that initiates this degradation.
NEUROG3 Is Phosphorylated by G1 CDKs
The residues in Neurog1 and Neurog2 analogous to S183 in NEUROG3 are reportedly phosphorylated by ERK5 (Cundiff et al., 2009) and GSK3 (Ma et al., 2008), respectively. In addition, we found that CDK, p38 MAPK, and JNK family members are predicted candidates for the phosphorylation of NEUROG3 (Linding et al., 2007). Inhibiting ERK5/MAPK7 (BIX02189), MAPK (LY2228820), JNK (SP600125), or GSK3 (SB216763) did not alter phosphorylation of NEUROG3 in HeLa cells (Figure 6A), suggesting that other kinases, such as CDKs, are responsible for phosphorylation of NEUROG3.
Figure 6. NEUROG3 Is Phosphorylated by G1-S Cyclin-Dependent Kinases.
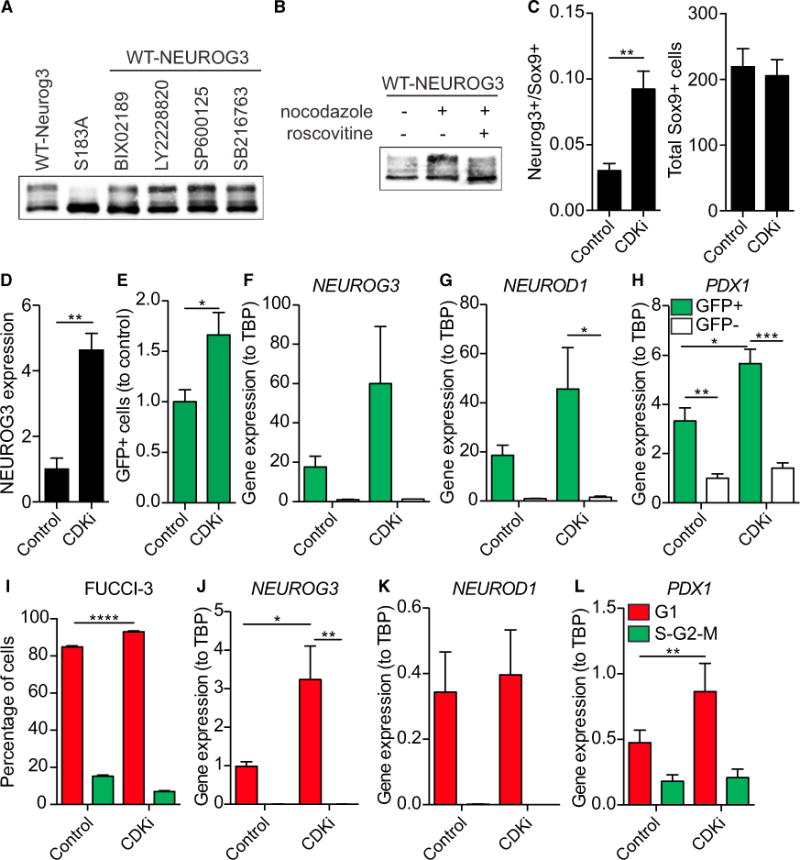
(A) Anti-FLAG western blot of HeLa cell lysates expressing indicated NEUROG3 variants were incubated with nocodazole alone or in combination with BIX02189, LY2228820, SP600125, or SB216763.
(B) Anti-FLAG western blot on HeLa cell lysates expressing FLAG-tagged WT-NEUROG3 were either untreated, incubated with nocodazole alone, or incubated with both nocodazole and roscovitine.
(C) Mouse pancreatic explants were cultured for 24 hr starting at E11.5 with Cdk2 and 4/6 inhibitors (CDKi) and the number of Neurog3+ cells/Sox9+ cells and the total Sox9+ cells were quantified by immunofluorescence staining. n = 5. **p < 0.01 by unpaired t test.
(D) Stage-6 endocrine progenitor cells derived from a human iPSCs were treated for 24 hr with CDKi and NEUROG3 protein was quantified by western blot. n = 3 wells. **p < 0.01 by unpaired t test.
(E) GFP+ cells were quantified using a NEUROG3-2A-eGFP hESCs (N5-5) differentiated to stage 6 prior to 24-hr CDKi treatment. n = 9 wells from two differentiations. *p < 0.05 by Mann-Whitney U test.
(F) NEUROG3 expression in FACS purified GFP+ N5-5 cells following CDKi treatment at stage 6. n = 3 wells from two differentiations.
(G) CDKi treatment increased expression of NEUROD1 in FACS purified GFP+ cells. n = 3 wells from two differentiations. *p < 0.05 by one-way ANOVA and Tukey post hoc test.
(H) CDKi treatment increased expression of PDX1 in FACS purified GFP+ cells. n = 3 wells from two differentiations. *p < 0.05, **p < 0.01, ***p < 0.001 by one-way ANOVA and Tukey post hoc test.
(I) CDKi treatment of stage-6 endocrine progenitors, derived from the FUCCI-3 hESC line, increased the proportion of cells in G1 (red) and decreased the proportion of cells in S-G2-M (green). n = 5 wells from two differentiations. ****p < 0.0001 by one-way ANOVA and Tukey post hoc test.
(J) CDKi treatment of stage-6 endocrine progenitors derived from FUCCI-3 hESC line significantly increased expression of NEUROG3 in G1 (red) cells. n = 4 wells from two differentiations. *p < 0.05, **p < 0.01 by one-way ANOVA and Tukey post hoc test.
(K) Expression of NEUROD1 was upregulated in G1 (red) cells compared with S-G2-M (green). n = 5 wells from two differentiations.
(L) CDKi treatment of stage-6 endocrine progenitors derived from FUCCI-3 hESC line significantly increased expression of PDX1 in G1 (red) cells. n = 5 wells from two differentiations. **p < 0.01 by one-way ANOVA and Tukey post hoc test.
Data are presented as mean ± SEM. See also Figure S5.
Blocking the HeLa cell cycle in M phase with nocodazole increased the hyperphosphorylated form of NEUROG3, supporting the model that NEUROG3 is progressively phosphorylated as cells transition through the cell cycle by CDKs (Figure 6B). In addition, the CDK2 inhibitor roscovitine reverses nocodazole-stimulated NEUROG3 hyperphosphorylation (Bach et al., 2005; Bain et al., 2007).
As overexpression of Cdkn1b, an inhibitor of G1-S CDKs (i.e., CDK2, CDK4, CDK6), increased the number of NEUROG3+ cells (Figure 2B), the effect of inhibition of Cdk2, Cdk4, and Cdk6 using specific small-molecule inhibitors was next investigated in mouse embryonic pancreas explants. Embryonic pancreata were isolated at E11.5 and treated ex vivo for 24 hr with Cdk4/6 inhibitor PD-03329911 and Cdk2 inhibitors ii and iii (CDKi). This resulted in a 3-fold increase in the number of Neurog3+ cells without altering the total number of Sox9+ progenitor cells (Figure 6C), as assessed by immunofluorescence. Furthermore, treating human pancreatic progenitors, derived from human induced pluripotent stem cells (iPSCs) using a modified version of the Rezania et al. (2014) protocol, with CDKi for 24 hr also increased the expression of NEUROG3 protein detected by western blot (Figure 6D). These findings further bolster the role of CDKs in the destabilization of NEUROG3 during development.
To investigate the consequences of CDK inhibition on endocrine differentiation, we generated NEUROG3-2A-eGFP knock-in reporter CyT49 hESC lines using CRISPR/Cas9 (Figure S5). The three clonal lines that were tested (N2-2, N4-7, and N5-5) all formed definitive endoderm with similar efficiency to the parental CyT49 hESC line (Figure S5A). However, upon further differentiation to endocrine progenitors (stage 6), N5-5 had higher efficiency of forming NEUROG3+ cells (Figure S5B). To confirm the fidelity of the GFP fluorescence to the endocrine lineages, we differentiated NEUROG3 reporter lines to stage 6 and GFP+ and GFP− cells were FACS sorted prior to gene expression analyses. As expected, GFP+ cells had significantly increased expression of NEUROG3 and INSULIN (Figure S5C) compared with GFP− and CyT49 cells. Conversely, SOX9 expression was enriched in GFP− cells compared with GFP+ (Figure S5C). For further studies, N5-5 was used to identify NEUROG3+ lineage cells based on GFP fluorescence.
CDKi treatment of human endocrine progenitors derived from N5-5 significantly increased the number of GFP+ cells by 1.7-fold as determined by flow cytometry (Figure 6E). Consistent with our findings that phosphorylation of NEUROG3 reduces its transcriptional activity (Figure 4), the expression of NEUROG3 and NEUROD1, which are direct targets of NEUROG3, and PDX1, which is a β/δ-cell marker, were all increased in NEUROG3-lineage cells following CDKi treatment (Figures 6F–6H).
To investigate the role of the cell cycle and CDK inhibition on human endocrine cell differentiation, we generated a transgenic CyT49 hESC cell-cycle reporter line using fluorescence ubiquitination-based cell-cycle indicator (FUCCI) (Sakaue-Sawano et al., 2008). This line (FUCCI-3) allows for the facile isolation of cells in G1 (red) versus S-G2-M (green) based on fluorescence. Treating stage-6 cells derived from the FUCCI-3 line with CDKi increased the proportion of cells in G1 from 85% to 93%, suggesting the CDKi treatment slows the G1 phase (Figure 6I). FACS was next used to isolate G1 and S-G2-M cells following CDKi and gene expression analyses were performed, which indicated that expression of NEUROG3, NEUROD1, and PDX1 are significantly upregulated in G1 compared with S-G2-M cells (Figures 6J–6L). In addition, CDKi treatment significantly increased the expression of both NEUROG3 and PDX1 in G1-phase cells compared with control vehicle-treated cells (Figures 6J and 6L).
Taken together, these findings demonstrate that G1 lengthening occurs during mouse and human pancreatic endocrine genesis. This lengthening allows for NEUROG3 stabilization due to reduced activity of CDKs that are not active until the G1/S transition, resulting in the NEUROG3 transcriptional regulation that drives cell-cycle exit and endocrine differentiation. Conversely, in rapidly dividing progenitor cells with a short G1 length, the combined actions of CDK2 and CDK4/6 lead to phosphorylation of NEUROG3 at the G1/S transition and rapid proteosomal degradation in the cytosol as cells progress through S-G2-M.
DISCUSSION
Pancreatic endocrine cell development is initiated by Neurog3 activation within bipotent trunk progenitor cells. Following the initiation of endocrine differentiation, silencing of further Neurog3 expression ensures normal endocrine differentiation and function (Miyatsuka et al., 2011). Prior to this work, it was not clear how Neurog3 was stabilized within a subset of trunk progenitors, nor was it understood how Neurog3 was rapidly degraded after initiating differentiation. This study aimed to address these two open questions.
Building on previous work (Bankaitis et al., 2015; Kim et al., 2015) we demonstrate that the mouse pancreatic progenitor cell cycle lengthens as a result of G1 phase lengthening from 4.5 to 7.2 hr between E11.5 and E13.5. Furthermore, we show that this progenitor cell-cycle lengthening is required for efficient induction of Neurog3 and that CDKs active in cycling cells target Neurog3 for proteosomal degradation. This work demonstrates that cycling of pancreatic and endocrine progenitors may be essential for the dynamic regulation of Neurog3.
While our study identifies changes in G1 length during pancreas development, there are several studies that have noted this phenomenon in other cell types. For instance, during neural development the length of G1 increases from 3.2 to 12.4 hr over the course of 5 days in the pseudostratified ventricular epithelium, the region of the brain where the majority of neocortical neurons originate (Takahashi and Nowakowski, 1995). In addition, hESCs have a short cell-cycle length due to a reduced length of the G1 phase (Becker et al., 2006), and differentiation is accompanied by an increase in G1 length (Becker et al., 2010). Also, hESCs isolated in the G1 phase have a greater propensity to differentiate than cells isolated in S and G2 phases (Sela et al., 2012).
The data presented in this work support and extend the “cell-cycle length hypothesis” put forward for neural development (Salomoni and Calegari, 2010). This hypothesis posits that a particular threshold for a cell-fate determinant (e.g., NEUROG3) is required for differentiation to occur. By lengthening the G1 phase of the cell cycle, more time is provided for the accumulation of Neurog3, which then surpasses its threshold to transcriptionally activate CDK inhibitors, such as Cdkn1a/p21, resulting in cell-cycle arrest and endocrine differentiation. Consistent with this model, we find that transcription of NEUROG3 is upregulated in the G1 phase of the cell cycle during human development and that G1 CDKs, whose actions result in the G1/S phase transition, act to destabilize NEUROG3. Notwithstanding the evidence, it remains possible that the G1 CDKs do not directly phosphorylate NEUROG3 but initiate a phosphorylation cascade that results in NEUROG3 destabilization. We hope that our future work will uncover whether additional kinases phosphorylate NEUROG3 and determine whether these kinases regulate NEUROG3 in vivo.
In mice, the existence of a population of pancreatic progenitor cells with low expression of Neurog3 mRNA but no detectable Neurog3 protein has been reported (Bechard et al., 2016; Villasenor et al., 2008). This could be explained by the rapid phosphorylation and degradation of Neurog3 due to high CDK expression. While Neurog3 can be detected for a few days in the developing pancreas, it lasts for only a few hours in individual cells (Miyatsuka et al., 2009), consistent with the rapid turnover of NEUROG3 protein (Figure 5). This interplay between cell-cycle machinery and differentiation has been demonstrated during mammalian neural development whereby inhibition of Cdk2 (Calegari and Huttner, 2003) or Cdk4 drives differentiation (Calegari et al., 2005). We have identified other transcription factors important for progenitor cell maintenance that we believe are stabilized during the G1/S transition by cell-cycle kinases and ensure rapid transit through this checkpoint to maintain progenitor fate (F.C.L. and N.A.J.K., unpublished data). Future studies will be targeted at elucidating how cell-cycle kinases and transcription factor stability are inter-related and interdependent.
An interesting question that arises from this work, and the cell-cycle length hypothesis, is how does G1 lengthening occur? Although we did not set out to answer this question, it likely results from both cell-autonomous and/or non-cell-autonomous mechanisms (Kim et al., 2015). For instance, this study suggests there is a complex relationship between cell-cycle length and differentiation that is regulated, cell-autonomously, by relative levels of transcription factors. It is also possible that factors secreted by the mesenchyme could play a non-cell-autonomous role in regulating G1 length. For example, mesenchymal Fgf10 is required for the proliferation of Pdx1+ pancreatic progenitors (Bhushan et al., 2001). The shorter G1 length of the tip progenitors, which are in apposition with surrounding mesenchyme, supports a potential role for a mesenchymal secreted factor. Analysis of cell-cycle length in models of impaired endocrine differentiation, using approaches developed herein, could elucidate mechanisms that endogenously control G1 lengthening during pancreas development.
In addition to the CDK-dependent phosphorylation of NEUROG3, the half-life of Neurog3 is controlled by other post-translational modifications (PTMs) (Barrow et al., 2005; Miyatsuka et al., 2009). Mouse Neurog3 can be ubiquitinated on lysines as well as non-canonical residues (Roark et al., 2012). Mutating the lysine residues doubles the half-life of Neurog3 (K121A; Figure 5). In addition, the slow-migrating, phosphatase-insensitive form of NEUROG3 observed in the 8A/S183 lane of Figure 3D (double arrow) is likely additional evidence of ubiquitination or SUMOylation. It remains unclear whether there is a direct link between phosphorylation and other PTMs that target NEUROG3 for degradation, and future studies will aim to address this question. Furthermore, how NEUROG3 PTMs affect its interactions with other proteins in the nucleus and its target gene repertoire are yet undescribed.
Studying the role of cell-cycle proteins during pancreas development has largely been through the use of knockout mice. Interpreting these studies is difficult, as altering expression of cell-cycle proteins could reduce overall numbers of pancreatic progenitors, which dictates the final size of the adult organ and its physiological function (Stanger et al., 2007). For instance, loss of Cdk4 leads to reduced proliferation of Pdx1+ pancreatic progenitors at E12.5, possibly due to a defect in pancreatic mesenchyme, resulting in a reduced number of Neurog3+ cells (Kim and Rane, 2011). However, our studies suggest that temporary reductions in Cdk4 may result in stabilization of Neurog3. It would be interesting to revisit this study using an inducible system that allows for spatiotemporal control of Cdk4 knockout in vivo.
In summary, this work shows that cell-cycle length regulates the balance between proliferation and differentiation during pancreatic development. In particular, G1 lengthening, NEUROG3 stabilization by minimizing phosphorylation, and subsequent NEUROG3-driven cell-cycle exit combine to ensure that endocrine differentiation occurs in non-dividing cells. This research uncovers a complex and interacting set of protein modifications that govern NEUROG3 activity and, in turn, endocrine cell generation. Given the critical importance of pancreatic endocrine cell generation and the potential clinical utility of methods for controlling it, a better understanding of this complex system and the signals that influence it should be the subject of future investigation.
STAR★METHODS
KEY RESOURCES TABLE
| REAGENT or RESOURCE | SOURCE | IDENTIFIER |
|---|---|---|
| Antibodies | ||
| Donkey polyclonal Anti-mouse IgG | Jackson ImmunoResearch | Cat#715-001-003; RRID: AB_2307338 |
| Goat polyclonal anti-Cpa1 | R&D systems | Cat#AF2765; RRID: AB_2085841 |
| Guinea Pig anti-NEUROG3 | Schwitzgebel et al., 2000 | German Lab |
| Guinea Pig polyclonal anti-Insulin | DAKO | Cat#A056401-2; RRID: AB_2617169 |
| Mouse monoclonal anti-FLAG | Sigma-Aldrich | Cat#F3165; RRID: AB_259529 |
| Mouse monoclonal anti-Glucagon | Sigma-Aldrich | Cat#G2654; RRID: AB_259852 |
| Mouse monoclonal anti-Neurog3 | Developmental Studies Hybridoma Bank | Cat#F25A1B3; RRID: AB_528401 |
| Mouse monoclonal anti-Pdx1 | Developmental Studies Hybridoma Bank | Cat#F109-D12; RRID: AB_1157903 |
| Rabbit polyclonal anti-ChromograninA | Thermo Scientific | Cat#RB-9003-P1; RRID: AB_149730 |
| Rabbit polyclonal anti-P27 | Cell Signaling Technology | Cat#2552S; RRID: AB_10693314 |
| Rabbit polyclonal anti-pHH3 | Cell Signaling Technology | Cat#9701 |
| Rabbit polyclonal anti-Sox9 | Millipore | Cat#AB5535; RRID: AB_2239761 |
| Rabbit polyclonal anti-β-actin | Abcam | Cat#AB8227; RRID: AB_2305186 |
| Sheep polyclonal anti-NEUROG3 | R&D systems | Cat#AF3444; RRID: AB_2149527 |
| Biological Samples | ||
| CyT49 human embryonic stem cell (passages 20-p31) | Viacyte | CyT49; NIH hESC-10-0041 |
| Human Peripheral Blood Mononuclear Cells | STEMCELL Technologies | Cat#70025.1 |
| Chemicals, Peptides, and Recombinant Proteins | ||
| 5′-Ethynyl-2′-deoxyuridine (EdU) | Sigma-Aldrich | Cat#T511285 |
| Alexa Fluor 594 Carboxamido-(6-Azidohexanyl), Triethylammonium Salt | ThermoFisher Scientific | Cat#A10270 |
| Ascorbate | Sigma-Aldrich | Cat#A4544 |
| Accutase | STEMCELL Technologies | Cat#07920 |
| Activin A | E-biosciences | Cat#34-8993-85 |
| Alexa-Fluor 594 azide | ThermoFisher Scientific | Cat#A10270 |
| BIX02189 | Tocris Biosciences | Cat#4842 |
| Bovine Serum Albumin | Sigma-Aldrich | Cat#A3803 |
| Cdk2 inhibitor II | EMD Millipore | Cat#219445 |
| Cdk2 inhibitor III | EMD Millipore | Cat#238803 |
| CHIR-99021 | Sigma-Aldrich | Cat#SML1046 |
| Copper Sulfate | Sigma-Aldrich | Cat#451657 |
| DAPI | Sigma-Aldrich | Cat#D9542 |
| DMEM/F12 | Corning | Cat#15-090-CV |
| Doxycycline | Sigma-Aldrich | Cat#D9891 |
| FBS (GIBCO) | ThermoFisher Scientific | Cat#12483020 |
| Gamma secretase inhibitor XX | EMD Millipore | Cat#565789 |
| Geltrex | ThermoFisher Scientific | Cat#A1433302 |
| Glutamax | ThermoFisher Scientific | Cat#35050061 |
| Herugulin | PeproTech | Cat#100-03 |
| Hoescht 33342 | ThermoFisher Scientific | Cat#H1399 |
| Horse Serum (GIBCO) | ThermoFisher Scientific | Cat#16050122 |
| Hyclone D-PBS | GE Healthcare Bio-Science | Cat#SH30028.01 |
| Hyclone DMEM | GE Healthcare Bio-Science | Cat#SH30081 |
| Hyclone Penicillin/Streptomycin (P/S) | GE Healthcare Bio-Science | Cat#SV30010 |
| Insulin-Transferrin-Selenum (ITS-X) | ThermoFisher Scientific | Cat#51500056 |
| KGF | R&D Systems | Cat#251-KG |
| LDN193189 | EMD Millipore | Cat#509882 |
| Leptomycin B | Sigma-Aldrich | Cat#L2913 |
| LY2228820 | SelleckChem | Cat#S1491 |
| MCDB 131 | USBiological Life Sciences | Cat#E3000-01B |
| MG132 | Cayman | Cat#1211877-36-9 |
| Nocodazole | Sigma-Aldrich | Cat#31430-18-9 |
| Paraformaldehyde | Sigma-Aldrich | Cat#P6148 |
| PD-0332991 | Sigma-Aldrich | Cat#PZ0199 |
| Primestar DNA polymerase | Takara Clontech | Cat#R010A |
| Puromycin | Sigma-Aldrich | Cat#P8833 |
| QuickExtract | Epicentre | Cat#QE09050 |
| ReLeSR | STEMCELL Technologies | Cat#05872 |
| ReproTESR | STEMCELL Technologies | Cat#05920 |
| Repsox | Sigma-Aldrich | Cat#R0158 |
| Restriction Enzymes | New England Biolabs | N/A |
| Retinoic Acid | Sigma-Aldrich | Cat#R2625 |
| Roscovitine | Sigma-Aldrich | Cat#R7772 |
| SANT-1 | Tocris Biosciences | Cat#1974 |
| SB216763 | SelleckChem | Cat#S1075 |
| Sodium Bicarbonate | Sigma-Aldrich | Cat#S6297 |
| SP600125 | Sigma-Aldrich | Cat#S5567 |
| T3 | Sigma-Aldrich | Cat#6397 |
| TeSR-E8 Kit for hESC/hiPSC Matinenance | STEMCELL Technologies | Cat#05940 |
| To-PRO-3 Iodide | ThermoFisher Scientific | Cat#T3505 |
| Tris Base | Fisher Scientific | Cat#BP152 |
| Tris HCl | Fisher Scientific | Cat#BP153 |
| Triton X-100 | Sigma-Adrich | Cat#T8787 |
| Trizol | ThermoFisher Scientific | Cat#15596018 |
| Vibrant DyeCycle Violet | ThermoFisher Scientific | Cat#V35003 |
| XenoFree KOSR | ThermoFisher Scientific | Cat# A1099202 |
| Zinc Sulfate | Sigma-Aldrich | Cat#Z0251 |
| α-Amyloid Precursor Protein Modulator | EMD Millipore | Cat#565740 |
| λ-phosphatase | New England Biolabs | Cat#P0753 |
| Critical Commercial Assays | ||
| CytoTune-iPS 2.0 Sendai Reprogramming Kit | ThermoFisher Scientific | Cat#A16517 |
| Dual Luciferase Assay | Promega | Cat#E1960 |
| Erythroid Progenitor Reprogramming Kit | STEMCELL Technologies | Cat#05924 |
| Lipofectamine 2000 | ThermoFisher Scientific | Cat#11668027 |
| Lipofectamine 3000 | ThermoFisher Scientific | Cat#L3000015 |
| QuickExtract DNA Extraction Solution | Epicentre | Cat#QE09050 |
| Experimental Models: Cell Lines | ||
| Human: FUCCI-3: CyT49 FUCCI-3 transgenic hESC line | This paper | N/A |
| Human: N5-5: CyT49 Neurog3-2A-eGFP hESC line | This paper | N/A |
| Experimental Models: Organisms/Strains | ||
| Mouse: CD-1 | Charles River | Crl:022 |
| Mouse: Pdx1-Cre: B6.Cg-Tg(Pdx1-cre)89.1Dam/Mmucd | Mutant Mouse Regional Resource Centers | MMRRC:015970-UCD |
| Mouse: KrasLSL-G12D: B6.129S4-Krastm4Tyj/J | The Jackson Laboratory | JAX:008179 |
| Mouse: TetO-Cdkn1b: C57BL/6(tetO-Cdkn1b)1Scpr/J | The Jackson Laboratory | JAX:017613 |
| Mouse: Sox9-rtTA: C57BL/6-BAC-Sox9-rTTA | This paper | N/A |
| Recombinant DNA | ||
| Hnf1α expression plasmid | Smith et al., 2003 | N/A |
| pCAGGS-FUCCI | This paper | N/A |
| pCCC | Krentz et al., 2014 | N/A |
| pCCC-LL502/3 | This paper | N/A |
| px458 | Ran et al., 2013 | Addgene #48138 |
| Sequence-Based Reagents | ||
| Mouse Gusb (Mm00446953_m1) | ThermoFisher Scientific | Cat#4331182 |
| Mouse Neurod1 (Mm01280117_m1) | ThermoFisher Scientific | Cat#4331182 |
| Mouse Pax4 (Mm01159036_m1) | ThermoFisher Scientific | Cat#4331182 |
| Mouse Sst (Mm00436671_m1) | ThermoFisher Scientific | Cat#4331182 |
| Human NEUROD1 probe (FAM/ZEN/IaBKFQ): CGCCAGTTTCACCATTTCCGGG | IDT | N/A |
| Human NEUROD1 primer 1: TCCTTCGATAGCCATTCACATC | IDT | N/A |
| Human NEUROD1 primer 2: GCTGCCTTTTGTAAACACGAC | IDT | N/A |
| Human NEUROG3 gRNA: GGGTCGCTCCTCCAGCGACG | IDT | N/A |
| Human NEUROG3 probe (FAM/ZEN/IaBKFQ): AGCGGTCCTTCCCCAGAGC | IDT | N/A |
| Human NEUROG3 primer 1: TCTATTCTTTTGCGCCGGTAG, | IDT | N/A |
| Human NEUROG3 primer 2: GCAGGTCACTTCGTCTTCC | IDT | N/A |
| Human PDX1 probe (FAM/ZEN/IaBKFQ): CGC TTGTTCTCCTCCGGCTCC | IDT | N/A |
| Human PDX1 primer 1: TGAAGTCTACCAAAGCTCACG | IDT | N/A |
| Human PDX1 primer 2: GGAACTCCTTCT CCAGCTCTA | IDT | N/A |
| Neurog3-2A-eGFP PGK-Puro 3′ arm genotyping Forward primer: ATCAGCAGCCTCTGTTCCAC | IDT | N/A |
| Neurog3-2A-eGFP PGK-Puro 3′ arm genotyping Reverse primer: GGAGTCATCTTGCCAAGGCT | IDT | N/A |
| Neurog3-2A-eGFP PGK-Puro 5′ arm genotyping Forward primer: GGTAGAAAGGTAATATTTGGAGGCCT | IDT | N/A |
| Neurog3-2A-eGFP PGK-Puro 5′ arm genotyping Reverse primer: CTGAACTTGTGGCCGTTTACG | IDT | N/A |
| Software and Algorithms | ||
| CellProfiler | Carpenter et al., 2006 | http://cellprofiler.org |
| NoD | Scott et al., 2010 | http://www.compbio.dundee.ac.uk/www-nod/ |
| NucPred | Brameier et al., 2007 | http://www.sbc.su.se/~maccallr/nucpred/cgi-bin/single.cgi |
| SUMOsp | Xue et al., 2006 | http://sumosp.biocuckoo.org/ |
| WoLF PSORT | Horton et al., 2007 | http://wolfpsort.org/ |
CONTACT FOR REAGENT AND RESOURCE SHARING
Further information and requests for reagents may be direct to, and will be fulfilled by, the Lead Contact, Dr. Francis C. Lynn (francis.lynn@ubc.ca).
EXPERIMENTAL MODEL AND SUBJECT DETAILS
Mouse Models
The UBC and UCSF Animal Care Committees approved animal experiments. Mice were housed on laboratory chow diet on a 12-hour light-dark cycle. Noon on the morning of the discovery of a vaginal plug was considered embryonic day (E)0.5. CD-1 mice were obtained from Charles River. Frozen embryos of Pdx1-Cre (Gu et al., 2002) mice were obtained from the MMRRC and were rederived by the BC Preclinical Research Consortium (Vancouver BC, Canada). KrasLSL-G12D mice (Jackson et al., 2001) and C57BL/6(tetO-Cdkn1b)1Scpr/J mice (Pruitt et al., 2013) were purchased from Jackson Laboratory. Sox9-rtTA transgenic mice were made by recombining the reverse tetracycline transactivator (Clontech; pTet-On) into the Sox9 coding region of a 202kb BAC (RP23-36D5); transgenic mice were generated by the UCSF transgenic core as described (Shimajiri et al., 2011). Transgene expression was induced in pregnant Sox9-rtTA; tetO-Cdkn1b with daily 1 mg intraperitoneal (IP) injections of doxycycline on indicated gestational days.
Generation of NEUROG3-2A-eGFP and FUCCI CyT49 hESC Lines
To generate NEUROG3-2A-eGFP knock-in hESC line, the CRISPR/Cas9 system was used as previously described (Krentz et al., 2014). pCCC contains a full-length CAGGS promoter to replace the Cbh promoter of px458, improving expression in hESC CyT49 cells. The gRNA (GGGTCGCTCCTCCAGCGACG; score 0.73) was designed using the algorithm reported by Doench et al (Doench et al., 2014) and was cloned into the BbsI sites of pCCC to generate pCCC-LL502/3 as described by Ran et al (Ran et al., 2013). The targeting vector was based on Addgene #31938, contained ~800bp NEUROG3 homology arms and is available upon request. Electroporation, selection, and picking of clones was performed as previously described using 40 μg of donor and 15 μg of CRISPR/Cas vectors (Krentz et al., 2014). Genomic DNA was extracted using QuickExtract.
To generate FUCCI transgenic CyT49, 106 cells were plated into 6-well plate and 4 μg of FUCCI construct was transfected using lipofectamine 3000. Cells were selected for integration using 0.25 ug/mL puromycin and clones were picked based on fluorescence expression. mKO-hCDt-2A-mAG-hGem-2A-Puro was cloned into a custom pCAGGS expression vector; further details and vector are available upon request.
Induced Pluripotent Stem Cell Generation
Human iPSCs were generated in house from male human PBMCs by infecting erythroid progenitors (Erythroid Progenitor Reprogramming Kit) with Sendai virus as outlined in the manufacturer’s protocol (Cytotune 2.0). Cells were plated on Geltrex after 48 hours and subsequently transitioned to ReproTeSR from days 4–7 post-infection (StemCell Technologies). At 3 weeks post-infection, iPSC clones were picked into and maintained in mTeSR-E8 (StemCell Technologies) in Geltrex-coated 96-well plates. Clones were passaged using ReLeSR (Stem Cell Technologies) every 4–6 days until passage 15. Sendai virus transgene expression was then analysed, and found to be absent, using Taqman (Life Technologies) and pluripotency assessed by immunostaining and qPCR.
Human Pluripotent Stem Cell Differentiations
CyT49 or hIPSCs were plated onto Geltrex (1:100)-coated 12 well plates at a density of 0.5 × 10⁶ in 10/10 media [DMEM/F12, 10% Xenofree-KOSR, Glutamax, P/S, 10 ng/mL Activin A and 10 ng/mL Herugulin-1β]. Differentiations began 48 hours post-seeding using a modified version of Rezania et al (Rezania et al., 2014). Briefly, cells were rinsed with 1 × DPBS and then basal culture media (MCDB 131 medium, 1.5 g/L sodium bicarbonate, 1 × Glutamax, 1 × P/S) with 10 mM final glucose, 0.5% BSA, 100 ng/mL Activin A, and 3 μM of CHIR-99021 was added for 1 day only. For the following two days, cells were treated with the same media without CHIR-99021 compound to generate definitive endoderm (Stage 1). On day four, cells were cultured in basal media with 0.5% BSA, 10 mM glucose, 0.25 mM ascorbic acid and 50 ng/mL of KGF for 2 days to generate primitive gut tube (Stage 2). To produce posterior foregut (Stage 3), cells were treated for three days with basal media with 10 mM final glucose concentration, 2% BSA, 0.25 mM ascorbic acid, 50 ng/mL of KGF, 0.25 μM SANT-1, 1 μM retinoic acid, 100 nM LDN193189, 1:200 ITS-X, and 200 nM α-Amyloid Precursor Protein Modulator (APPM). For stage 4, cells were treated with basal media with 10 mM glucose, 2% BSA, 0.25 mM ascorbic acid, 2 ng/mL of KGF, 0.25 μM SANT-1, 0.1 μM retinoic acid, 200 nM LDN193189, 1:200 ITS-X, and 100 nM APPM for 3 days to generate pancreatic progenitors. Cells were maintained as planar cultures and media was changed to basal media with 20 mM glucose, 2% BSA, 0.25 μM SANT-1, 0.05 μM retinoic acid, 100 nM LDN193189, 1:200 ITS-X, 1 μM T3, 10 μM Repsox, and 10 μM zinc sulfate for 3 days to generate pancreatic endocrine precursors (Stage 5). Finally, cells were treated for two days in stage 6 media: basal media with 20 mM final glucose concentration, 2% BSA, 100 nM LDN193189, 1:200 ITS-X, 1 μM T3, 10 μM Repsox, 10 μM zinc sulfate, 100 nM gamma secretase inhibitor XX. CDKi treatment (2.5 μM CDK4/6 inhibitor PD-0332991, 1 μm CDK2 inhibitor ii and 1 μm CDK2 inhibitor iii) was carried out for 24 hours in Stage 5 or 6. For flow cytometric analysis, cells were treated with Accutase to generate single cells and fixed in 4% PFA for 15 min before analysis for GFP expression on BD Canto or for FUCCI expression on BD Fortessa. For FACS, cells were treated with Accutase to generate single cells and sorted based on GFP or FUCCI proteins directly into Trizol for downstream RNA analysis.
METHOD DETAILS
Analysis of EdU Cumulative Labeling
EdU cumulative labeling studies were carried out as previously described (Takahashi et al., 1993). At 9AM, pregnant dams were given 1 mg 5-Ethynyl-2′-deoxyuridine (EdU; IP), followed by subsequent 0.25 mg IP doses at 1.5 hr intervals. Embryos were collected 0.5 hours after the last injection. Pancreata were fixed in 4% paraformaldehyde, dehydrated and paraffin embedded as described (Xu et al., 2015). At least 8 sections spaced across the pancreas of 4–13 embryos from 2 dams were analyzed at each time point. In total, over 100 embryos from 62 pregnant dams were used to quantify over 50,000 pancreatic progenitors. Custom CellProfiler pipelines were used for image analyses (Carpenter et al., 2006). To determine the lengths of the G1-, S-, G2-M-phases of the cell cycle, the percent of EdU+ progenitor cells was plotted against the labeling time and the data was fit using least squares linear regression. To measure the length of G2-M (TG2-M), the time for all EdU-labeled cells to exit S, transit through G2 and enter mitosis (pHH3+ [1:1000]) after a single pulse of EdU was determined using least squares linear regression.
Immunofluorescence (IF) and Flow Cytometry
For fluorescent staining and EdU detection of fixed tissue, paraffin slides were deparaffinized and rehydrated followed by antigen retrieval for 20 minutes in a 95° C pH 6 citrate buffer. Slides were washed in PBS and permeabilized with 0.5% Triton-X before EdU detection was performed by incubating slides for 1h with: 100 mM Tris pH 8.5, 1mM CuSO4, 30 uM Alexa Fluor 594 azide triethylammonium, 100 mM ascorbate in H20 (Salic and Mitchison, 2008). After three washes in PBS, slides were blocked for 30 minutes each in blocking buffer (5% horse serum) and 1:50 anti-mouse IgG in blocking buffer. Primary antibodies were incubated at 4° overnight at the following dilutions: mouse anti-Pdx1 (1:100), goat anti-Cpa1 (1:250), mouse anti-Neurog3 (1:100), rabbit anti-P27 (1:500), rabbit anti-Sox9 (1:500), rabbit anti-Chga (1:400), mouse anti-Glucagon (1:2000), rabbit anti-Insulin (1:1000). Secondary antibodies from Jackson ImmunoResearch were incubated at room temperature for 1–2 hours at the following dilutions: anti-488 (1:250) and anti-Cy3 (1:450). Slides were mounted using SlowFade Antifade Reagents (Thermo Fisher Scientific) and were imaged with a 20×/0.75 objective using a Leica TCS SP8 confocal system. Custom CellProfiler pipelines were used to quantified immunopositive cells.
For quantitative flow analyses, cells were dissociated with 0.05% trypsin, fixed and stained as described previously (Van Hoof et al., 2011), or stained for 1 h at 37°C in medium containing Vibrant DyCycle Violet. Flow cytometry was conducted with an LSR-II flow cytometer (BD Biosciences); the data were analyzed with FACSDiva software (BD Biosciences). To determine the percent of cells in each cell cycle phase, cells in G0/G1 (one set of chromatids) were identified from G2-M (one set of sister chromatids and pHH3+) based on intensity of DNA stain using Hoescht 33342 (Miyatsuka et al., 2011). Cells in S phase were identified as the population of cells between the G0/G1 and G2-M peaks based on intensity.
Cloning and Mutagenesis
Cloning and mutagenesis of NEUROG3, E47 and FT-NEUROG3 were done as previously described (Van Hoof et al., 2009). The FLAG-tagged wt NEUROG3 ORF was generated by amplifying human NEUROG3 cDNA with PrimeStar DNA polymerase (Takara) using the forward primer 5′-ctcgagccaccATGgattacaaggatgacgacgataagacgcctcaaccctcgggtgcgc (NEUROG3-F) to introduce a XhoI restriction site (underlined), a Kozak sequence (italics; start codon in capitals), and the N-terminal flag tag (bold) in combination with the reverse primer 5′-gcggccgcgTTAcagaaaatctgagaaagccagact (NEUROG3-R) to introduce a NotI restriction site (underlined) and a stop codon (bold capitals). The amplified product was ligated into pCR2.1 TOPO (Life Technologies). This pCR2.1-flag-hNEUROG3 construct was used to generate the single and multiple point mutants by site-directed mutagenesis as described previously (Van Hoof et al., 2009). The flag-tagged NEUROG3Δ6-7 ORF was generated using the forward primer 5′-ctcgagccaccATGgattacaaggatgacgacgataagcagcgacggagtcggcgaaaga to introduce a XhoI restriction site (underlined), a Kozak sequence (italics; start codon in capitals), and the N-terminal flag tag (bold) in combination with the NEUROG3-R reverse primer. The flag-tagged NEUROG3Δ145-187 ORF was generated using the NEUROG3-F forward primer in combination with the reverse primer 5′-gcggccgcgTTAcagaaaatctgagaaagccagactgcctgggctcaagcaggc ggaaaaggtggcccccagcagcccgggtcgctcctccaggtggtccgctatgc gcagcgtttg to introduce a NotI restriction site (underlined) and a stop codon (bold capitals). The flag-tagged NEUROG3ΔHLH ORF was generated using the forward primer NEUROG3-F in combination with the reverse primer 5′-aggttggatcctcgattgcgct cgcggtcgttggc to introduce a BamHI restriction site (underlined), and the forward primer 5′-tgactggatccctgcgcatagcggaccacagcttg to introduce a BamHI restriction site (underlined) in combination with the NEUROG3-R reverse primer. These N-terminal and C-terminal amplification products were digested with XhoI in combination with BamHI, and with BamHI in combination with NotI, respectively, after which they were ligated into the pCR2.1-flag-hNEUROG3, the flag-hNEUROG3 ORF of which was removed using XhoI and NotI. The glycine and serine codons that were introduced as a result of the BamHI restriction sequence were mutated to alanines codons by site-directed mutagenesis as described previously(Van Hoof et al., 2009). The 6 × His-tagged E47 ORF was generated by amplifying Syrian hamster Pan1 cDNA (German et al., 1991) with PrimeStar DNA polymerase (Takara) using the forward primer 5′-gtggcgctcgaggccaccATGgctctttctacgtggcagatggcagcct to introduce a XhoI restriction site (underlined) and a Kozak sequence (italics; start codon in capitals) in combination with the reverse primer 5′-tggtgagcggccgcTCAgtgatgatgatgatgatgcaggtgcccgggcgggttgtgggc to introduce a NotI restriction site (underlined), a C-terminal 6 × His tag (bold) and a stop codon (capitals). All constructs were sequenced prior to subcloning into the CMV promoter-driven mammalian expression vector pBAT12 (Smith et al., 1999) using XhoI and NotI.
Cell Culture, Transfection, Lysis and Phosphatase Treatment
HeLa cells and mPAC cells were grown in DMEM with 10% fetal bovine serum and penicillin/streptomycin (P/S) and transfected with Lipofectamine 2000. As indicated, cells were incubated with 50 ng/mL nocodazole, 1.0 nM leptomycin B, 10 μM MG132, 50 mM roscovitine, 6.0 μM BIX02189, 10 μM LY2228820, 1.0 μM SP600125, 10 μM SB216763 for 24 hours before collection. Cells were washed and either fixed with 2.0% paraformaldehyde or collected in ice-cold PBS with protease inhibitors prior to lysis by sonication. Lysates were cleared by centrifugation and protein concentration determined by BCA assay (Van Hoof et al., 2006). λ-phosphatase treatment was carried out using the manufacturer’s instructions.
SDS-PAGE and Western Blotting
Embryonic pancreata pooled from five E15.5 CD1 embryos were lysed in NRSB with protease inhibitors and analysed by western blot as described (Speckmann et al., 2016). 6.5–50 μg of HeLa cell protein lysate was separated by SDS-PAGE and blotted as described previously (Lynn et al., 2007). Antibodies included: 1:1,000 mouse-anti-FLAG; 1:1,000 rabbit-anti-β-Actin; 1:15,000 donkey-anti-mouse IRDye 800CW and 1:15,000 donkey-anti-rabbit IRDye 680RD (Li-Cor); 1:500 guinea-pig-anti-NEUROG3; 1:1000 sheep-anti-NEUROG3. Immunoreactivity was imaged using near-infrared immunofluorescent detection (Li-Cor Odyssey) or by chemiluminescence and film (Speckmann et al., 2016).
Functional Domain Prediction Software
Putative NLSs in WT NEUROG3 (NCBI accession number NP_066279) were identified with WoLF PSORT http://wolfpsort.org/ (Horton et al., 2007) and NucPred http://www.sbc.su.se/maccallr/nucpred/cgi-bin/single.cgi (Brameier et al., 2007), nucleolar localization signals with NoD http://www.compbio.dundee.ac.uk/www-nod/ (Scott et al., 2010), and ubiquitination/SUMOylation sites with SUMOsp http://sumosp.biocuckoo.org/ (Xue et al., 2006).
Luciferase Assay
Luciferase assays (Promega) were performed according to the manufacturer’s instructions. Transcription factor-containing expression vectors were transfected in a 1:1:1 ratio with the previously described Hnf1α and Luciferase expression constructs (Smith et al., 2003).
Mouse Embryonic Pancreas Explants Treatment and Quantification
The dorsal pancreas of CD1 E11.5 embryos was dissected as previously described (Petzold and Spagnoli, 2012) and transferred to Millicell EZ slides (EMD Millipore) covered in Geltrex diluted 1:1 in DMEM/F12. Explants were allowed to recover and attach overnight in culture medium: DMEM/F12, 10% FBS, Glutamax, P/S, and insulin-transferrin-selenium. The following morning, media was topped up with CDKi for 24 hours: 2.5 μM CDK4/6 inhibitor PD-0332991, 1 μm CDK2 inhibitor ii and 1 μm CDK2 inhibitor iii. Explants were then washed with PBS and fixed in 4% PFA for 30 minutes. After removal of PFA, explants were washed three times with PBS and blocking solution (PBS +0.1% Triton-X and 3% horse serum) was added for a minimum of 1 hr. Primary antibodies (mouse anti-Pdx1 [1:100] and rabbit anti-Sox9 [1:500]) in blocking solution was added to explants and incubated overnight at 4°. The following morning, after three PBS washes explants were incubated with secondary antibodies in blocking solution for 1 hr: anti-mouse 488 (1:250), anti-rabbit 594 (1:450) and nuclei dye To-Pro-3 iodide (1:10,000). Explants were imaged on Leica SP8 confocal using z-stacks to image whole explant and images were quantified using custom CellProfiler pipelines.
qPCR
Cells were lysed in Trizol and standard phenol-chloroform extraction was used to isolate RNA. Following RNA extraction, Superscript III was used for reverse transcription followed by Taqman on ViiA7. Primer sequences are included in STAR Key Resources Table.
QUANTIFICATION AND STATISTICAL ANALYSIS
Statistical analyses were performed using Prism 5 (GraphPad Software). Segmental linear regression using 1000 iterations was used to mathematically model EdU cumulative labelling. Statistically significant differences were assessed using ANOVA followed by either a Dunnett or Tukey post hoc test, t-test or non-parametric tests as appropriate, with p value of < 0.05 deemed significant. Errors bars represent standard error of the mean.
Supplementary Material
Highlights.
The progenitor cell cycle lengthens during embryonic pancreas development
Cell-cycle lengthening is essential for induction of NEUROG3
In trunk progenitors, NEUROG3 is phosphorylated by G1-S CDKs and then degraded
G1 lengthening drives endocrine differentiation by slowing NEUROG3 phosphorylation
Acknowledgments
This work was supported by operating grants to F.C.L. from the JDRF (2-2011-91) and Stem Cell Network (FY17/DT3; FY17/DT4) and to M.S.G. from the NIH (R01 DK021344, UO1 DK089541, and P30 DK063720), the American Diabetes Association (ADA-7-11-MN-22), and the Nora Eccles Treadwell Foundation. Salary (F.C.L.) was supported by the Michael Smith Foundation for Health Research (#5238 BIOM), the Canadian Diabetes Association, and the BC Children’s Hospital Research Institute. Fellowship support was provided by the CIHR-BC Transplantation Trainee Program, the BC Children’s Hospital Research Institute, UBC, and the National Science and Engineering Research Council of Canada PGSD2-475838 (N.A.J.K.), as well as JDRF grant 3-2008-477 (D.V.H.). We thank members of the F.C.L. and M.S.G. labs, K. D’Amour (ViaCyte Inc.), G. Grodsky (UCSF), W. Rutter (UCSF), T. Miyatsuka (Juntendo University), F. Schaufele (UCSF), and D. Morgan (UCSF) for technical support, discussion, and critical reading of the manuscript. Advice on statistical analysis was provided by R. White, T. Zhao, and J. Petkau (UBC). Essential technical support was provided by J. Wang (UBC), L. Xu (UBC), D. Scheel (UCSF), R. Seerke (UCSF), and M. Kissner (UCSF). M.S.G. owns stock in Viacyte Inc. and is an inventor on patents on human NEUROG3 owned by the University of California.
Footnotes
AUTHOR CONTRIBUTIONS
Conceptualization, D.V.H., N.A.J.K., M.S.G., and F.C.L.; Methodology, D.V.H., N.A.J.K., M.S.G., and F.C.L.; Investigation, D.V.H., Z.L., N.A.J.K., M.T., C.N., and A.W.; Resources, F.C.L. and M.S.G.; Writing, D.V.H., N.A.J.K., M.S.G., and F.C.L.; Funding Acquisition, D.V.H., M.S.G., and F.C.L.
SUPPLEMENTAL INFORMATION
Supplemental Information includes five figures and can be found with this article online at http://dx.doi.org/10.1016/j.devcel.2017.02.006.
References
- Apelqvist Å, Li H, Sommer L, Beatus P, Anderson DJ, Honjo T, de Angelis MH, Lendahl U, Edlund H. Notch signalling controls pancreatic cell differentiation. Nature. 1999;400:877–881. doi: 10.1038/23716. [DOI] [PubMed] [Google Scholar]
- Arai Y, Pulvers JN, Haffner C, Schilling B, Nüsslein I, Calegari F, Huttner WB. Neural stem and progenitor cells shorten S-phase on commitment to neuron production. Nat Commun. 2011;2:154. doi: 10.1038/ncomms1155. [DOI] [PMC free article] [PubMed] [Google Scholar]
- Bach S, Knockaert M, Reinhardt J, Lozach O, Schmitt S, Baratte B, Koken M, Coburn SP, Tang L, Jiang T, et al. Roscovitine targets, protein kinases and pyridoxal kinase. J Biol Chem. 2005;280:31208–31219. doi: 10.1074/jbc.M500806200. [DOI] [PubMed] [Google Scholar]
- Bain J, Plater L, Elliott M, Shpiro N, Hastie CJ, Mclauchlan H, Klevernic I, Arthur JSC, Alessi DR, Cohen P. The selectivity of protein kinase inhibitors: a further update. Biochem J. 2007;408:297–315. doi: 10.1042/BJ20070797. [DOI] [PMC free article] [PubMed] [Google Scholar]
- Bankaitis ED, Bechard ME, Wright CVE. Feedback control of growth, differentiation, and morphogenesis of pancreatic endocrine progenitors in an epithelial plexus niche. Genes Dev. 2015;29:2203–2216. doi: 10.1101/gad.267914.115. [DOI] [PMC free article] [PubMed] [Google Scholar]
- Barrow J, Bernardo A, Hay C, Blaylock M, Duncan L, MacKenzie A, McCreath K, Kind A, Schnieke A, Colman A. Purification and characterization of a population of EGFP-expressing cells from the developing pancreas of a neurogenin3/EGFP transgenic mouse. Organogenesis. 2005;2:22–27. doi: 10.4161/org.2.1.1727. [DOI] [PMC free article] [PubMed] [Google Scholar]
- Bechard ME, Bankaitis ED, Hipkens SB, Ustione A, Piston DW, Yang YP, Magnuson MA, Wright CVE. Precommitment low-level Neurog3 expression defines a long-lived mitotic endocrine-biased progenitor pool that drives production of endocrine-committed cells. Genes Dev. 2016;30:1852–1865. doi: 10.1101/gad.284729.116. [DOI] [PMC free article] [PubMed] [Google Scholar]
- Becker KA, Ghule PN, Therrien JA, Lian JB, Stein JL, van Wijnen AJ, Stein GS. Self-renewal of human embryonic stem cells is supported by a shortened G1 cell cycle phase. J Cell Physiol. 2006;209:883–893. doi: 10.1002/jcp.20776. [DOI] [PubMed] [Google Scholar]
- Becker KA, Stein JL, Lian JB, van Wijnen AJ, Stein GS. Human embryonic stem cells are pre-mitotically committed to self-renewal and acquire a lengthened G1 phase upon lineage programming. J Cell Physiol. 2010;222:103–110. doi: 10.1002/jcp.21925. [DOI] [PMC free article] [PubMed] [Google Scholar]
- Bhushan A, Itoh N, Kato S, Thiery JP, Czernichow P, Bellusci S, Scharfmann R. Fgf10 is essential for maintaining the proliferative capacity of epithelial progenitor cells during early pancreatic organogenesis. Development. 2001;128:5109–5117. doi: 10.1242/dev.128.24.5109. [DOI] [PubMed] [Google Scholar]
- Brameier M, Krings A, MacCallum RM. NucPred Predicting nuclear localization of proteins. Bioinformatics. 2007;23:1159–1160. doi: 10.1093/bioinformatics/btm066. [DOI] [PubMed] [Google Scholar]
- Calegari F, Huttner WB. An inhibition of cyclin-dependent kinases that lengthens, but does not arrest, neuroepithelial cell cycle induces premature neurogenesis. J Cell Sci. 2003;116:4947–4955. doi: 10.1242/jcs.00825. [DOI] [PubMed] [Google Scholar]
- Calegari F, Haubensak W, Haffner C, Huttner WB. Selective lengthening of the cell cycle in the neurogenic subpopulation of neural progenitor cells during mouse brain development. J Neurosci. 2005;25:6533–6538. doi: 10.1523/JNEUROSCI.0778-05.2005. [DOI] [PMC free article] [PubMed] [Google Scholar]
- Carpenter AE, Jones TR, Lamprecht MR, Clarke C, Kang IH, Friman O, Guertin DA, Chang JH, Lindquist RA, Moffat J, et al. CellProfiler: image analysis software for identifying and quantifying cell phenotypes. Genome Biol. 2006;7:R100. doi: 10.1186/gb-2006-7-10-r100. [DOI] [PMC free article] [PubMed] [Google Scholar]
- Chamberlain CE, Scheel DW, McGlynn K, Kim H, Miyatsuka T, Wang J, Nguyen V, Zhao S, Mavropoulos A, Abraham AG, et al. Menin determines K-RAS proliferative outputs in endocrine cells. J Clin Invest. 2014;124:4093–4101. doi: 10.1172/JCI69004. [DOI] [PMC free article] [PubMed] [Google Scholar]
- Cokol M, Nair R, Rost B. Finding nuclear localization signals. EMBO Rep. 2000;1:411–415. doi: 10.1093/embo-reports/kvd092. [DOI] [PMC free article] [PubMed] [Google Scholar]
- Cundiff P, Liu L, Wang Y, Zou J, Pan YW, Abel G, Duan X, Ming GL, Englund C, Hevner R, et al. ERK5 MAP kinase regulates Neurogenin1 during cortical neurogenesis. PLoS One. 2009;4:e5204–e5214. doi: 10.1371/journal.pone.0005204. [DOI] [PMC free article] [PubMed] [Google Scholar]
- Desgraz R, Herrera PL. Pancreatic neurogenin 3-expressing cells are unipotent islet precursors. Development. 2009;136:3567–3574. doi: 10.1242/dev.039214. [DOI] [PMC free article] [PubMed] [Google Scholar]
- Doench JG, Hartenian E, Graham DB, Tothova Z, Hegde M, Smith I, Sullender M, Ebert BL, Xavier RJ, Root DE. Rational design of highly active sgRNAs for CRISPR-Cas9-mediated gene inactivation. Nat Biotechnol. 2014;32:1262–1267. doi: 10.1038/nbt.3026. [DOI] [PMC free article] [PubMed] [Google Scholar]
- Fiaschi-Taesch NM, Kleinberger JW, Salim F, Troxell R, Wills R, Tanwir M, Casinelli G, Cox AE, Takane KK, Srinivas H, et al. Cytoplasmic-nuclear trafficking of G1/S cell cycle molecules and adult human beta cell replication: a revised model of human beta cell G1/S control. Diabetes. 2013;62:2460–2470. doi: 10.2337/db12-0778. [DOI] [PMC free article] [PubMed] [Google Scholar]
- Gasa R, Mrejen C, Leachman N. Proendocrine genes coordinate the pancreatic islet differentiation program in vitro. Proc Natl Acad Sci USA. 2004;101:13246–13250. doi: 10.1073/pnas.0405301101. [DOI] [PMC free article] [PubMed] [Google Scholar]
- German MS, Blanar MA, Nelson C, Moss LG, Rutter WJ. Two related helix-loop-helix proteins participate in separate cell-specific complexes that bind the insulin enhancer. Mol Endocrinol. 1991;5:292–299. doi: 10.1210/mend-5-2-292. [DOI] [PubMed] [Google Scholar]
- Gradwohl G, Dierich A, LeMeur M. neurogenin3 is required for the development of the four endocrine cell lineages of the pancreas. Proc Natl Acad Sci USA. 2000;97:1607–1611. doi: 10.1073/pnas.97.4.1607. [DOI] [PMC free article] [PubMed] [Google Scholar]
- Gu G, Dubauskaite J, Melton DA. Direct evidence for the pancreatic lineage: NGN3+ cells are islet progenitors and are distinct from duct progenitors. Development. 2002;129:2447–2467. doi: 10.1242/dev.129.10.2447. [DOI] [PubMed] [Google Scholar]
- Horton P, Park KJ, Obayashi T, Fujita N, Harada H, Adams-Collier CJ, Nakai K. WoLF PSORT: protein localization predictor. Nucleic Acids Res. 2007;35:W585–W587. doi: 10.1093/nar/gkm259. [DOI] [PMC free article] [PubMed] [Google Scholar]
- Jackson EL, Willis N, Mercer K, Bronson RT, Crowley D, Montoya R, Jacks T, Tuveson DA. Analysis of lung tumor initiation and progression using conditional expression of oncogenic K-ras. Genes Dev. 2001;15:3243–3248. doi: 10.1101/gad.943001. [DOI] [PMC free article] [PubMed] [Google Scholar]
- Johansson KA, Dursun U, Jordan N, Gu G, Beermann F, Gradwohl G, Grapin-Botton A. Temporal control of Neurogenin3 activity in pancreas progenitors reveals competence windows for the generation of different endocrine cell types. Dev Cell. 2007;12:457–465. doi: 10.1016/j.devcel.2007.02.010. [DOI] [PubMed] [Google Scholar]
- Johnson JD. The quest to make fully functional human pancreatic beta cells from embryonic stem cells: climbing a mountain in the clouds. Diabetologia. 2016;59:2047–2057. doi: 10.1007/s00125-016-4059-4. [DOI] [PubMed] [Google Scholar]
- Kieffer TJ. Closing in on mass production of mature human beta cells. Cell Stem Cell. 2016;18:699–702. doi: 10.1016/j.stem.2016.05.014. [DOI] [PubMed] [Google Scholar]
- Kim SY, Rane SG. The Cdk4-E2f1 pathway regulates early pancreas development by targeting Pdx1+ progenitors and Ngn3+ endocrine precursors. Development. 2011;138:1903–1912. doi: 10.1242/dev.061481. [DOI] [PMC free article] [PubMed] [Google Scholar]
- Kim YH, Larsen HL, Rué P, Lemaire LA, Ferrer J, Grapin-Botton A. Cell cycle-dependent differentiation dynamics balances growth and endocrine differentiation in the pancreas. PLoS Biol. 2015;13:e1002111. doi: 10.1371/journal.pbio.1002111. [DOI] [PMC free article] [PubMed] [Google Scholar]
- Krentz NAJ, Nian C, Lynn FC. TALEN/CRISPR-mediated eGFP knock-in add-on at the OCT4 locus does not impact differentiation of human embryonic stem cells towards endoderm. PLoS One. 2014;9:e114275. doi: 10.1371/journal.pone.0114275. [DOI] [PMC free article] [PubMed] [Google Scholar]
- Lange C, Calegari F. Cdks and cyclins link G1 length and differentiation of embryonic, neural and hematopoietic stem cells. Cell Cycle. 2010;9:1893–1900. doi: 10.4161/cc.9.10.11598. [DOI] [PubMed] [Google Scholar]
- Linding R, Jensen LJ, Ostheimer GJ, van Vugt MATM, Jørgensen C, Miron IM, Diella F, Colwill K, Taylor L, Elder K, et al. Systematic discovery of in vivo phosphorylation networks. Cell. 2007;129:1415–1426. doi: 10.1016/j.cell.2007.05.052. [DOI] [PMC free article] [PubMed] [Google Scholar]
- Lynn FC, Smith SB, Wilson ME, Yang KY, Nekrep N, German MS. Sox9 coordinates a transcriptional network in pancreatic progenitor cells. Proc Natl Acad Sci USA. 2007;104:10500–10505. doi: 10.1073/pnas.0704054104. [DOI] [PMC free article] [PubMed] [Google Scholar]
- Ma YC, Song MR, Park JP, Henry Ho HY, Hu L, Kurtev MV, Zieg J, Ma Q, Pfaff SL, Greenberg ME. Regulation of motor neuron specification by phosphorylation of neurogenin 2. Neuron. 2008;58:65–77. doi: 10.1016/j.neuron.2008.01.037. [DOI] [PMC free article] [PubMed] [Google Scholar]
- McGrath PS, Watson CL, Ingram C, Helmrath MA, Wells JM. The basic helix-loop-helix transcription factor NEUROG3 is required for development of the human endocrine pancreas. Diabetes. 2015;64:2497–2505. doi: 10.2337/db14-1412. [DOI] [PMC free article] [PubMed] [Google Scholar]
- McKnight KD, Wang P, Kim SK. Deconstructing pancreas development to reconstruct human islets from pluripotent stem cells. Cell Stem Cell. 2010;6:300–308. doi: 10.1016/j.stem.2010.03.003. [DOI] [PMC free article] [PubMed] [Google Scholar]
- Miyatsuka T, Li Z, German MS. Chronology of islet differentiation revealed by temporal cell labeling. Diabetes. 2009;58:1863–1868. doi: 10.2337/db09-0390. [DOI] [PMC free article] [PubMed] [Google Scholar]
- Miyatsuka T, Kosaka Y, Kim H, German MS. Neurogenin3 inhibits proliferation in endocrine progenitors by inducing Cdkn1a. Proc Natl Acad Sci USA. 2011;108:185–190. doi: 10.1073/pnas.1004842108. [DOI] [PMC free article] [PubMed] [Google Scholar]
- Nguyen L, Besson A, Heng JIT, Schuurmans C, Teboul L, Parras C, Philpott A, Roberts JM, Guillemot F. p27kip1 independently promotes neuronal differentiation and migration in the cerebral cortex. Genes Dev. 2006;20:1511–1524. doi: 10.1101/gad.377106. [DOI] [PMC free article] [PubMed] [Google Scholar]
- Pagliuca FW, Melton DA. How to make a functional β-cell. Development. 2013;140:2472–2483. doi: 10.1242/dev.093187. [DOI] [PMC free article] [PubMed] [Google Scholar]
- Petzold KM, Spagnoli FM. A system for ex vivo culturing of embryonic pancreas. J Vis Exp. 2012:e3979. doi: 10.3791/3979. [DOI] [PMC free article] [PubMed] [Google Scholar]
- Pruitt SC, Freeland A, Rusiniak ME, Kunnev D, Cady GK. Cdkn1b overexpression in adult mice alters the balance between genome and tissue ageing. Nat Commun. 2013;4:1–12. doi: 10.1038/ncomms3626. [DOI] [PMC free article] [PubMed] [Google Scholar]
- Ran FA, Hsu PD, Wright J, Agarwala V, Scott DA, Zhang F. Genome engineering using the CRISPR-Cas9 system. Nat Protoc. 2013;8:2281–2308. doi: 10.1038/nprot.2013.143. [DOI] [PMC free article] [PubMed] [Google Scholar]
- Rezania A, Bruin JE, Arora P, Rubin A, Batushansky I, Asadi A, O’Dwyer S, Quiskamp N, Mojibian M, Albrecht T, et al. Reversal of diabetes with insulin-producing cells derived in vitro from human pluripotent stem cells. Nat Biotechnol. 2014;32:1121–1133. doi: 10.1038/nbt.3033. [DOI] [PubMed] [Google Scholar]
- Roark R, Itzhaki L, Philpott A. Complex regulation controls Neurogenin3 proteolysis. Biol Open. 2012;1:1264–1272. doi: 10.1242/bio.20121750. [DOI] [PMC free article] [PubMed] [Google Scholar]
- Rostovskaya M, Bredenkamp N, Smith A. Towards consistent generation of pancreatic lineage progenitors from human pluripotent stem cells. Philos Trans R Soc Lond B Biol Sci. 2015;370:20140365. doi: 10.1098/rstb.2014.0365. [DOI] [PMC free article] [PubMed] [Google Scholar]
- Sakaue-Sawano A, Kurokawa H, Morimura T, Hanyu A, Hama H, Osawa H, Kashiwagi S, Fukami K, Miyata T, Miyoshi H, et al. Visualizing spatiotemporal dynamics of multicellular cell-cycle progression. Cell. 2008;132:487–498. doi: 10.1016/j.cell.2007.12.033. [DOI] [PubMed] [Google Scholar]
- Salic A, Mitchison TJ. A chemical method for fast and sensitive detection of DNA synthesis in vivo. Proc Natl Acad Sci USA. 2008;105:2415–2420. doi: 10.1073/pnas.0712168105. [DOI] [PMC free article] [PubMed] [Google Scholar]
- Salomoni P, Calegari F. Cell cycle control of mammalian neural stem cells: putting a speed limit on G1. Trends Cell Biol. 2010;20:233–243. doi: 10.1016/j.tcb.2010.01.006. [DOI] [PubMed] [Google Scholar]
- Schwitzgebel VM, Scheel DW, Conners JR, Kalamaras J, Lee JE, Anderson DJ, Sussel L, Johnson JD, German MS. Expression of neurogenin3 reveals an islet precursor population in the pancreas. Development. 2000;127:3533–3542. doi: 10.1242/dev.127.16.3533. [DOI] [PubMed] [Google Scholar]
- Scott MS, Boisvert FM, McDowall MD, Lamond AI, Barton GJ. Characterization and prediction of protein nucleolar localization sequences. Nucleic Acids Res. 2010;38:7388–7399. doi: 10.1093/nar/gkq653. [DOI] [PMC free article] [PubMed] [Google Scholar]
- Sela Y, Molotski N, Golan S, Itskovitz-Eldor J, Soen Y. Human embryonic stem cells exhibit increased propensity to differentiate during the G1 phase prior to phosphorylation of pRB. Stem Cells. 2012;30:1097–1108. doi: 10.1002/stem.1078. [DOI] [PubMed] [Google Scholar]
- Shapiro A, Lakey J, Ryan E. Islet transplantation in seven patients with type 1 diabetes mellitus using a glucocorticoid-free immunosuppressive regimen. N Eng J Med. 2000;343:230–238. doi: 10.1056/NEJM200007273430401. [DOI] [PubMed] [Google Scholar]
- Shimajiri Y, Kosaka Y, Scheel DW, Lynn FC, Kishimoto N, Wang J, Zhao S, German MS. A mouse model for monitoring islet cell genesis and developing therapies for diabetes. Dis Models Mech. 2011;4:268–276. doi: 10.1242/dmm.002998. [DOI] [PMC free article] [PubMed] [Google Scholar]
- Smith SB, Ee HC, Conners JR, German MS. Paired-homeodomain transcription factor PAX4 acts as a transcriptional repressor in early pancreatic development. Mol Cell Biol. 1999;19:8272–8280. doi: 10.1128/mcb.19.12.8272. [DOI] [PMC free article] [PubMed] [Google Scholar]
- Smith SB, Gasa R, Watada H, Wang J, Griffen SC, German MS. Neurogenin3 and hepatic nuclear factor 1 cooperate in activating pancreatic expression of Pax4. J Biol Chem. 2003;278:38254–38259. doi: 10.1074/jbc.M302229200. [DOI] [PubMed] [Google Scholar]
- Speckmann T, Sabatini PV, Nian C, Smith RG, Lynn FC. Npas4 transcription factor expression is regulated by calcium signaling pathways and prevents tacrolimus-induced cytotoxicity in pancreatic beta cells. J Biol Chem. 2016;291:2682–2695. doi: 10.1074/jbc.M115.704098. [DOI] [PMC free article] [PubMed] [Google Scholar]
- Stanger BZ, Tanaka AJ, Melton DA. Organ size is limited by the number of embryonic progenitor cells in the pancreas but not the liver. Nature. 2007;445:886–891. doi: 10.1038/nature05537. [DOI] [PubMed] [Google Scholar]
- Subach FV, Subach OM, Gundorov IS, Morozova KS, Piatkevich KD, Cuervo AM, Verkhusha VV. Monomeric fluorescent timers that change color from blue to red report on cellular trafficking. Nat Chem Biol. 2009;5:118–126. doi: 10.1038/nchembio.138. [DOI] [PMC free article] [PubMed] [Google Scholar]
- Takahashi T, Nowakowski R. The cell cycle of the pseudostratified ventricular epithelium of the embryonic murine cerebral wall. J Neurosci. 1995;15:6046–6057. doi: 10.1523/JNEUROSCI.15-09-06046.1995. [DOI] [PMC free article] [PubMed] [Google Scholar]
- Takahashi T, Nowakowski RS, Caviness VS. Cell cycle parameters and patterns of nuclear movement in the neocortical proliferative zone of the fetal mouse. J Neurosci. 1993;13:820–833. doi: 10.1523/JNEUROSCI.13-02-00820.1993. [DOI] [PMC free article] [PubMed] [Google Scholar]
- Van Hoof D, Passier R, Ward-Van Oostwaard D, Pinkse MWH, Heck AJR, Mummery CL, Krijgsveld J. A quest for human and mouse embryonic stem cell-specific proteins. Mol Cell Proteomics. 2006;5:1261–1273. doi: 10.1074/mcp.M500405-MCP200. [DOI] [PubMed] [Google Scholar]
- Van Hoof D, D’Amour KA, German MS. Derivation of insulin-producing cells from human embryonic stem cells. Stem Cell Res. 2009;3:73–87. doi: 10.1016/j.scr.2009.08.003. [DOI] [PubMed] [Google Scholar]
- Van Hoof D, Mendelsohn AD, Seerke R, Desai TA, German MS. Differentiation of human embryonic stem cells into pancreatic endoderm in patterned size-controlled clusters. Stem Cell Res. 2011;6:276–285. doi: 10.1016/j.scr.2011.02.004. [DOI] [PubMed] [Google Scholar]
- Vernon AE, Devine C, Philpott A. A single cdk inhibitor, p27Xic1, functions beyond cell cycle regulation to promote muscle differentiation in Xenopus. Development. 2003;130:71–83. doi: 10.1242/dev.00180. [DOI] [PubMed] [Google Scholar]
- Villasenor A, Chong DC, Cleaver O. Biphasic Ngn3 expression in the developing pancreas. Dev Dyn. 2008;237:3270–3279. doi: 10.1002/dvdy.21740. [DOI] [PMC free article] [PubMed] [Google Scholar]
- Vosper JMD, Fiore-Heriche CS, Horan I, Wilson K, Wise H, Philpott A. Regulation of neurogenin stability by ubiquitin-mediated proteolysis. Biochem J. 2007;407:277–284. doi: 10.1042/BJ20070064. [DOI] [PMC free article] [PubMed] [Google Scholar]
- Vosper JMD, McDowell GS, Hindley CJ, Fiore-Heriche CS, Kucerova R, Horan I, Philpott A. Ubiquitylation on canonical and non-canonical sites targets the transcription factor neurogenin for ubiquitin-mediated proteolysis. J Biol Chem. 2009;284:15458–15468. doi: 10.1074/jbc.M809366200. [DOI] [PMC free article] [PubMed] [Google Scholar]
- Wang J, Cortina G, Wu SV, Tran R, Cho JH, Tsai MJ, Bailey TJ, Jamrich M, Ament ME, Treem WR, et al. Mutant neurogenin-3 in congenital malabsorptive diarrhea. N Eng J Med. 2006;355:270–280. doi: 10.1056/NEJMoa054288. [DOI] [PubMed] [Google Scholar]
- Wang S, Jensen JN, Seymour PA, Hsu W, Dor Y, Sander M, Magnuson MA, Serup P, Gu G. Sustained Neurog3 expression in hormone-expressing islet cells is required for endocrine maturation and function. Proc Natl Acad Sci USA. 2009;106:9715–9720. doi: 10.1073/pnas.0904247106. [DOI] [PMC free article] [PubMed] [Google Scholar]
- Wang S, Yan J, Anderson DA, Xu Y, Kanal MC, Cao Z, Wright CVE, Gu G. Neurog3 gene dosage regulates allocation of endocrine and exocrine cell fates in the developing mouse pancreas. Dev Biol. 2010;339:26–37. doi: 10.1016/j.ydbio.2009.12.009. [DOI] [PMC free article] [PubMed] [Google Scholar]
- Wennerberg K, Rossman KL, Der CJ. The Ras superfamily at a glance. J Cell Sci. 2005;118:843–846. doi: 10.1242/jcs.01660. [DOI] [PubMed] [Google Scholar]
- Xu EE, Krentz NAJ, Tan S, Chow SZ, Tang M, Nian C, Lynn FC. SOX4 cooperates with neurogenin 3 to regulate endocrine pancreas formation in mouse models. Diabetologia. 2015;58:1013–1023. doi: 10.1007/s00125-015-3507-x. [DOI] [PubMed] [Google Scholar]
- Xue Y, Zhou F, Fu C, Xu Y, Yao X. SUMOsp: a web server for sumoylation site prediction. Nucleic Acids Res. 2006;34:W254–W257. doi: 10.1093/nar/gkl207. [DOI] [PMC free article] [PubMed] [Google Scholar]
- Zhou Q, Law AC, Rajagopal J, Anderson WJ, Gray PA, Melton DA. A multipotent progenitor domain guides pancreatic organogen-esis. Dev Cell. 2007;13:103–114. doi: 10.1016/j.devcel.2007.06.001. [DOI] [PubMed] [Google Scholar]
Associated Data
This section collects any data citations, data availability statements, or supplementary materials included in this article.