Abstract
Cardiovascular diseases (CVDs) cause more than 17 × 106 deaths worldwide on a yearly basis. Early diagnosis of CVDs is therefore of great need. The C-reactive protein (CRP) is an important biomarker for analyzing the risks of CVDs. In this work, CRP-specific aptamers with high sensitivity and specificity and field-effect-transistor (FET) devices were used to recognize and detect CRP by using an integrated microfluidic system automatically while consuming less volumes of reagents and samples (about 5 μm). In order to package the FET device into the microfluidic chip, a new method to prevent liquid leakage was proposed. Sensitive detection of CRP has been demonstrated on the developed microfluidic system. It is the first time that aptamer-FET assays could be realized on an integrated microfluidic system. Experimental results showed that the aptamer-FET assay was capable of detecting CRP with concentrations ranging from 0.625 mg/l to 10.000 mg/l, which may be promising for early diagnosis of CVDs.
Nomenclature
- AHA
American Heart Association
- Cd
dielectric capacitance
- CNC
computer-numerical-control
- CRP
C-reactive protein
- Cs
solution capacitance
- CVD
cardiovascular diseases
- D
drain of FET devices
- DNA
deoxyribonucleic acid
- EDTA
ethylenediaminetetraacetic acid
- ELISA
enzyme-linked immunosorbent assay
- EMV
electromagnetic valves
- FET
field-effect-transistor
- G
gate of FET devices
- HEMT
high-electron-mobility-transistor
- LOD
limit of detection
- PBS
phosphate-buffered saline
- PCB
printed circuit board
- PDMS
polydimethylsiloxane
- PMMA
polymethylmethacrylate
- RNA
ribonucleic acid
- S
source of FET devices
- SELEX
systematic evolution of ligands and exponential enrichment
- TE buffer
tris-EDTA buffer
- Vd
potential drop across dielectric
- Vg
gate voltage
- Vs
potential drop across solution
- ssDNA
single-strand DNA
- w
angular frequency
I. INTRODUCTION
Cardiovascular diseases (CVDs) are the cause of over 17 × 106 deaths worldwide every year. The C-reactive protein (CRP) is an important biomarker for the risk assessment of CVDs.1 It has also been clinically confirmed that low CRP concentrations under 10.00 mg/l in serum can be used to evaluate the risk of CVDs.2,3 The American Heart Association (AHA) and the Center for Disease Control and Prevention define the risks for CVDs as follows. The concentration of CRP below 1.00 mg/l (9.00 nM) could be classified as low risk and the concentration from 1.00 to 3.00 mg/l (9.00 nM to 27.00 nM) is regarded as moderate risk while the concentrations from 3.00 to 10.00 mg/l (27.00 nM to 90.00 nM) are recognized as high risk.2 A device which could measure the CRP concentration accurately covering a dynamic range from 1.00 to 10.00 mg/l is therefore of great need to assess the risk of CVDs.
Several techniques have been demonstrated for detection of CRP in the literature. For instance, conventional nephelometry (e.g., Immage®800, Beckman Coulter, USA) could detect CRP concentrations ranging from 3.00 to 5.00 mg/l,4 which may not be suitable for risk assessment of CVDs.2,5 Alternatively, enzyme-linked immunosorbent assay (ELISA) with a limit of detection (LOD) as low as 1.00 mg/l was reported.6 Similarly, laser nephelometry which can measure CRP with high sensitivity in 25 min with a LOD as low as 0.04 mg/l by using antibodies to bind CRP was also reported. However, the antibody is sensitive to temperature and humidity, which requires extreme caution for storage and transpiration. Furthermore, the production of antibodies requires animals and therefore may suffer from batch-to-batch variations. More importantly, they could be relatively costly and unstable. Furthermore, magnetic beads and silica particles were also used to increase the LOD of CRP measurements to 0.12 mg/l by using similar immunoassays.7 However, this method may not be able to cover the CRP concentration ranging from the moderate risk to the high risk. Besides, the CRP had to be labeled on the silica particles, which may be relatively tedious.7
Aptamers, which could be screened by using an in vitro selection technique called systematic evolution of ligands by exponential enrichment (SELEX), have attracted considerable interests to replace the conventional antibodies. It has been reported that the SELEX process allows screening of more than 1015 individual nucleic acid molecules simultaneously for different functionalities.8,9 Briefly, aptamer is a short single-stranded deoxyribonucleic acid (ssDNA) or ribonucleic acid (RNA) which can be used to recognize a wide range of target molecules such as peptides, proteins, or even cells with high specificity and sensitivity.10 The specificity and sensitivity of measurements could be significantly improved accordingly because of the specific three-dimensional structure of the screened aptamers.11,12 Unlike antibodies, in vitro screened aptamers can be reproducibly synthesized in a short period of time and can be easily modified by existing chemical methods to improve their affinity and stability over a wide range of chemicals with low cost.11,12 These characteristics make aptamers a useful tool in diagnostic and therapeutic applications,13 especially acting as “artificial antibodies” to replace existing immunoassays.
A CRP-specific aptamer was successfully screened by using an integrated microfluidic system in our previous work.14 Especially, the dissociation constant of the CRP-specific aptamer was measured to be 3.51 nM, which is superior to the affinity of the anti-CRP antibody (about 10−8 M). The LOD of the CRP using this aptamer was experimentally found to be 12.50 μg/l, which is suitable for assessment of CVDs. The linear range (R2 = 0.9694) was further identified in concentrations ranging from 12.50 μg/l to 10.00 mg/l.14 Due to its high affinity and high specificity towards CRP, the CRP-specific aptamer could be successfully used as a CRP detection tool with chemiluminescence signals within 30 min.15 However, this method required expensive and bulky fluorescence detection modules.
Recently, field-effect-transistor (FET) sensors have been extensively used for bio-sensing due to the fact that these sensors could be extremely sensitive and compact in size.16,17 They could be also highly specific if proper surface modification was made on the sensing gate area of the FET devices.18 Amongst the FET sensors, AlGaN/GaN high-electron-mobility-transistor (HEMT)-based FET sensors have been widely used for gas, chemical, and biological applications19–24 as they could form a high-electron, sheet-carrier-concentration channel induced by piezoelectric polarization of the strained AlGaN layer. In brief, the HEMT is a heterostructure FET which is made of two or more than two kinds of different semiconducting materials which are in contact with each other.19,21 Due to the difference between their relative alignment and band gaps, band discontinuities occur at the interface between the two semiconducting materials. The HEMT-based FET sensors with high sensitivity have been demonstrated to detect biomolecules such as glucose, specific antigen, and single-strand DNA or RNA.21 AlGaN/GaN HEMT-based FET sensors have many advantages such as high sensitivity, label-free, compact in size, low cost, and real-time detection. In this work, the AlGaN/GaN HEMT-based FET sensors were used for detection of CRP to reduce the size of the sensing system.
Another issue for CRP detection is the automation of the CRP sensing process since it involved several tedious steps. In this work, an integrated microfluidic system equipped with micropumps, microvalves, and micromixers was developed to automate the entire CRP sensing process while integrated with the AlGaN/GaN HEMT-based FET devices by using CRP-specific aptamers. It could therefore automate the CRP detection process and can reduce the need for well-trained personnel and avoid human error and contamination. It is the first time that automatic CRP detection was performed by using aptamer-FET assays. This study further presents a dual-aptamer assay for the detection of CRP by using an AlGaN/GaN HEMT-based FET sensor on an integrated microfluidic system. This is also the first time that two aptamers, which are specific to CRP, have been used to perform a sandwich-like assay. The first aptamer (1st aptamer) was first immobilized on the gate metal of FET devices which could bind to the target CRP in serum. The second aptamer (2nd aptamer) could then bind to the target CRP such that the CRP concentration could be detected by measuring electrical signals on FET. It is worth noting that the detection time for FET sensing was just 50 μs which is much faster than the 5.5 min required in the previous study.25 Furthermore, the microfluidic chip composed of a pneumatically driven normally open micromixer, normally closed microvalves, and micropumps, could automate the aptamer-FET assay such that the entire diagnostic process could be performed. Experimental results revealed that the CRP-specific aptamer could be specifically bound to target CRP. Furthermore, the microfluidic chip integrated with the FET device can be re-used if the bound CRP was eluted by using a specific elution buffer. Several advantages such as rapid diagnosis, specific CRP detection, and reasonable dynamic range demonstrated that the developed system may be promising to assess the risks of CVDs.
II. MATERIALS AND METHODS
A. Design of the integrated microfluidic chip
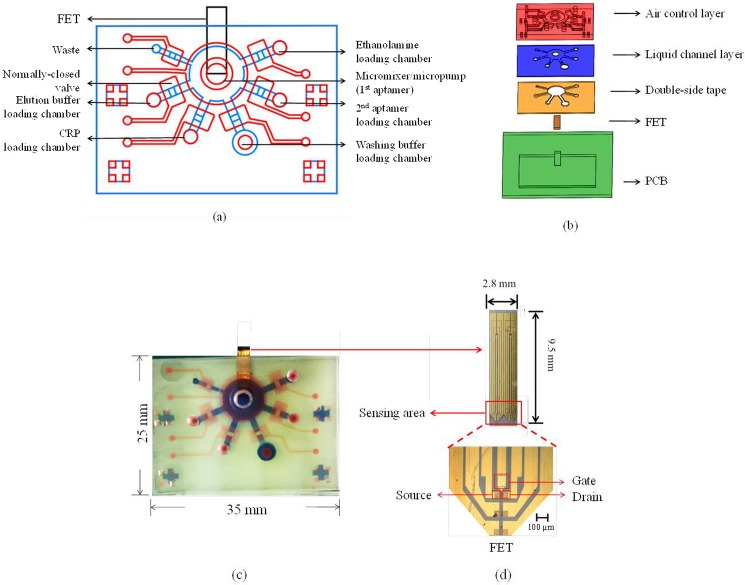
The integrated microfluidic chip was composed of two major parts, including a FET sensor and a microfluidic chip. The microfluidic chip was fabricated by using polydimethylsiloxane (PDMS) (Sil-More Industrial Ltd., USA; Sylgard 184A and Sylgrad 184B) because of its advantages including chemically inert nature, optical transparency, easy fabrication, and biocompatibility. Figure 1(a) illustrates a schematic diagram of the FET-based microfluidic chip which was composed of a micromixer/micropump, six loading chambers, and six normally closed microvalves in order to automate the entire detection process for aptamer-FET assays. These six loading chambers included a sample loading chamber, an aptamer loading chamber, an ethanolamine loading chamber, an elution buffer loading chamber, a washing buffer loading chamber, and a waste chamber. The micromixer/micropump24 was located at the center of the microfluidic chip, which was used to transport reagents and samples for mixing the CRP sample with the CRP-specific aptamers such that the entire detection process could be automated. Detailed information about the pneumatically driven micromixer/micropump could be found in our previous work.24
FIG. 1.
The design of the FET-based microfluidic chip. (a) Schematic diagram of the microfluidic chip. It consisted of six open chambers, six normally closed microvalves, and a micromixer/micropump. (b) Exploded view of the microfluidic chip, which was composed of five layers, including an air control layer (thick PDMS layer), a liquid channel layer (thin PDMS layer), a double-side tape, a FET device, and a PCB layer. The double-side tape was used for bonding PDMS layers and the PCB layer. (c) A photograph of the FET-based microfluidic chip. The dimensions of the chip were measured to be 25.0 mm × 35.0 mm × 4.9 mm. The red color indicates the air control layer and the blue color indicates the liquid channel layer. (d) The top-view and a photograph of the FET and the sensing region.
Figure 1(b) shows an exploded view of the microfluidic chip, which was composed of five layers, including an air control layer (thick PDMS layer), a liquid channel layer (thin PDMS layer), a double-side tape, a FET device, and a printed circuit board (PCB) layer. Note that the double-side tape (ARcare MH-90106, PRISMA, Taipei, Taiwan) was used to bind the PDMS layers and the PCB layer. The PCB layer was used to package the FET device with PDMS and bonded with the microfluidic chip by using the double-side tape. With this approach, the FET device could be integrated with the microfluidic chip such that the electric signal could be measured to detect the CRP concentrations.
Figure 1(c) shows a photograph of the integrated FET-based microfluidic chip. The FET sensor was placed in the PCB layer such that electric signals (total charges) from the FET could be probed. The dimensions of the microfluidic chip were measured to be 25.0 mm (width) and 35.0 mm (length) while the depth of the chip was 4.9 mm. Note that the red color indicated the air control layer and the liquid channel layer was displayed in blue.
The FET device composed of three terminals including gate (G), source (S), and drain (D), respectively, is shown in Fig. 1(d). The AlGaN and GaN thin films were grown on a sapphire substrate by molecular beam epitaxy (MBE).20,21 The AlGaN/GaN HEMT structure consists of a 3 μm-thick undoped GaN buffer layer, a 150 Å-thick undoped Al0.25Ga0.75N layer, and a 10 Å-thick GaN cap layer. The active channel and the device isolation were realized by inductively coupled plasma (ICP) etching with Cl2/BCl3 gases (35 sccm/35 sccm) under an ICP power of 300 W and a radio-frequency (RF) bias of 120 W at 2 MHz. Ohmic contacts were fabricated by deposition of Ti/Al/Ni/Au (200 Å/400 Å/800 Å/1000 Å) using an electron beam evaporator, followed by rapid thermal annealing at 850 °C for 45 s in nitrogen (N2) ambient. The ohmic contacts (60 × 60 μm2) were separated by a gap of 30 μm and the width of the channel was 50 μm. Ti/Au (200 Å/1200 Å) was further deposited for metal interconnects and the gate electrode. The gate electrode was separated from the channel of the transistor and passivated with photoresist with an open area of 120 μm × 100 μm, which was immobilized with the 1st aptamer via the thiol group on the 3′ end. The gap between the open area on the gate electrode and the channel of the transistor was 65 μm. When CRP was bound onto the CRP-specific aptamers, the drain current change of the FET device could be measured by using a semiconductor analyzer (B1500A/B1530 Semiconductor Device Analyzer, Agilent, USA).
B. Packaging of the chip
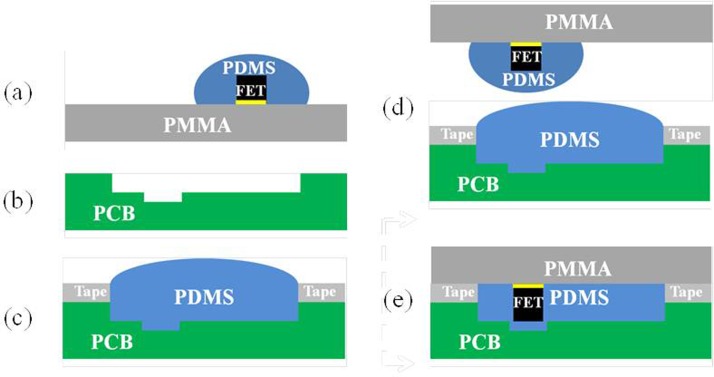
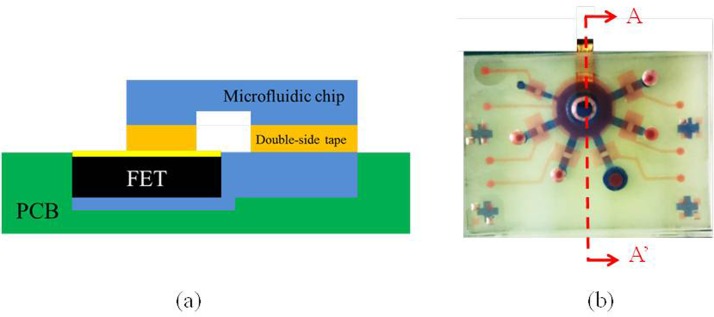
In this study, a new packaging method was developed to assemble the FET devices, the PCB layer, and the PDMS layers since they cannot be bound together by conventional oxygen plasma treatment. The detailed packaging procedure is shown in Fig. 2. Briefly, the FET device was first covered by PDMS and placed upside down on the surface of a polymethylmethacrylate (PMMA) plate. The PCB layer was then carved using a computer-numerical-control (CNC) machining process to form a cavity such that the FET device could be placed inside. A tape was then placed on the PCB layer and the cavity of the PCB board was filled with PDMS. The PMMA plate with the FET devices was then aligned with the cavity of the PCB layer, which was placed on top of it later. After baking the PDMS for 1 h, the tape and the PMMA plate were removed and a flat surface of PDMS was formed which was ready to be bonded with other PDMS layers to assemble the integrated microfluidic chip. Figure 3 shows the cross-sectional view (A-A′) of the microfluidic chip with the FET device. The liquid channel was covered by the air control layer. The FET device was packaged inside the PCB board and there was no leakage observed when the liquid was transported in the liquid channel.
FIG. 2.
A new packaging method for bonding the PDMS-based microfluidic chip and FET devices. (a) The FET covered by PDMS was placed on the surface of a PMMA plate. (b) PCB was carved for mounting the FET. (c) The tape was pasted on top of the PCB and the cavity of the PCB was filled with PDMS. (d) The PMMA with FET was aligned in the cavity of PCB. (e) The whole chip was baked for 1 h.
FIG. 3.
(a) A cross-sectional view (A-A′) of the microfluidic chip integrated with a FET device. (b) A top view of the FET-based microfluidic chip.
C. Experimental process
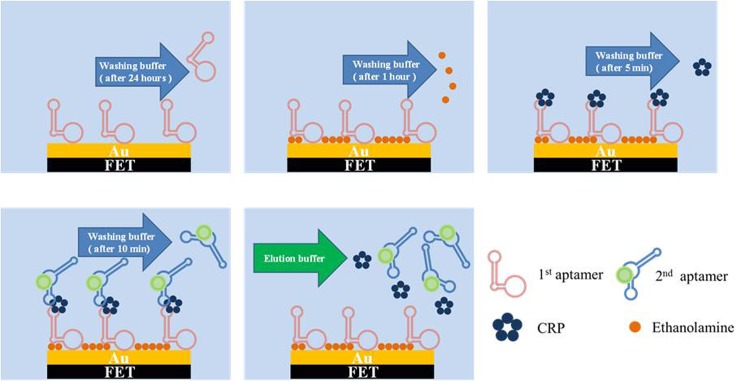
Figure 4 shows the on-chip experimental process for the dual-aptamer sandwich assay. First, clinical samples (serum) or purified CRP samples were loaded in the CRP loading chamber. Then, the 1st aptamer was loaded into the micromixer/micropump. Afterwards, ethanolamine, 5 μl of 5 μM 2nd aptamer, washing buffer, and elution buffer (Gentle Ag/Ab Elution Buffer, ThermoFisher, Taiwan, 15 μl) were loaded into the corresponding chambers [Fig. 4(a)]. Briefly, the 1st aptamer was immobilized on the gate area of the FET device by employing the micropump and the microvalves. In the meantime, the normally closed microvalves were closed and the micropump above the FET was activated in order to gently mix the 1st aptamer for 20 h such that aptamer immobilization could be completed. Next, the washing buffer was transported to the FET gate area to wash out the excessive 1st aptamer. Afterwards, ethanolamine was transported to FET for blocking the region without aptamer immobilization. After 1 h, the washing buffer was transported into the FET region to wash out the excessive ethanolamine. Note that the aptamer immobilization process and the blocking process could be performed before the CRP detection. Then the serum sample (or CRP sample) was transported to the FET region. The normally closed microvalves were closed to enclose the CRP sample and then the micro-mixer was activated such that gentle mixing of the serum sample (or CRP sample) and the 1st aptamer could be performed in order to increase the binding efficiency. Later, the unbound materials were removed by a washing buffer. After that, the 2nd aptamer was transported into the FET region and the micro-mixer was activated again to achieve gentle mixing of the 2nd aptamer and CRP for 10 min. Then, the washing buffer was transported to the FET region to wash out the excessive 2nd aptamer. Finally, the drain current signal of the FET device was then measured. All the above-mentioned processes were controlled by a home-made flow control system equipped with electromagnetic valves (EMVs, S070M-5BG-32, SMC Inc., Japan). Note that another assay, called the one-aptamer-only assay, which only detected the signal after binding with CRP samples without adding the 2nd aptamer, was also explored for comparison.
FIG. 4.
Experimental procedure for aptamer immobilization, ethanolamine blocking, and CRP detection. Note that the microfluidic chip could be re-used by using elution buffer. (a) 1st aptamer immobilization on the gate area of FET and removal of unbound 1st aptamer prior to detection; (b) blocking FET by ethanolamine and removal of unbound ethanolamine for 1 h; (c) CRP sample addition and removal of unbound CRP for 5 min; (d) 2nd aptamer addition and removal of unbound 2nd aptamer for 10 min; (e) elution buffer addition for CRP and removal of 2nd aptamer for the next test.
D. Experiment setup
The detection of CRP concentrations was automatically performed by the integrated FET-based microfluidic system. Briefly, a home-made flow control system equipped with a compressor (TC-10, Sun Mines Electrics Co., Ltd., Taiwan), a vacuum pump (DC-16 V, UNi-CROWN CO., LTD., Taiwan), and two pressure regulators (NR100–01, CHELIC CORP., LTD., Taiwan for the compressor and IRV10, SMC Inc., Japan for the vacuum pump) were used to provide the positive and negative gauge pressures to the micro-mixer/micropump and microvalves. After completing the entire experimental steps, the CRP concentration was measured by the FET device connected with a semiconductor analyzer (B1500A/B1530 Semiconductor Device Analyzer, Agilent, USA). Note that the drain-source voltage (Vds) was biased at 2 V and the drain current was measured before and after a pulsed gate voltage (Vg) of 0.5 V applied with the duration of 50 μs. The current change before and after the gate voltage applied was then integrated with time and shown as the total charges, which can effectively eliminate random noise in current, thus providing steady signals. The total charge versus different CRP concentrations was then established.
E. Preparation of the CRP-specific aptamers
In this work, two CRP-specific aptamers screened by using on-chip SELEX procedure were synthesized (Sigma-Aldrich Co., Singapore) and used for the CRP measurements.14 The sequence of the 1st aptamers is 5′GGCAGGAAGACAAACACGATGGGGGGGTATGATTTGATGTGGTTGTTGCATGATCGTGGTCTGTGGTGCTGT-3′. This aptamer was 72 base-pairs in length and the 5′ end was modified with thiol such that it could be immobilized on the gold gate of the FET devices. The sequence of the 2nd aptamer is 5′GGCAGGAAGACAAACACACAAGCGGGTGGGTGTGTACTATTGCAGTATCTATTCTGTGGTCTGTGGTGCTGT-3′. The stock concentration of the aptamer solution was 100 μM dissolved in tris-ethylenediaminetetraacetic acid (EDTA) buffer (TE buffer) [10 mM Tris-Cl, pH = 7.5, 1 mM ethylenediaminetetraacetic acid (EDTA)] prior to use.
F. Preparation of CRP samples and reagents
Human CRP with a molecular weight of 144 kDa was extracted from human plasma (ProSpec-Tany TechnoGene Enterprise, Germany). The stock concentration of the CRP solution was 30 mg/l in buffer (20 mM Tris buffer (pH = 8.0) containing 280 mM NaCl, 0.09% NaN3, and 5 mM CaCl2). The CRP stock solution was then serially diluted from 30 mg/l to 0.625 mg/l with 0.1× phosphate-buffered saline (PBS) buffer and used as CRP samples in this study.
III. RESULTS AND DISCUSSION
A. Optimization of aptamer immobilization time
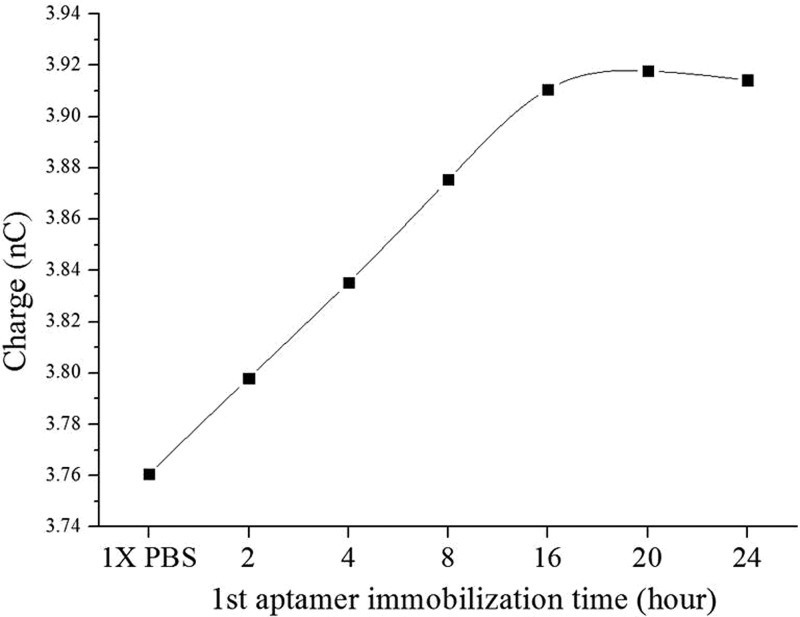
Immobilization time of the CRP-specific aptamer was first optimized by measuring the electric signals (total charges) of the FET sensors tested at different durations of time. Note that the CRP-specific aptamer was modified with thiol groups at the 5′ end such that it could be bound with the gold surface of the gate to form a thiol-gold interaction. 5 μl of 5 μM aptamer was immobilized onto the gold surface of the FET gate and the electric signals (total charges) were measured after aptamer immobilization for 2 h, 4 h, 8 h, 12 h, 16 h, 20 h, and 24 h, respectively. The results are shown in Fig. 5. Note that three repeated experiments were performed. The total charges after the aptamer immobilization were experimentally found to increase from 3.76 nC to 3.92 nC. Besides, the electric signal started from 3.76 nC initially and increased almost linearly to 3.91 nC at 16 h. Furthermore, the total charges saturated at a value of 3.92 nC at 20 h, as there was only a slight difference when measured at 24 h. We thereby chose 20 h as the optimal immobilization time for the aptamer immobilized on the gate of the FET.
FIG. 5.
Optimization of 1st aptamer immobilization for different periods of time (2, 4, 8, 12, 16, 20, and 24 h, respectively). Note that three repeated experiments were performed (N = 3). The variations were within 10%.
B. Electrical response of the dual-aptamer sandwich assay
1. Electrical measurement and sensor response of each step
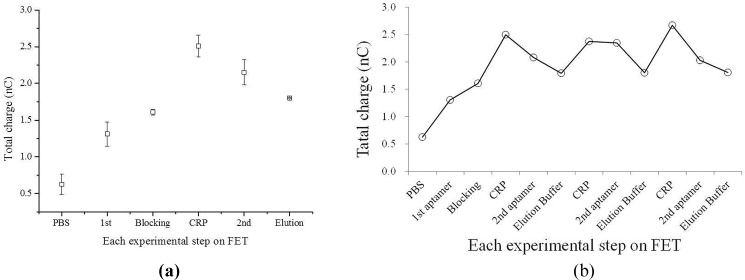
Figure 6(a) shows the total charges of each step in the entire diagnostic process, including 1st aptamer immobilization, ethanolamine blocking, CRP addition, and 2nd aptamer incubation. The total charge was found to increase when the reagents or the CRP sample were added into the microfluidic system in each step. It is worth noting that the total charge started from 5.0 nC and increased when the CRP sample was added, indicating that the FET device could detect CRP. Furthermore, the charge increased from 6.0 nC to 7.0 nC for CRP with a concentration of 10 mg/l. Furthermore, the total charge decreased when the 2nd aptamer was bound with CRP. Note that after the elution process (15 μl for 10 min), the signal returned to its initial state and could be re-used for the next measurement.
FIG. 6.
The electrical signals of the dual-aptamer sandwich assay; (a) the electrical signals (accumulated total charges) for each step of the dual-aptamer sandwich assay, indicating that the dual-aptamer assay could detect CRP by using the FET-based microfluidic system (n = 3). (b) The total charges for repeated three detection and elution processes. It showed that the total charge could be back to 1.8 nC after elution, indicating that the FET device could be reusable. Note that three repeated experiments were performed (N = 3).
The mechanism and the principle of our FET sensors are explained as follows. The operation of this FET sensor can be regarded as an electric-double-layer (EDL) FET. When Vg is applied on the separated gate electrode, the potential drops across the solution and the dielectric on the FET drops, as shown in Eq. (1). In the previous work,26 it was reported that in the EDL gated FET structure, when the gate electrode to channel gap was smaller, there was an effective potential gradient across the solution compared to the large gap.26 The charge distribution at the gate electrode-solution interface and the solution-dielectric interface could constitute the solution capacitance Cs. The solution and the dielectric are both regarded as part of the capacitor above the channel of the FET. Therefore, the overall capacitance is serially composed of the capacitance contributed by the solution and by the dielectric. The voltage drop in the dielectric will be large if the solution capacitance is large, as shown in Eq. (2), leading to higher drain current change at a fixed Vg change (from 0 V to 0.5 V). The voltage drop across the solution is also dependent on solution capacitance, which varies with the immobilization of aptamer, surface blocking or CRP binding. From the results, we can explain that the 1st aptamer and CRP increased the solution capacitance, while the second aptamer caused it to decrease. The uniqueness of our FET design is that it can effectively detect proteins in a physiological environment, where the ion concentration is very high (>150 mM), leading to an extremely short Debye length (<0.7 nm).27 For conventional FET-based biosensors, it is very difficult to detect proteins under such a physiological environment.28,29 We attribute the superior sensitivity of our sensors in high-ionic-strength solution to the strong electric filed across the solution (E ∼ 0.5 V/65 μm), which results in potential distribution extending more than the Debye length.26 Because the detection of our FET sensors does not rely on the net charge of the target protein, un-charged proteins can also be detected with our design owing to the change of the capacitance caused by the protein binding. The equations for describing the voltages on FET could be described as follows:
| (1) |
| (2) |
where Vg, Vs, and Vd are the gate voltage, potential drop across solution, and transistor dielectric, respectively, while Cd, Cs, and ω are the dielectric capacitance, solution capacitance, and angular frequency, respectively. The FET sensor could be re-used if the elution process was performed properly.
Figure 6(b) presents the total charge signals for three detection and elution processes of the dual-aptamer assays, showing that the total charge could go back to 1.8 nC after elution since the elution buffer was added to detach the bonded CRP such that it may be re-used afterwards. After washing by the elution buffer, 5 μl of 10 mg/l CRP was added and 5 μl of 1 mg/l 2nd aptamer was added to detect the electrical signal again. Finally, this step was repeated twice to demonstrate that the integrated FET microfluidic system could be re-usable. As shown in Fig. 6(b), the total charge in each elution step was about 1.8 nC. It indicates that the CRP and 2nd aptamer could be removed every time when elution buffer was used.
As shown in the previous work,26 the aptamer-FET-based CRP sensor can achieve an LOD up to 0.34 mg/l. The sensor showed very high sensitivity in the low concentration range (<1 mg/l). In the present work, the CRP concentration tested using the aptamer-FET-based sensor is mostly in a relatively higher concentration range (0.625–10 mg/l) because it is the clinically relevant dynamic range established for CVD (cardiovascular disease) risk assessment. The present work aims to develop a rapid diagnostic tool to test clinical biomarkers by using integrated microfluidic platforms to automate the entire process.
2. Electrical measurement of different CRP concentrations
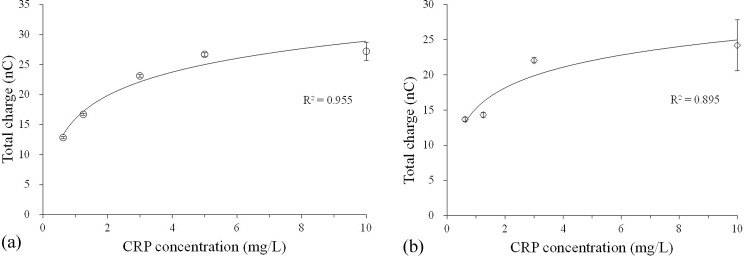
In this work, two aptamer-FET assays, including a one-aptamer-only assay and a dual-aptamer sandwich assay, were tested. Figure 7(a) shows the total charges of the one-aptamer-only assay, which only detected the signal after binding with CRP samples without adding the 2nd aptamer. The total charges were found to increase with the concentration of CRP (from 0.625 mg/l to 10.000 mg/l), which is the detection region covering low to high risks for CVD. It means that the sensitivity of FET was suitable for CRP detection. The detection region is better than the one from the nephelometry method (with detection regions ranging from 3 to 5 mg/l) currently applied in hospitals and clinical laboratories4 or the ELISA method which has a LOD of 1.0 mg/l.6
FIG. 7.
The electrical signals of the one-aptamer-only assay and the dual-aptamer sandwich assay; (a) the electrical signals (total charges) of the one-aptamer-only assay detected by the FET for different CRP concentrations ranging from 0.625 to 10.000 mg/l. The total charges increased with CRP concentrations (N = 3). (b) The total charges of the dual-aptamer sandwich assay measured by the FET for different CRP concentrations ranging from 0.625 to 10.000 mg/l. The total charges also increased with CRP concentrations (N = 3). However, they were less than the one from the one-aptamer-only assay at the same concentration of CRP.
Figure 7(b) shows the total charge of the dual-aptamer sandwich assay, which detects the signals after the binding of the 2nd aptamer. As mentioned previously, the total charge decreased when the 2nd aptamer was added. It is worth noting that a CRP concentration of 10.0 mg/l produced a signal of 27.21 nC in the one-aptamer-only assay. However, when the dual-aptamer sandwich assay was performed, it was lowered to 24.19 nC. Nevertheless, the total charges increased when the concentration of CRP was increased. It is then concluded that this FET-based microfluidic system could detect the CRP concentration by these two assays (including the one-aptamer-only assay and the dual-aptamer sandwich assay).
IV. CONCLUSIONS
In this work, we have demonstrated a one-aptamer-only assay and a dual-aptamer sandwich assay to detect CRP in an integrated microfluidic system while incorporated with FET sensors. It was capable of performing CRP detection in an automated fashion while consuming fewer volumes of reagents (5 μl for each reagent) and samples (5 μl). A new method for packaging the FET device on PDMS-based microfluidic chips, which can prevent liquid leakage, was proposed. Optimization results revealed that excellent aptamer coverage could be obtained by immobilizing the 1st aptamer for 20 h. Both one-aptamer-only and sandwich assays could be used for CRP detection by using the FET device. The developed integrated microfluidic device could automate the entire process to achieve sensitive and specific CRP detection, which is promising for the assessment of CVD risk.
ACKNOWLEDGMENTS
The authors would like to thank financial supports from the Ministry of Science and Technology, Taiwan (MOST 105-2119-M-007-009, MOST 105-2221-E-007-007, and MOST 104-2221-E-007-141). Partial financial support from the “Towards a World-Class University” Project (104N2751E1) is also greatly appreciated.
Note: The preliminary results of the current paper have been presented at the 11th Annual IEEE International Conference on Nano/Micro Engineered and Molecular Systems (IEEE NEMS 2016), Sendai, Japan, April 17–20, 2016.
References
- 1. Hu J., Cui X., Gong Y., Xu X., Gao B., Wen T., Lu T. J., and Xu F., Biotechnol. Adv. 34, 305 (2016). 10.1016/j.biotechadv.2016.02.008 [DOI] [PubMed] [Google Scholar]
- 2. Pepys M. B. and Hirschfield G. M., J. Clin. Invest. 111, 1805 (2003). 10.1172/JCI200318921 [DOI] [PMC free article] [PubMed] [Google Scholar]
- 3. Volanakis J. E., Mol. Immunol. 38, 189 (2001). 10.1016/S0161-5890(01)00042-6 [DOI] [PubMed] [Google Scholar]
- 4. Roberts W. L., Moulton L., Law T. C., Farrow G., Cooper-Anderson M., Savory J., and Rifai N., Clin. Chem. 47, 418 (2001). [PubMed] [Google Scholar]
- 5. Myers G. L., Rifai N., Tracy R. P., Roberts W. L., Alexander R. W., Biasucci L. M., Catravas J. D., Cole T. G., Cooper G. R., and Khan B. V., Circulation 110, e545 (2004). 10.1161/01.CIR.0000148980.87579.5E [DOI] [PubMed] [Google Scholar]
- 6. Ledue T. B. and Rifai N., Clin. Chem. Lab. Med. 39, 1171 (2001). [DOI] [PubMed] [Google Scholar]
- 7. Tsai H., Hsu C., Chiu I., and Fuh C. B., Anal. Chem. 79, 8416 (2007). 10.1021/ac071262n [DOI] [PubMed] [Google Scholar]
- 8. Ellington A. D. and Szostak J. W., Nature 346, 818 (1990). 10.1038/346818a0 [DOI] [PubMed] [Google Scholar]
- 9. Tuerk C. and Gold L., Science 249, 505 (1990). 10.1126/science.2200121 [DOI] [PubMed] [Google Scholar]
- 10. Xu Y., Phillips J. A., Yan J., Li Q., Fan Z. H., and Tan W., Anal. Chem. 81, 7436 (2009). 10.1021/ac9012072 [DOI] [PMC free article] [PubMed] [Google Scholar]
- 11. Luzi E., Minunni M., Tombelli S., and Mascini M., Trends Anal. Chem. 22, 810 (2003). 10.1016/S0165-9936(03)01208-1 [DOI] [Google Scholar]
- 12. You K. M., Lee S. H., Im A., and Lee S. B., Biotechnol. Bioprocess Eng. 8, 64 (2003). 10.1007/BF02940259 [DOI] [Google Scholar]
- 13. Khati M., J. Clin. Pathol. 63, 480 (2010). 10.1136/jcp.2008.062786 [DOI] [PubMed] [Google Scholar]
- 14. Huang C. J., Lin H. I., Shiesh S. C., and Lee G. B., Biosens. Bioelectron. 25, 1761 (2010). 10.1016/j.bios.2009.12.029 [DOI] [PubMed] [Google Scholar]
- 15. Lee W. B., Weng C. H., Cheng F. Y., Yeh C. S., Lei H. Y., and Lee G. B., Biomed. Microdevices 11, 161 (2009). 10.1007/s10544-008-9221-4 [DOI] [PubMed] [Google Scholar]
- 16. Huang C. C., Lee G. Y., Chyi J. I., Cheng H. T., Hsu C. P., Hsu Y. R., Hsu C. H., Huang Y. F., Sun Y. C., and Chen C. C., Biosens. Bioelectron. 41, 717 (2013). 10.1016/j.bios.2012.09.066 [DOI] [PMC free article] [PubMed] [Google Scholar]
- 17. Nayeli E., Stefan S. U., Volker C., and Oliver A., MRS Proc. 1763, IMRC2014-S2012B-O2003 (2015). [Google Scholar]
- 18. Espinosa N., Schwarz S. U., Cimalla V., and Ambacher O., Sens. Actuators, B 210, 633 (2015). 10.1016/j.snb.2015.01.019 [DOI] [Google Scholar]
- 19. Cheng C. C., Tsai Y. Y., Lin K. W., Chen H. I., Hsu W. H., Hong C. W., and Liu W. C., Sens. Actuators, B 113, 29 (2006). 10.1016/j.snb.2005.02.019 [DOI] [Google Scholar]
- 20. Chu B. H., Kang B., Chang C., Ren F., Goh A., Sciullo A., Wu W., Lin J., Gila B., and Pearton S. J., IEEE Sens. J. 10, 64 (2010). 10.1109/JSEN.2009.2035213 [DOI] [Google Scholar]
- 21. Kang B., Pearton S., Chen J., Ren F., Johnson J., Therrien R., Rajagopal P., Roberts J., Piner E., and Linthicum K., MRS Proc. 955, 0955-I0914-0906 (2006). [Google Scholar]
- 22. Kang B., Wang H., Lele T., Tseng Y., Ren F., Pearton S., Johnson J., Rajagopal P., Roberts J., and Piner E., Appl. Phys. Lett. 91, 112106 (2007). 10.1063/1.2772192 [DOI] [Google Scholar]
- 23. Pearton S., Kang B., Kim S., Ren F., Gila B., Abernathy C., Lin J., and Chu S., J. Phys.: Condens. Matter 16, R961 (2004). 10.1088/0953-8984/16/29/R02 [DOI] [Google Scholar]
- 24. Ibraimi F., Kriz D., Lu M., Hansson L. O., and Kriz K., Anal. Bioanal. Chem. 384, 651 (2006). 10.1007/s00216-005-0094-6 [DOI] [PubMed] [Google Scholar]
- 25. Li J., Chang K. W., Wang C. H., Yang C. H., Shiesh S. C., and Lee G. B., Biosens. Bioelectron. 79, 887 (2016). 10.1016/j.bios.2016.01.029 [DOI] [PubMed] [Google Scholar]
- 26. Chu C. H., Sarangadharan I., Regmi A., Chen Y. W., Hsu C. P., Chang W. H., Lee G. Y., Chyi J. I., Chen C. C., Lee G. B., and Wang Y. L., Sci. Rep. 7, 5256 (2017). [DOI] [PMC free article] [PubMed] [Google Scholar]
- 27. Lin S. P., Pan C. Y., Tseng K. C., Lin M. C., Chen C. D., Tsai C. C., Yu S. H., Sun Y. C., Lin T. W., and Chen Y. T., Nano Today 4, 235 (2009). 10.1016/j.nantod.2009.04.005 [DOI] [Google Scholar]
- 28. Stern E., Vacic A., Rajan N. K., Criscione J. M., Park J., Ilic B. R., Mooney D. J., Reed M. A., and Fahmy T. M., Nat. Nanotechnol. 5, 138 (2010). 10.1038/nnano.2009.353 [DOI] [PMC free article] [PubMed] [Google Scholar]
- 29. Zheng G., Patolsky F., Cui Y., Wang Y. U., and Lieber C. M., Nat. Biotechnol. 23, 1294 (2005). 10.1038/nbt1138 [DOI] [PubMed] [Google Scholar]


