

Abstract
Aim: Elevated level of serum triglyceride (TG) is a characteristic of type 2 diabetes. We evaluated the clinical significance of intervention for the serum TG levels in the fasting and postprandial states in patients with type 2 diabetes.
Methods: Fifty patients with type 2 diabetes, treated with statins, were selected and divided into two groups. One group was treated with a combination of fenofibrate and ezetimibe (F/E group) and the other group with statins (statin group) for 12 weeks. The lipoprotein profile of both groups was compared using high-performance liquid chromatography, and the vascular function was assessed using flow-mediated dilation (FMD) at the forearm.
Results: The levels of very low-density lipoprotein (VLDL) cholesterol, malondialdehyde low-density lipoprotein (MDA-LDL), total TG, chylomicron-TG, VLDL-TG, and HDL-TG decreased in the F/E group, whereas those of HDL cholesterol increased. Furthermore, the peak particle size of LDL increased, but that of HDL decreased in the F/E group. The combination treatment significantly improved the FMD. The change in the cholesterol level in a very small fraction of HDL was a significant independent predictor for determining the improvement of FMD (p < 0.01).
Conclusions: Compared with the treatment with statins, the treatment with the combination of fenofibrate and ezetimibe effectively controlled the LDL cholesterol and TG levels, increased the HDL cholesterol level, especially in its small fraction, and improved vascular function of patients with type 2 diabetes.
Keywords: Endothelial function, Triglyceride, Small dense LDL, HDL
Introduction
Patients with type 2 diabetes are at increased risk of cardiovascular events. The United Kingdom Prospective Diabetes Study showed that the level of low-density lipoprotein cholesterol (LDL-C) is the most important risk factor for cardiovascular events even in patients with type 2 diabetes1). The intervention for the LDL-C of patients with type 2 diabetes using statins significantly reduces cardiovascular events by 21%2). However, approximately 70% of cardiovascular events cannot be prevented by statin treatment3). Thus, the residual risk factors (other than LDL-C) may also have a crucial role. The characteristics of lipid abnormality in patients with type 2 diabetes are qualitative changes as well as quantitative abnormalities in lipoproteins such as an increase in the level of the triglyceride (TG)-containing lipoprotein and a decrease in the level of high-density lipoprotein cholesterol (HDL-C)4). The major qualitative abnormalities in lipoproteins found in patients with type 2 diabetes include changes in the size of lipoproteins and appearance of remnant particles. Furthermore, patients with type 2 diabetes often show lipid abnormalities after meals in spite of normal lipid levels at fasting5). These changes in the lipoproteins of patients with type 2 diabetes are closely related to the abnormality of serum TG levels and its metabolism6).
Vascular endothelial dysfunction independently predicts post treatment cardiovascular diseases7). Flow-mediated dilation (FMD) of the forearm artery, often serve as a marker of vascular endothelial function, is used as an indicator of evaluation in various therapeutic interventions8). FMD is reduced in patients with type 2 diabetes9). Numerous factors have been reported to be related to this dysfunction9–11). Among these, lipid abnormalities in the postprandial and fasting states are the important factors12). Increased level of serum TG associated with metabolic syndrome or insulin resistant state is particularly closely related to endothelial dysfunction13).
Aims
In this study, to evaluate the role of elevation of serum TG levels in the fasting and post prandial states in patients with type 2 diabetes treated with statins, we reduced the serum TG levels using a combination of ezetimibe and fenofibrate and assessed the endothelial function and quality of lipoproteins.
Methods
Subjects and Study Design
Fig. 1 shows the protocol of this study design. Patients with type 2 diabetes who had normal LDL-C levels and were treated with statins were recruited from the outpatient clinic of the authors' institution between October 2014 and November 2015. Fifty patients (31 men and 19 women) were included in the study. (Please refer to Supplemental Table 1 for detail information on statins used in this study.) Patients were excluded if they met one of the following criteria: age < 20 years, uncontrolled hypertension (≧ 180/100 mmHg), HbA1c (National Glycohemoglobin Standardization Program: NGSP) ≧ 8.0%, severe liver dysfunction, serum creatinine (sCr) ≧ 2.5 mg/dL, secondary or drug-induced lipid abnormalities, familial hypercholesterolemia, pregnancy, history of cardiovascular diseases, and use of lipid-lowering medications, except statins. All subjects were randomly assigned to an open-label treatment with either statin (statin group) or fenofibrate (160 mg/day) and ezetimibe (10 mg/day) (F/E group). There was no significant difference in the ratio of strong statins used between the two groups (see Supplemental Table 2). Background characteristics of both groups are shown in Table 1a. Before and after the 12-week intervention, we compared the metabolic parameters and FMD of the forearm to evaluate the endotheliumdependent vascular function between the two groups. We also performed a meal test to assess postprandial dyslipidemia. The meal test was performed after overnight fasting. The meal consisted of 75 g of carbohydrate (flour starch and maltose), 28.5 g of fat (butter), and 8 g of protein, providing a total of 592 kcal (meal test C; SARAYA Corp., Osaka, JPN). The subjects were instructed to ingest the meal with water or black tea within 20 min. Time measurement was started when they began to ingest the meal. Venous blood samples were drawn, and the FMD was assessed in the fasting state and at 120 min after the meal test. During the study, the subjects were requested to continue the diet and exercise therapy as before the intervention and to make no alterations in the medications. We did not set a wash-out period in this study. Because we treated the patients with the combination therapy of fenofibrate and ezetimibe for 12 weeks after changing from statin, the effects of statin have already disappeared at the end of the study.
Fig. 1.
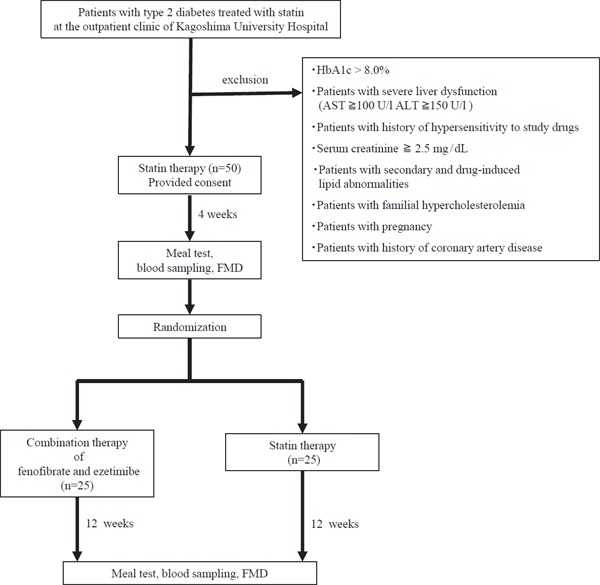
Protocol of the study design
Blood samples were taken at 0, 60, and 120 min after the meal test. FMD (flow mediated dilation) was performed before and at 120 min after the meal test.
Supplemental Table 1. The statins used before the present study.
| dosage | statin group (n = 25) | F/E group (n = 25) | |
|---|---|---|---|
| simvastatin | 5 mg | 1 | 1 |
| pravastatin | 5 mg | 8 | 3 |
| 10 mg | 2 | 2 | |
| fluvastatin | 20 mg | 1 | 0 |
| pitavastatin | 0.5 mg | 1 | 0 |
| 1.0 mg | 4 | 8 | |
| 2.0 mg | 1 | 3 | |
| atorvastatin | 5 mg | 3 | 4 |
| 10 mg | 2 | 2 | |
| rosuvastatin | 2.5 mg | 1 | 2 |
| 5.0 mg | 1 | 0 |
Supplemental Table 2. The number of strong and standard statins used in the statin group and fenofibrate and ezetimibe combination group.
| Groups | statin group | F/E group | total |
|---|---|---|---|
| Standard statin | 12 | 6 | 18 |
| Strong statin | 13 | 19 | 32 |
| total | 25 | 25 | 50 |
χ2(1) = 3.125, P = 0.070
Standard statins; simvastatin, pravastatin, fluvastatin. Strong statins; pitavastatin, atorvastatin, rosuvastatin
Table 1a. Patient clinical characteristics, diabetic control, endothelial function and treatment types before and 12 weeks after the drug intervention.
| Drug intervention | statin group (n = 25) | F/E group (n = 25) | |
|---|---|---|---|
| Age (yr) | 63.3 ± 10.0 | 60.2 ± 11.2 | |
| Sex (M/F) | 16/9 | 15/10 | |
| Body mass index (kg/m2) | 24.9 ± 4.5 | 27.4 ± 5.1 | |
| AST (U/l) | before | 22.6 ± 6.3 | 27.1 ± 14.2 |
| after | 22.7 ± 8.1 | 44.6 ± 57.7*†† | |
| ALT (U/l) | before | 24.7 ± 9.0 | 27.2 ± 27.7 |
| after | 24.6 ± 12.1 | 47.4 ± 79.0* | |
| γGT (U/l) | before | 41.0 ± 40.1 | 29.2 ± 15.6 |
| after | 37.0 ± 31.2 | 51.1 ± 64.6 | |
| sCr (mg/dL) | before | 0.8 ± 0.3 | 0.9 ± 0.3 |
| after | 0.9 ± 0.3 | 1.1 ± 0.4**† | |
| CPK (U/l) | before | 94.4 ± 24.2 | 132.6 ± 75.1 |
| after | 118.6 ± 46.9** | 136.1 ± 80.1 | |
| hsCRP (ng/mL) | before | 1240 ± 2715 | 968 ± 1060 |
| after | 1290 ± 2602 | 824 ± 818 | |
| FBG (mg/dL) | before | 121.7 ± 19.9 | 137.3 ± 38.2 |
| after | 118.4 ± 18.2 | 117.1 ± 31.3** | |
| HbA1C (%) | before | 6.9 ± 0.5 | 7.0 ± 0.4 |
| after | 6.8 ± 0.6 | 6.8 ± 0.4** | |
| FMD (%) | before | 5.2 ± 2.6 | 5.5 ± 2.4 |
| after | 4.8 ± 2.4 | 6.5 ± 2.2*† | |
| medication (n) | |||
| Hypoglycemic agent | 23 | 21 | |
| Insulin | 9 | 5 | |
| Antihypertensive drug | 15 | 10 | |
F/E group, fenofibrate and ezetimibe combination group; AST, Aspartate transaminase; ALT, Alanine transaminase; γGT, Gamma-Glutamyltranspeptidase; sCr, serum Creatinine; CPK, Creatine Phosphokinase; hsCRP, High-sensitivity C-reactive protein; FBG, fasting blood glucose; HbA1c, Hemoglobin A1c; FMD, Flow-mediated dilation.
Values are given as mean ± SD unless otherwise stated.
P < 0.05
P < 0.01 (vs before the drug intervention); between before and after the drug intervention comparison by paired t test or Wilcoxon test
P < 0.05
P < 0.01 (vs statin group); between statin and F/E group comparison by unpaired t test or Mann-Whitney test
All of the studies were approved by the Ethics Committee of Kagoshima University Graduate School of Medicine and Dentistry Sciences (approval number 26–34), and written informed consent was obtained from all subjects before the procedure. This study was registered with UMIN (UMIN000016676, March 2, 2015).
Laboratory Methods
Before and after the 12-week intervention, blood samples were obtained during the overnight fasting and at 120 min after the meal test. Biochemical variables were determined immediately except for cholesterol and TG contents of the lipoprotein subclasses. Serum levels of aspartate transaminase (AST), alanine transaminase, gamma-glutamyltranspeptidase, sCr, creatine phosphokinase, and HbA1c were determined by routine biochemical assays in the authors' institution. High-sensitivity C-reactive protein (hsCRP), fasting blood glucose, apolipoprotein A1 (apoA1), apolipoprotein B (apoB), apolipoprotein B48 (apoB48), remnant-like lipoprotein cholesterol, malondialdehyde low-density lipoprotein (MDA-LDL), and lipoprotein (a) [Lp(a)] were measured with SRL (Hachioji, JPN). Sitosterol and campesterol were measured as cholesterol absorption markers, and lathosterol was measured as a cholesterol synthesis marker by SRL. Lipoprotein lipase (LPL) was measured with Skylight Biotech (Akita, JPN). Serum samples were separated into 20 different lipoprotein subclasses using high-performance liquid chromatography by Skylight Biotech. Cholesterol and TG concentrations of the major lipoproteins and their subclasses were calculated with a computer software program designed to process complex chromatograms with a modified Gaussian curve-fitting function (LipoSERCH; Skylight Biotech).
Ultrasonographic Measurement of Endothelial Function
The FMD of the right brachial artery was evaluated using A- and B-mode ultrasonography (UNEX Corp, Nagoya, JPN). The subjects were instructed to lie down for 15 min. The baseline diameter of the brachial artery was defined as its mean diameter 5 cm proximal to the elbow joint during 10 consecutive diastoles on an electrocardiogram before hyperemia. After the baseline diameter was determined, forearm hyperemia was produced using a sphygmomanometric cuff inflation 50 mmHg greater than the systolic blood pressure, which was applied for 5 min. The maximum diameter of the brachial artery after hyperemia was measured for 120 s after the cuff was deflated. The rate of change in diameter (%) determined using the maximum diameter at baseline and after hyperemia was defined as the FMD.
Statistical Analysis
All statistical analyses were performed with the SPSS version 22.0 (SPSS, Inc., Chicago, USA). Results were presented as mean ± standard deviation (SD). Differences in the continuous variables between the two groups were compared. To compare normally distributed variables, an unpaired t-test was used; otherwise, the Mann–Whitney U test was performed. Differences in the continuous variables within each group were compared using the two-sided paired t-test or the two-sided Wilcoxon's signed rank test. The former test was performed when the variables showed a normal distribution; otherwise, the latter test was used. The association between the variables, including lipid-related variables or covariates [age, sex, and body mass index (BMI)], was examined using multiple regression models. Adjustment for the differences in the baseline covariates and changes in the variables of the study were performed with analysis of variance (ANOVA) using general linear models. Significance was defined at the 5% level using a two-tailed test (p < 0.05).
Results
Characteristics of the Subjects
Tables 1a, 1b, and 1c show the characteristics of the statin and F/E groups before and after the intervention. Age, sex, BMI, medication, and glycemic parameters were not significantly different between the two groups. AST and sCr were also not significantly different between the two groups before the intervention; however, AST and sCr were higher in the F/E group compared with those in the statin group after the intervention. AST, ALT, and sCr were higher after the drug intervention compared with those before the drug intervention in the F/E group. FBG and HbA1c were lower after the drug intervention compared with those before the drug intervention in the F/E group (Table 1a). Lipid profiles were not significantly different between the two groups before the drug intervention. In the F/E group, the levels of chylomicron (CM) cholesterol, very low-density lipoprotein (VLDL) cholesterol, total TG, CM-TG, VLDL-TG, and HDL-TG decreased after the drug intervention compared with those before the drug intervention. The levels of HDL-C and LDL-TG increased in the F/E group after the drug intervention compared with those before the drug intervention.
Table 1b. Lipid levels before and 12 weeks after the drug intervention.
| Drug intervention | statin group (n = 25) | F/E group (n = 25) | |
|---|---|---|---|
| Total cholesterol (mg/dL) | before | 179.4 ± 27.6 | 186.6 ± 28.1 |
| after | 179.7 ± 24.5 | 178.3 ± 27.1 | |
| CM-C (mg/dL) | before | 3.2 ± 3.4 | 4.1 ± 4.6 |
| after | 1.3 ± 1.5** | 0.6 ± 1.0** | |
| VLDL-C (mg/dL) | before | 36.3 ± 8.4 | 42.5 ± 14.1 |
| after | 34.7 ± 10.3 | 27.5 ± 10.1** †† | |
| LDL-C (mg/dL) | before | 86.8 ± 15.5 | 88.1 ± 16.2 |
| after | 91.6 ± 15.4 | 90.7 ± 21.6 | |
| HDL-C (mg/dL) | before | 53.1 ± 14.2 | 51.8 ± 9.10 |
| after | 52.1 ± 12.0 | 59.4 ± 10.2** † | |
| Total-triglyceride (mg/dL) | before | 131.8 ± 54.6 | 154.6 ± 72.3 |
| after | 145.4 ± 64.0 | 100.2 ± 49.0**†† | |
| CM-TG (mg/dL) | before | 14.0 ± 16.1 | 17.9 ± 21.3 |
| after | 7.4 ± 8.9** | 3.0 ± 5.5** † | |
| VLDL-TG (mg/dL) | before | 74.8 ± 35.7 | 92.4 ± 41.3 |
| after | 93.6 ± 51.9** | 54.5 ± 36.5** †† | |
| LDL-TG (mg/dL) | before | 26.5 ± 5.2 | 27.1 ± 7.4 |
| after | 27.6 ± 5.0 | 29.9 ± 6.9** | |
| HDL-TG (mg/dL) | before | 16.4 ± 5.1 | 17.2 ± 7.8 |
| after | 16.9 ± 5.9 | 12.9 ± 4.8** † | |
| RLP-C (mg/dL) | before | 4.6 ± 3.0 | 5.2 ± 3.3 |
| after | 4.6 ± 3.0 | 4.5 ± 2.0 | |
| MDA-LDL (U/l) | before | 121.8 ± 39.1 | 134.4 ± 34.1 |
| after | 123.8 ± 31.1 | 101.8 ± 22.8**† |
F/E group, fenofibrate and ezetimibe combination group; CM-C, Chylomicron Cholesterol; VLDL-C, Very Low-Density Lipoprotein Cholesterol; LDL-C, Low-Density Lipoprotein Cholesterol; HDL-C, High-Density Lipoprotein Cholesterol; CM-TG, Chylomicron Triglyceride; VLDL-TG, Very Low-Density Lipoprotein Triglyceride; LDL-TG, Low-Density Lipoprotein Triglyceride; HDL-TG, High-Density Lipoprotein Triglyceride; RLP-C, Remnant Like particles Cholesterol; MDA-LDL, Malondialdehyde Low-Density Lipoprotein. Values are given as mean ± SD.
P < 0.05
P < 0.01 (vs before the drug intervention); between before and after the drug intervention comparison by paired t test or Wilcoxon test
P < 0.05
P < 0.01 (vs statin group); between statin and F/E group comparison by unpaired t test or Mann-Whitney test
Table 1c. Apolipoprotein, lipoprotein, and lipase levels and synthesis and resorption markers before and 12 weeks after the drug intervention.
| Drug intervention | statin group (n = 25) | F/E group (n = 25) | |
|---|---|---|---|
| apoB48 (µg/mL) | before | 5.5 ± 3.7 | 6.1 ± 4.7 |
| after | 5.7 ± 2.9 | 3.4 ± 2.8**†† | |
| apoB (mg/dL) | before | 91.0 ± 16.6 | 98.2 ± 18.3 |
| after | 88.9 ± 14.5 | 84.9 ± 18.2** | |
| apoA1 (mg/dL) | before | 148.2 ± 30.4 | 152.7 ± 24.1 |
| after | 150.2 ± 28.8 | 164.4 ± 21.5* | |
| Lp(a) (mg/dL) | before | 14.9 ± 13.9 | 31.1 ± 33.7 |
| after | 16.4 ± 13.9 | 24.5 ± 23.2* | |
| LPL (ng/mL) | before | 94.8 ± 37.7 | 87.1 ± 31.3 |
| after | 118.6 ± 154.6 | 74.9 ± 26.0* | |
| sitosterol (µg/mL) | before | 3.6 ± 2.5 | 2.8 ± 0.8 |
| after | 3.9 ± 3.0 | 0.8 ± 0.4**†† | |
| campesterol (µg/mL) | before | 7.0 ± 4.1 | 5.8 ± 1.7 |
| after | 7.1 ± 4.7 | 2.1 ± 0.5**†† | |
| lathosterol (µg/mL) | before | 1.2 ± 0.8 | 1.7 ± 0.7 |
| after | 1.2 ± 0.8 | 3.2 ± 1.9**†† |
F/E group, fenofibrate and ezetimibe combination group; Apo, apolipoprotein; Lp(a), lipoprotein (a); LPL, Lipoprotein lipase. Values are given as mean ± SD.
P < 0.05
P < 0.01 (vs before the drug intervention); between before and after the drug intervention comparison by paired t test or Wilcoxon test
P < 0.05
P < 0.01 (vs statin group); between statin and F/E group comparison by unpaired t test or Mann-Whitney test
The LDL-C level did not change; however, the MDA-LDL level decreased in the F/E group after the drug intervention compared with that before the drug intervention (Table 1b). The levels of apolipoprotein, Lp(a), and LPL were not significantly different between the two groups before the drug intervention. In the F/E group, the levels of apolipoprotein, Lp(a), and LPL were significantly different between before and after the drug intervention. However, only ApoB48 level decreased in the F/E group compared with that in the statin group after the drug intervention (Table 1c). The levels of sitosterol, campesterol, and lathosterol were not significantly different between the two groups before the drug intervention. In the F/E group, the levels of sitosterol and campesterol, which are markers of cholesterol absorption, significantly decreased, and the levels of lathosterol, which is a marker of cholesterol synthesis, significantly increased after the drug intervention compared with those before the drug intervention. In the statin group, the levels of sitosterol, campesterol, and lathosterol were not significantly different after the drug intervention compared with those before the drug intervention (Table 1c).
Lipid and Glycemic Profiles after the Meal Test
Table 2 shows the results of the meal test after the drug intervention. The levels of total cholesterol, VLDL-TG, HDL-TG, and LDL were not significantly different between 0 and 120 min. The levels of CM cholesterol, total TG, CM-TG, VLDL-TG, HDL-TG, MDA-LDL, and apoB48 in the F/E group were lower than those in the statin group at 120 min of the meal test. The levels of HDL-C and apoA1 in the F/E group were higher than those in the statin group at 120 min of the meal test. In particular, when the results of the meal test were compared between 0 and 120 min, the CM cholesterol level in the F/E group was significantly lower only at 120 min of the meal test, while the significance of the low VLDL cholesterol level in the F/E group disappeared at 120 min of the meal test.
Table 2. Lipid and glycemic profiles and endothelial function changes before and after meal test, 12 weeks after the drug intervention.
| time (min.) | statin group | F/E group | |
|---|---|---|---|
| hsCRP (ng/mL) | 0 | 1290 ± 2602 | 824 ± 818 |
| 120 | 1144 ± 2295** | 702 ± 656** | |
| FBG (mg/dL) | 0 | 118.4 ± 18.2 | 117.1 ± 31.3 |
| 120 | 239.1 ± 61.9** | 220.8 ± 49.3** | |
| FMD (%) | 0 | 4.8 ± 2.4 | 6.5 ± 2.2† |
| 120 | 3.8 ± 2.1** | 5.0 ± 1.8**† | |
| Total cholesterol (mg/dL) | 0 | 179.7 ± 24.5 | 178.3 ± 27.1 |
| 120 | 157.0 ± 21.5** | 156.9 ± 22.9 | |
| CM-C (mg/dL) | 0 | 1.3 ± 1.5 | 0.6 ± 1 |
| 120 | 1.5 ± 1.2* | 0.9 ± 0.8**† | |
| VLDL-C (mg/dL) | 0 | 34.7 ± 10.3 | 27.5 ± 10.1†† |
| 120 | 28 ± 8.7** | 24.6 ± 8.8** | |
| LDL-C (mg/dL) | 0 | 91.6 ± 15.4 | 90.7 ± 21.6 |
| 120 | 81.9 ± 14.1** | 79.3 ± 18.8** | |
| HDL-C (mg/dL) | 0 | 52.1 ± 12 | 59.4 ± 10.2† |
| 120 | 45.5 ± 9.8** | 52.1 ± 8.6**† | |
| Total-Triglyceride (mg/dL) | 0 | 145.4 ± 64 | 100.2 ± 49†† |
| 120 | 158.7 ± 67.2** | 119 ± 54.8**† | |
| CM-TG (mg/dL) | 0 | 7.4 ± 8.9 | 3.0 ± 5.5† |
| 120 | 13.8 ± 11** | 7.3 ± 6.3**† | |
| VLDL-TG (mg/dL) | 0 | 93.6 ± 51.9 | 54.5 ± 36.5†† |
| 120 | 105.3 ± 53** | 73.4 ± 42.7† | |
| LDL-TG (mg/dL) | 0 | 27.6 ± 5 | 29.9 ± 6.9 |
| 120 | 23.8 ± 4.6** | 25.6 ± 6** | |
| HDL-TG (mg/dL) | 0 | 16.9 ± 5.9 | 12.9 ± 4.8†† |
| 120 | 15.8 ± 5.3** | 12.7 ± 4.2† | |
| RLP-C (mg/dL) | 0 | 4.6 ± 3 | 4.5 ± 2.0** |
| 120 | 6.5 ± 3 | 5.6 ± 1.9** | |
| MDA-LDL (U/l) | 0 | 123.8 ± 31.1 | 102.7 ± 22.8†† |
| 120 | 106.9 ± 38.7** | 82.2 ± 20.2**†† | |
| apoB48 (µg/mL) | 0 | 5.7 ± 2.9 | 3.4 ± 2.8†† |
| 120 | 9.2 ± 3.7** | 6.3 ± 2.8**†† | |
| apoB (mg/dL) | 0 | 88.9 ± 14.5 | 84.9 ± 18.2 |
| 120 | 78.4 ± 14.9** | 74.5 ± 15.5** | |
| apoA1 (mg/dL) | 0 | 150.2 ± 28.7 | 164.4 ± 21.5 |
| 120 | 132.8 ± 22.8** | 145 ± 17.3**† | |
| LPL (ng/mL) | 0 | 118.6 ± 154.6 | 74.9 ± 26.0 |
| 120 | 81.4 ± 28.4* | 71.2 ± 24.9 | |
F/E group, fenofibrate and ezetimibe combination group; hsCRP, High-sensitivity C-reactive Protein; FBG, Fasting Blood Glucose; FMD, Flowmediated Dilation; CM-C, Chylomicron Cholesterol; VLDL-C, Very Low-Density Lipoprotein Cholesterol; LDL-C, Low-Density Lipoprotein Cholesterol; HDL-C, High-Density Lipoprotein Cholesterol; CM-TG, Chylomicron Triglyceride; VLDL-TG, Very Low-Density Lipoprotein Triglyceride; LDL-TG, Low-Density Lipoprotein Triglyceride; HDL-TG, High-Density Lipoprotein Triglyceride; RLP-C, Remnant Like particles Cholesterol; MDA-LDL, Malondialdehyde Low-Density Lipoprotein; Apo, apolipoprotein; LPL, Lipoprotein lipase. Values are given as mean ± SD.
P < 0.05
P < 0.01 (vs 0min after test meal); between 0min and 120min after test meal comparison by paired t test or Wilcoxon test
P < 0.05
P < 0.01 (vs statin group); between statin and F/E group comparison by unpaired t test or Mann-Whitney test.
Cholesterol and TG Contents in the Lipoprotein Subclasses
Cholesterol and TG contents in 20 lipoprotein subclasses are shown in Fig. 2. In the statin group, the fasting cholesterol levels in CM, large VLDL, and very large HDL were slightly lower, whereas those in small VLDL and large LDL were slightly higher after the drug intervention than before the drug intervention. In the F/E group, the fasting cholesterol levels in CM, large VLDL, middle VLDL, small LDL, very small LDL, very large HDL, and large HDL were lower, whereas those in large LDL, middle HDL, small HDL, and very small HDL were higher after the drug intervention than before the drug intervention. The same tendency was observed before and after the meal test in the statin group. However, in the F/E group, the significant decrease in the cholesterol fraction in VLDL caused by the change in the treatment disappeared after the meal test (Fig. 2a).
Fig. 2a.
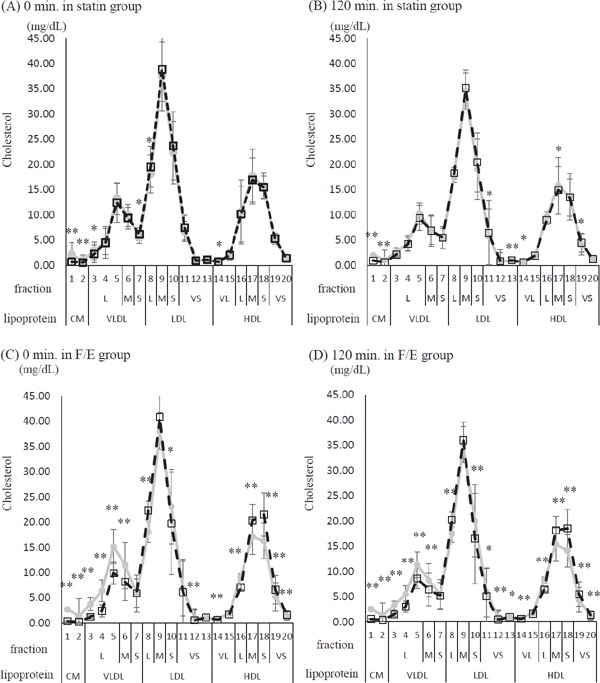
Twenty fractionated cholesterol, comparison of before and after the drug intervention at 0 and 120 min of the meal test
Gray line and circles correspond to before the drug intervention, while dashed line and blank squares correspond to after the drug intervention. (A) 0 min of the meal test in the statin group. (B) 120 min of the meal test in the statin group. (C) 0 min of the meal test in the fenofibrate and ezetimibe combination group (F/E group). (D) 120 min of the meal test in the F/E group. Lipoprotein fraction: CM, Chylomicron; VLDL, Very Low-Density Lipoprotein; LDL, Low-Density Lipoprotein; HDL, High-Density Lipoprotein. Fraction size: VL; very large, L; large, M; middle, S; small, VS; very small. Values are given as mean ± SD. *p < 0.05, **p < 0.01; between-group comparison by paired t-test or Wilcoxon signed rank test
In the F/E group, either at fasting or after the meal test, the TG levels in CM, large VLDL, middle VLDL, very small LDL, very large HDL, large HDL, and middle HDL decreased after the drug intervention compared with those before the drug intervention (Fig. 2b).
Fig. 2b.
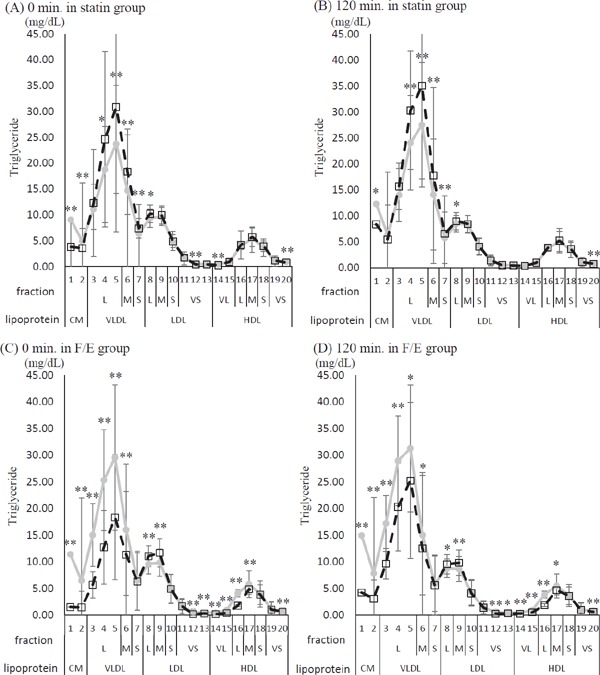
Twenty fractionated triglyceride, comparison of before and after the drug intervention at 0 and 120 min of the meal test
Gray line and circles correspond to before the drug intervention, while dashed line and blank squares correspond to after the drug intervention. (A) 0 min of the meal test in the statin group. (B) 120 min of the meal test in the statin group. (C) 0 min of the meal test in the fenofibrate and ezetimibe combination group (F/E group). (D) 120 min of the meal test in the F/E group. Lipoprotein fraction: CM, Chylomicron; VLDL, Very Low-Density Lipoprotein; LDL, Low-Density Lipoprotein; HDL, High-Density Lipoprotein. Fraction size: VL; very large, L; large, M; middle, S; small, VS; very small. Values are given as mean ± SD. *p < 0.05, **p < 0.01; between-group comparison by paired t-test or Wilcoxon signed rank test
The peak particle sizes of LDL and HDL were compared between the two groups. The peak particle-size diameter of LDL increased, but that of HDL decreased in the F/E group compared with the statin group (Fig. 3).
Fig. 3.
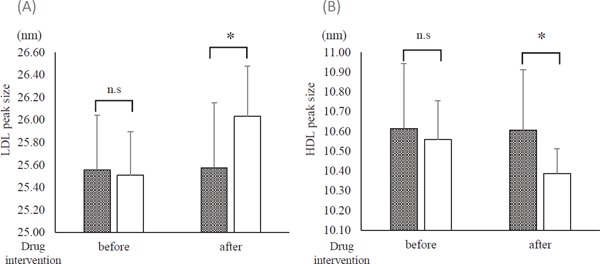
Peak sizes of LDL and HDL before and after the drug intervention
Gray column: statin group. Open column: fenofibrate and ezetimibe combination group (F/E group). (A) Peak size of LDL. (B) Peak size of HDL. *p < 0.01; between-group comparison by unpaired t-test or Mann. Whitney U test.
Vascular Function
The results of FMD at fasting and 120 min after the meal test are shown in Fig. 4. Before the intervention, no significant difference in FMD was observed between the two groups. After the intervention, FMD significantly improved in the F/E group compared with that in the statin group either at fasting or after the meal test (Fig. 4).
Fig. 4.
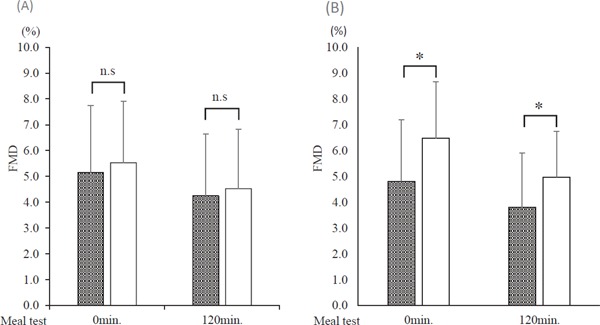
Comparison of flow-mediated dilation (FMD) before and after the meal test through the drug intervention
Gray column: statin group. Open column: fenofibrate and ezetimibe combination group (F/E group). (A) Before the drug intervention. (B) After the drug intervention. *p < 0.05; between-group comparison by unpaired t-test or Mann–Whitney U test.
Association between FMD and Lipid Profile
To elucidate the factors associated with the improvement of FMD in this study, a stepwise multiple linear regression analysis was performed. In the F/E group, ⊿Lp(a) (β = −0.656, p < 0.01) and ⊿very small HDL (VS-HDL) cholesterol (β = 0.438, p = 0.01) were independent predictors for determining ⊿ FMD [adjusted R2 = 0.412, ANOVA p < 0.01] (Table 3). The results of the comparison of Lp(a) and VSHDL cholesterol are shown in Fig. 5. In the statin group, significant differences were not found in the results before and after the intervention. In the F/E group, both the levels of Lp(a) and VS-HDL cholesterol were significantly different before and after the intervention. However, the levels of Lp(a) were not different between the statin group and the F/E group before and after the drug intervention.
Table 3. Multiple regression analysis of the FMD changes (⊿FMD) before and after the drug intervention in the F/E group.
| Characteristic change | Standardized partial regression coefficient | P-value | 95%confidence interval |
|
|---|---|---|---|---|
| lower | upper | |||
| ⊿Lipoprotein (a) | −0.656 | < 0.01 | −0.106 | −0.533 |
| ⊿Very Small-HDL (19 fraction) cholesterol | 0.438 | 0.01 | 0.153 | 0.253 |
R2 = 0.412, ANOVA p < 0.01
Fig. 5.
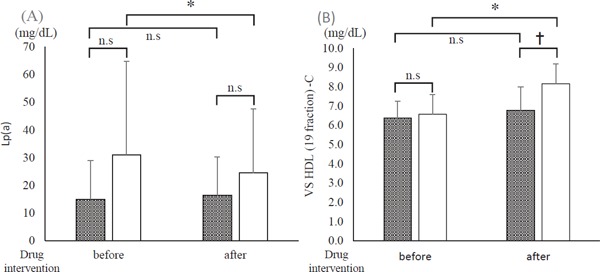
Changes in the independent variable related to flow-mediated dilation (FMD) before and after the intervention
Gray column: statin group. Open column: fenofibrate and ezetimibe combination group (F/E group). (A) Lipoprotein (a) (Lp(a)). (B) Very small High-density lipoprotein (19 fraction) cholesterol (VS HDL-C). *p < 0.05; between-group comparison by Mann–Whitney U test. †p < 0.05; between-group comparison by paired t-test or Wilcoxon signed rank test.
Discussion
In this study, treatment with statins was compared with that with the combination of fenofibrate and ezetimibe in patients with type 2 diabetes. The patients treated with the combination showed significantly lower levels of serum TG without any differences in LDL-C levels as compared with those treated with statins. The reduction of the serum TG levels was associated with an increase in the small HDL-C fraction and a decrease in the small LDL-C fraction. In addition to the improvement of the lipid profile, the group treated with the combination of fenofibrate and ezetimibe showed recovery of vascular function assessed using the forearm FMD. Multiple regression analysis revealed that the improvement of FMD was associated with the decrease in the levels of Lp(a) and the increase in the very small HDL-C fraction. To the best of our knowledge, this study is the first to report that the intervention for the serum TG with the combination of fenofibrate and ezetimibe in patients with type 2 diabetes treated with statins not only improved the lipoprotein profile but also the vascular function.
Dyslipidemia in patients with type 2 diabetes is characterized by an increase in serum TG level and a decrease in HDL-C level, which is associated with an increase in the fraction of small dense LDL-C, known as an atherogenic LDL14). Treatment with statins reduces the serum LDL-C level effectively, but it does not improve the characteristics of dyslipidemia found in patients with type 2 diabetes. Therefore, we used a fibrate in the present study. The treatment with fenofibrate successfully reduced the serum TG level and increased the HDL-C level. In addition, patients with type 2 diabetes were reported to have increased intestinal cholesterol absorption mediated by the Niemann-Pick C1-like 1 (NPC1L1) protein15). Ezetimibe inhibits cholesterol absorption by selectively blocking the NPC1L1 protein in the jejunal brush border and depletes hepatic pools of cholesterol. This increases the expression of the LDL receptor on the hepatocyte surface, which leads to reductions in the serum levels of LDL-C16). Thus, treatment with ezetimibe is reasonable for hyper-LDL cholesterolemia in patients with type 2 diabetes.
Oikawa et al. reported that the combination therapy with fenofibrate and ezetimibe reduces concentrations of LDL-cholesterol and triglyceride and is safe in a long-term treatment17). We found that the treatment with the combination significantly reduced the cholesterol levels in small and very small fractions of LDL and increased the cholesterol levels in large fractions of LDL. Since the LDL with small diameter is known as a cardiovascular event risk18), the change observed in the treatment with the combination may suggest an advantage of the treatment. The LDL in the small fraction can be oxidized easily19), and the serum levels of small dense LDL and MDA-LDL, a form of oxidized LDL, are positively correlated20). Thus, the decrease in the MDA-LDL in patients treated with the combination may be explained by the reduction of the cholesterol level in the small LDL fraction. In contrast to the change in the diameter of LDL, the treatment with the combination of fenofibrate and ezetimibe increases the cholesterol level of small HDL fractions. Since the reduction of TG-rich lipoproteins after the treatment with the combination should have similar effects on the size of HDL as those on the size of LDL, the decreased size of HDL in patients treated with the combination suggests a direct effect of fenofibrate on the HDL synthesis due to the increase in the production of apoA1 and apoA2 in the liver. Interestingly, the association of HDL function with the size was reported21, 22). The small fraction of HDL is enriched with negatively charged phospholipids, which are associated with cellular cholesterol efflux, anti-oxidation, anti-thrombosis, anti-inflammation, and anti-apoptosis effects. Thus, the change in the size of HDL is another benefit of the treatment with the combination of fenofibrate and ezetimibe.
The treatment with the combination of fenofibrate and ezetimibe ameliorated the vascular function assessed with FMD. Multiple regression analysis identified that the amount of increase in the cholesterol of the very small HDL fraction and the amount of decrease in the Lp(a) were significantly correlated with the improvement of FMD. HDL, particularly the small fraction of HDL, has direct effects on the endothelium, including the promotion of nitric oxide production and prevention of nitric oxide degradation by an anti-oxidant effect22, 23). HDL has been reported to increase nitric oxide production by inducing the phosphorylation of endothelial nitric oxide synthesis (eNOS) and the expression of eNOS24). Importantly, impairment in these activities on the endothelial cells of the HDL from the patients with type 2 diabetes was reported25). Recent studies have unequivocally established Lp(a) as a causal and independent risk factor for atherosclerotic cardiovascular diseases, even under maximal intensity statin treatment26). However, we did not find any significant differences in the level of Lp(a) between the patients treated with the combination of fenofibrate and ezetimibe and those treated with statins; thus, further investigation is necessary to determine whether the treatment with the combination reduces the level of Lp(a) in patients with type 2 diabetes.
Several investigations have reported the improvement of postprandial dyslipidemia after treatment with ezetimibe27, 28). Ito et al. found that the amelioration of postprandial dyslipidemia by ezetimibe is due to the improvement in the endothelial function29). In the present study, we observed that the patients did not show significant hyperlipidemia in the postprandial state. Treatment with the combination of fenofibrate and ezetimibe ameliorated serum TG and HDL-C levels at fasting and postprandial time, as well as improved vascular function. These results may indicate that the amelioration of postprandial hyperlipidemia alone cannot explain all the improvement in the vascular function found in the present study. We measured the postprandial lipid profiles and assessed the vascular function 2 h after the meal, which may not be optimal to assess the maximum effects of the meal.
Non-HDL-C has shown similar or stronger association with coronary artery disease (CAD) than LDL-C30). Also, it has been reported that non-HDL-C is a more superior predictor of small-dense LDL-C than LDL-C31). However, in this study, we did not evaluate non-HDL-C in detail.
FMD is widely accepted for evaluating the endothelial dysfunction on the premise that normality of smooth muscle function is preserved. However, it is reported that 51% of type 2 diabetes patients had low nitroglycerin-mediated dilation, which reflects vascular smooth muscle function32). Thus, in type 2 diabetes patients, evaluating endothelial function with FMD alone is difficult. Therefore, we consider that FMD reflects vascular function including endothelial and smooth muscle functions in this study.
Conclusions
Treatment with a combination of fenofibrate and ezetimibe effectively controlled the LDL-C and TG levels and improved vascular function in patients with type 2 diabetes. Compared with the treatment with statins, the treatment with the combination increased the HDL-C level, especially in its small fraction, and decreased the TG and small LDL-C levels. The amelioration of vascular function through treatment with the combination was significantly associated with the elevation of the very small fraction of HDL-C.
Acknowledgments
The authors thank the patients and their families and appreciate the assistance of the medical technologists in the authors' institution.
Notice of Financial Support
This study was financially supported by Bayer Yakuhin, Ltd. The authors have received research grants from the Immuno-Biological Laboratory. However, these companies were not involved in the design, execution, and analysis and interpretation of data of this study.
COI
Honoraria (lecture fee):
Astellas Pharma Inc., Ono Pharmaceutical Co., MSD KK, Mitsubishi Tanabe Pharma, Kowa Pharmaceutical Co., Bayer Yakuhin, Ltd., Takeda Pharmaceutical CO. Ltd., Sanofi KK, AstraZeneca KK, Sumitomo Dainippon Pharma., Eisai Co., and Shionogi & Co.
Grant/Research Support:
Astellas Pharma Inc., Ono Pharmaceutical Co., MSD KK, Mitsubishi Tanabe Pharma, and Bayer Yakuhin, Ltd.
Consignment/Joint Study:
Immuno-Biological Laboratory
References
- 1). Turner RC, Millns H, Neil HA, Stratton IM, Manley SE, Matthews DR, Holman RR: Risk factors for coronary artery disease in non-insulin dependent diabetes mellitus: United Kingdom Prospective Diabetes Study (UKPDS: 23). BMJ, 1998; 316: 823-828 [DOI] [PMC free article] [PubMed] [Google Scholar]
- 2). Kearney PM, Blackwell L, Collins R, Keech A, Simes J, Peto R, Armitage J, Baigent C: Efficacy of cholesterollowering therapy in 18,686 people with diabetes in 14 randomised trials of statins: a meta-analysis. Lancet, 2008; 371: 117-125 [DOI] [PubMed] [Google Scholar]
- 3). Lorenzo C, Hartnett S, Hanley AJ, Rewers MJ, wagenknecht LE, Karter AJ, Haffner SM: Impaired fasting glucose and impaired glucose tolerance have distinct lipoprotein and apolipoprotein changes: the insulin resistance atherosclerosis study. J Clin Endocrinol Metab, 2013; 98: 1622-1630 [DOI] [PMC free article] [PubMed] [Google Scholar]
- 4). Tanaka A: Postprandial hyperlipidemia and atherosclerosis. J Atheroscler Thromb, 2004; 11: 322-329 [DOI] [PubMed] [Google Scholar]
- 5). Ai M, Tanaka A, Ogita K, Sekinc M, Numano F, Numano F, Reaven GM: Relationship between plasma insulin concentration and plasma remnant lipoprotein response to an oral fat load in patients with type 2 diabetes. J Am Col Cardiol, 2001; 38: 1628-1632 [DOI] [PubMed] [Google Scholar]
- 6). Taskinen MR, Boren J: New insights into the pathophysiology of dyslipidemia in type 2 diabetes. Atherosclerosis, 2015; 239: 483-495 [DOI] [PubMed] [Google Scholar]
- 7). Ras RT, Streppel MT, Draijer R, Zock PL: Flow-mediated dilation and cardiovascular risk prediction: a systematic review with meta-analysis. Int J Cardiol, 2013; 168: 344-351 [DOI] [PubMed] [Google Scholar]
- 8). Mori H, Maeda A, Wakabayashi K, Sato T, Sasaki M, Tashiro K, Iso Y, Ebato M, Suzuki H: The Effect of Cilostazol on Endothelial Function as Assessed by Flow-Mediated Dilation in Patients with Coronary Artery Disease. J Atheroscler Thromb, 2016; 23: 1168-1177 [DOI] [PMC free article] [PubMed] [Google Scholar]
- 9). Fakhrzadeh H, Sharifi F, Alizadeh M, Arzaghi SM, Tajallizade-Khoob Y, Tootee A, Alatab S, Mirarefin M, Badamchizade Z, Kazami H: Relationship between insulin resistance and subclinical atherosclerosis in individuals with and without type 2 diabetes mellitus. J Diab Metab Disord, 2015; 15: 41. [DOI] [PMC free article] [PubMed] [Google Scholar]
- 10). Benjamin EJ, Larson MG, Keyes MJ, Mitchell GF, Vasan RS, Keaney JF, Jr, lehman BT, Fan S, Osypiuk E, Vita JA: Clinical correlates and heritability of flow-mediated dilation in the community: the Framingham Heart Study. Circulation, 2004; 109: 613-619 [DOI] [PubMed] [Google Scholar]
- 11). Widlansky ME, Gokce N, Keaney JF, Jr, Vita JA: The clinical implications of endothelial dysfunction. J Am Col Cardiol, 2003; 42: 1149-1160 [DOI] [PubMed] [Google Scholar]
- 12). Marchesi S, Lupattelli G, Schillaci G, Pirro M, Siepi D, Roscini AR, Pasqualini L, Mannarino E: Impaired flow-mediated vasoactivity during post-prandial phase in young healthy men. Atherosclerosis, 2000; 153: 397-402 [DOI] [PubMed] [Google Scholar]
- 13). Watts GF, O'Brien SF, Silvester W, Millar JA: Impaired endothelium-dependent and independent dilatation of forearm resistance arteries in men with diet-treated noninsulin-dependent diabetes: role of dyslipidaemia. Clin Sci, 1996; 91: 567-573 [DOI] [PubMed] [Google Scholar]
- 14). Carmena R: Type 2 diabetes, dyslipidemia, and vascular risk: rationale and evidence for correcting the lipid imbalance. Am Heart J, 2005; 150: 859-870 [DOI] [PubMed] [Google Scholar]
- 15). Lally S, Tan CY, Owens D, Tomkin GH: Messenger RNA levels of genes involved in dysregulation of postprandial lipoproteins in type 2 diabetes: the role of Niemann-Pick C1-like 1, ATP-binding cassette, transporters G5 and G8, and of microsomal triglyceride transfer protein. Diabetologia, 2006; 49: 1008-1016 [DOI] [PubMed] [Google Scholar]
- 16). Phan BA, Dayspring TD, Toth PP: Ezetimibe therapy: mechanism of action and clinical update. Vasc Health Risk Manag, 2012; 8: 415-427 [DOI] [PMC free article] [PubMed] [Google Scholar]
- 17). Oikawa S, Yamashita S, Nakaya N, Sasaki J. Kono S for the Effect of Fenofibrate and Ezetimibe Combination Treatment on Lipid (EFECTL) Study Investigators: Efficacy and Safety of Long-term Coadministration of Fenofibrate and Ezetimibe in Patients with Combined Hyperlipidemia: Results of the EFECTL Study. J Atheroscler Thromb, 2017; 24: 77-94 [DOI] [PMC free article] [PubMed] [Google Scholar]
- 18). Lamarche B, Tchernof A, Moorjani S, Cantin B, Dagenais GR, Lupien PJ, Despres JP: Small, dense low-density lipoprotein particles as a predictor of the risk of ischemic heart disease in men. Prospective results from the Quebec Cardiovascular Study. Circulation, 1997; 95: 69-75 [DOI] [PubMed] [Google Scholar]
- 19). Takahashi R, Imamura A, Yoshikane M, Suzuki M, Cheng XW, Numaguchi Y, Ikeda N, Murohara T, Okumura K: Circulating malondialdehyde-modified low-density lipoprotein is strongly associated with very small low-density lipoprotein cholesterol concentrations in healthy men. Clin Chim Acta, 2009; 399: 74-78 [DOI] [PubMed] [Google Scholar]
- 20). Tanaga K, Bujo H, Inoue M, Mikami K, Kotani K, Takahashi K, Kanno T, Saito Y: Increased circulating malondialdehyde-modified LDL levels in patients with coronary artery diseases and their association with peak sizes of LDL particles. Arterioscler Thromb Vasc Biol, 2002; 22: 662-666 [DOI] [PubMed] [Google Scholar]
- 21). Kontush A: HDL particle number and size as predictors of cardiovascular disease. Front Pharmacol, 2015; 6: 218. [DOI] [PMC free article] [PubMed] [Google Scholar]
- 22). Camont L, Lhomme M, Rached F, Le Goff W, Negre-Salvayre A, Salvare R, Calzada C, Lagarde M, Chapman MJ, Kontush A: Small, dense high-density lipoprotein-3 particles are enriched in negatively charged phospholipids: relevance to cellular cholesterol efflux, antioxidative, antithrombotic, anti-inflammatory, and antiapoptotic functionalities. Arterioscler Thromb Vasc Biol, 2013; 33: 2715-2723 [DOI] [PubMed] [Google Scholar]
- 23). Mineo C, Deguchi H, Griffin JH, Shaul PW: Endothelial and antithrombotic actions of HDL. Circ Res, 2006; 98: 1352-1364 [DOI] [PubMed] [Google Scholar]
- 24). Kratzer A, Giral H, Landmesser U: High-density lipoproteins as modulators of endothelial cell functions: alterations in patients with coronary artery disease. Cardiovasc Res, 2014; 103: 350-361 [DOI] [PubMed] [Google Scholar]
- 25). Schofield I, Malik R, Izzard A, Austin C, Heagerty A: Vascular structural and functional changes in type 2 diabetes mellitus: evidence for the roles of abnormal myogenic responsiveness and dyslipidemia. Circulation, 2002; 106: 3037-3043 [DOI] [PubMed] [Google Scholar]
- 26). Jones GT, van Rij AM, Cole J, Williams MJ, Bateman EH, Marcovina SM, Deng M, McCormick SP: Plasma lipoprotein(a) indicates risk for 4 distinct forms of vascular disease. Clin Chem, 2007; 53: 679-685 [DOI] [PubMed] [Google Scholar]
- 27). Hiramitsu S, Miyagishima K, Ishii J, Matsui S, Naruse H, Shiino K, Kitagawa F, Ozaki Y: Effect of ezetimibe on lipid and glucose metabolism after a fat and glucose load. J Cardiol, 2012; 60: 395-400 [DOI] [PubMed] [Google Scholar]
- 28). Masuda D, Nakagawa-Toyama Y, Nakatani K, Inagaki M, Tsubakio-Yamamoto K, Sandoval JC, Ohama T, Nishida M, Ishigami M, Yamashita S: Ezetimibe improves postprandial hyperlipidaemia in patients with type IIb hyperlipidaemia. Eur J Clin Invest, 2009; 39: 689-698 [DOI] [PubMed] [Google Scholar]
- 29). Yunoki K, Nakamura K, Miyoshi T, Enko K, Kohno K, Morita H, Kusano KF, Ito H: Ezetimibe improves postprandial hyperlipemia and its induced endothelial dysfunction. Atherosclerosis, 2011; 217: 486-491 [DOI] [PubMed] [Google Scholar]
- 30). Moriyama K, Takahashi E: Non-HDL Cholesterol is a More Superior Predictor of Small-Dense LDL Cholesterol than LDL Cholesterol in Japanese Subjects with TG Levels < 400 mg/dL. J Atheroscler Thromb, 2016; 23: 1126-1137 [DOI] [PMC free article] [PubMed] [Google Scholar]
- 31). Kuwabara K, Harada S, Sugiyama D, kurihara A, Kubota Y, Higashiyama A, Hirata T, Nishida Y, Kawasaki M, Takebayashi T, Okamura T: Relationship between Non-High-Density Lipoprotein Cholesterol and Low-Density Lipoprotein Cholesterol in the General Population. J Atheroscler Thromb, 2016; 23: 477-490 [DOI] [PubMed] [Google Scholar]
- 32). Furuta M, Ueyama M, Morita S, Yamana A, Sanke T: Combined examination of glyceryl trinitrate-mediated vascular dilation with flow-mediated vascular dilation is essential for assessment of vascular function in type 2 diabetes . J Diabetes Investig, 2013; 4: 304-309 [DOI] [PMC free article] [PubMed] [Google Scholar]