

Abstract
Thorough QT/QTc studies have become an integral part of early drug development programs, with major clinical and regulatory implications. This analysis expands on existing pharmacodynamic models of QT interval analysis by incorporating the influence of glycemic changes on the QT interval in a semimechanistic manner. A total of 21 healthy subjects enrolled in an open‐label phase 1 pilot study and provided continuous electrocardiogram monitoring and plasma glucose and insulin concentrations associated with a 24‐hour baseline assessment. The data revealed a transient decrease in QTc, with peak suppression occurring approximately 3 hours after the meal. A semimechanistic modeling approach was applied to evaluate temporal delays between meals and subsequent changes that might influence QT measurements. The food effect was incorporated into a model of heart rate dynamics, and additional delayed effects of the meal on QT were incorporated using a glucose‐dependent hypothetical transit compartment. The final model helps to provide a foundation for the future design and analysis of QT studies that may be confounded by meals. This study has significant implications for QT study assessment following a meal or when a cohort is receiving a medication that influences postprandial glucose concentrations.
Keywords: QT interval, glucose, heart rate, mathematical modeling
Thorough QT/QTc (TQT) studies, which evaluate the potential for drug‐related proarrhythmic risk, have become an integral part of early drug development programs, with major clinical and regulatory implications.1, 2, 3 These studies may be challenging to conduct, and there are many potential confounders4 including food intake,5 activity, heart rate (HR), and autonomic perturbations, which can result in physiological perturbations that contribute to substantial experimental variability. Hence, these factors must be considered during final study design and the interpretation of QT interval measurements.4, 5, 6
The design of a TQT study, including the timing and collection of electrocardiograms (ECGs), should be guided by the available pharmacokinetic (PK) properties of the drug under investigation. Peak serum concentrations may not correspond to peak changes in QT, and knowledge of the PK permits the assessment of drug effects on QT interval during specific temporal windows within a dosing interval.1, 7 However, timing and design considerations for assessing concentration–QT effect relationships while seeking to avoid the influence of intrinsic QT interval confounders (eg, food, autonomic tone, HR, and diurnal variation) may become further complicated for compounds with long apparent circulating half‐lives.
Changes in glucose and insulin may influence cardiac repolarization through multiple mechanisms, including glucose flux into cells, adrenergic alterations, and changes in intracellular potassium concentrations.8, 9, 10 Food consumption can increase HR by up to 10 beats per minute (bpm), with a peak occurring 30 to 60 minutes following a meal,11, 12, 13 and such an increase in HR results in a shortening of the QT interval. Taubel and colleagues demonstrated a clear trend toward a shortened HR‐corrected QT (or QTc) interval 2 to 3 hours after a meal, illustrating that correcting for HR alone does not remove the influence of food on the QT interval.6 Hence, additional factors need to be considered.
Integrated PK/pharmacodynamic (PD) models for QT have been developed to improve quantitative understanding of drug‐ and system‐specific factors that influence QT intervals.2, 5, 7, 14, 15 Most models use the observed HR and evaluate the effects of subject characteristics on the QT interval. Likewise, the dynamics of glycemic regulation have been extensively studied, and whereas the application of PK/PD modeling in glucose homeostasis has been well documented, the impact of glucose changes and food intake on the QT interval is not well understood.16 Traditional PK/PD models of QT are often based on a linear relationship and an underlying assumption of a direct effect between HR and QT. In the present study, QT and metabolic data were collected during the baseline day of a phase 1 study conducted to evaluate design elements for a TQT study for an antidiabetic agent. Here, we expand on existing PD models of QT interval analysis by incorporating the influence of glycemic changes on the QT interval in a semimechanistic manner. The final model may provide a foundation for the future design and analysis of QT studies that may be confounded by meals or compounds that alter glucose homeostasis.
Methods
Subjects
This study was conducted in accordance with the principles described in the Declaration of Helsinki (1946) up to and including the Seoul revision.17 The clinical protocol was approved by an institutional review board, and all subjects provided written informed consent prior to participation. A total of 21 healthy subjects (20 men, 1 woman) were enrolled in this open‐label phase 1 pilot study. One subject was removed because of an abnormal postprandial glucose profile.
Study Design
A series of subject cohorts was used with a flexible design that allowed sequential modification of design parameters (eg, meal timing) to achieve relatively stable response variables (eg, HR and metabolic biomarkers). Eligible subjects abstained from all medications, were allocated to 1 of 3 cohorts (A, n = 6; B, n = 6; and C, n = 9), and were admitted to an inpatient clinic for 24 hours of baseline assessments. The baseline day began at 8 pm and included 24 hours of subject observations that included standardized meals (breakfast and lunch), continuous ECG monitoring, and response assessments. The amylin standard meal consisted of a daily diet that comprised approximately 60% carbohydrates, 15% protein, and 25% fat. To focus on the influence of meal‐related glycemic changes on HR and the QT interval, only assessments from the 24‐hour baseline period were included in this evaluation (breakfast and lunch).
Subjects received a standardized 2500‐calorie (kcal)/day diet, with breakfast at 7 am (cohort A) or 6 am (cohorts B and C) and lunch at 2 pm (following the primary ECG assessment window). The site dietitian recorded the specific macronutrient content of each meal, and the amount of carbohydrates was used as a marker of the apparent glucose dose. The grams (% of calories) of carbohydrates that were provided at breakfast were 81 g (67.0%), 86 g (51.2%), and 99 g (84.6%) for cohorts A, B, and C, respectively. The amount of carbohydrates provided for lunch was 190 g (74.5%), 144 g (55.7%), and 104 g (54.6%) for the respective cohorts. The site nurse recorded the approximate amount of the meal consumed as 0, 25, 50, 75, or 100%. The amount of carbohydrates was then adjusted for the percentage of the meal consumed, assuming that the amount was evenly consumed across the different macronutrients. The number of subjects consuming 50, 75, and 100% of their breakfast meal was 1 (5%), 8 (40%), and 11 (55%), respectively. For lunch, the majority of subjects (95%) consumed 100% of their meal.
PD Assessments
Twenty‐four‐hour continuous ECG monitoring was conducted with 12‐lead H‐12 Holter monitors. Baseline ECGs were extracted hourly, except during the breakfast window (30‐minute collection intervals), for a total of 26 HR and QT measurements. ECG measurements were made prior to any other assessments at each time (eg, vital signs and blood draws). Cardiologists at the central ECG laboratory (Cardio Analytics, Plymouth, UK) performed all ECG measurements in a fully blinded fashion. ECG intervals were measured in 3 beats in lead II in each extracted ECG replicate using a semiautomated approach. For the purposes of modeling, the average HR and QT for the 3 beats provided by the vendor were used. Plasma glucose and serum insulin were measured at 14 baseline points.
Analytical Procedures
Measurements of glucose and insulin concentrations were conducted at the Covance Clinical Research Unit (Evansville, Indiana). Glucose concentrations were assayed using the glucose oxidase method on a Beckman Coulter UniCel 600 instrument. Total imprecision (coefficient of variation [CV%]) of the assay was 3.9% at 43.7 mg/dL and 1.2% at 397 mg/dL of glucose. Serum insulin concentrations were quantified on a Siemens ADVIA Centaur instrument using a 2‐site sandwich immunoassay and direct chemiluminescence for signal detection. Total method imprecision ranged from 7.5% (CV%) at 14.7 mU/L to 6.3% at 125 mU/L of insulin.
PD Modeling
All modeling and simulations were conducted using the first‐order conditional method with interaction in NONMEM VI software (ICON, Hanover, Maryland). Initial modeling focused on the rich sampling time frame around the breakfast meal (6 am to 2 pm). The model was subsequently expanded to the full 24 hours, including evaluation of multiple meals and diurnal variation. For both the breakfast window and the full 24 hours, a sequential modeling approach was used in which glucose profiles alone were first characterized. Individual Bayesian parameter estimates for the glucose components were then fixed in the development of the remainder of the model. Model adequacy was assessed by parameter precision, graphical assessments, and evaluation of predictive performance through visual predictive checks (VPCs). The VPC was performed by evaluating the median and 90% prediction interval of 1000 simulations from the model in comparison with the observed data.
Structural Model for Breakfast Window
Given the documented hysteresis between glucose and insulin,16, 18 as well as observed delays between glucose and HR, initial model structures incorporated a series of indirect response models19 for the relationships between these PD end points. The 30‐minute interval sampling strategy implemented around the breakfast meal resulted in glucose‐insulin profiles that did not exhibit hysteresis (Supplemental Figures S1–S3). Attempts to fix components of a glucose‐insulin feedback model16, 18 resulted in model instability (ie, failure to minimize or unrealistic parameter estimates). Thus, the model was simplified to use glucose alone as the glycemic marker for this system.
The final PD model is shown in Figure 1. Plasma glucose concentration (Glu) was best described by a 1‐compartment model with a zero‐order production rate constant for endogenous glucose (kin_glu) and first‐order rate constants for exogenous glucose absorption (from meals; ka_glu) and total glucose elimination (kout_glu):
| (1) |
Figure 1.
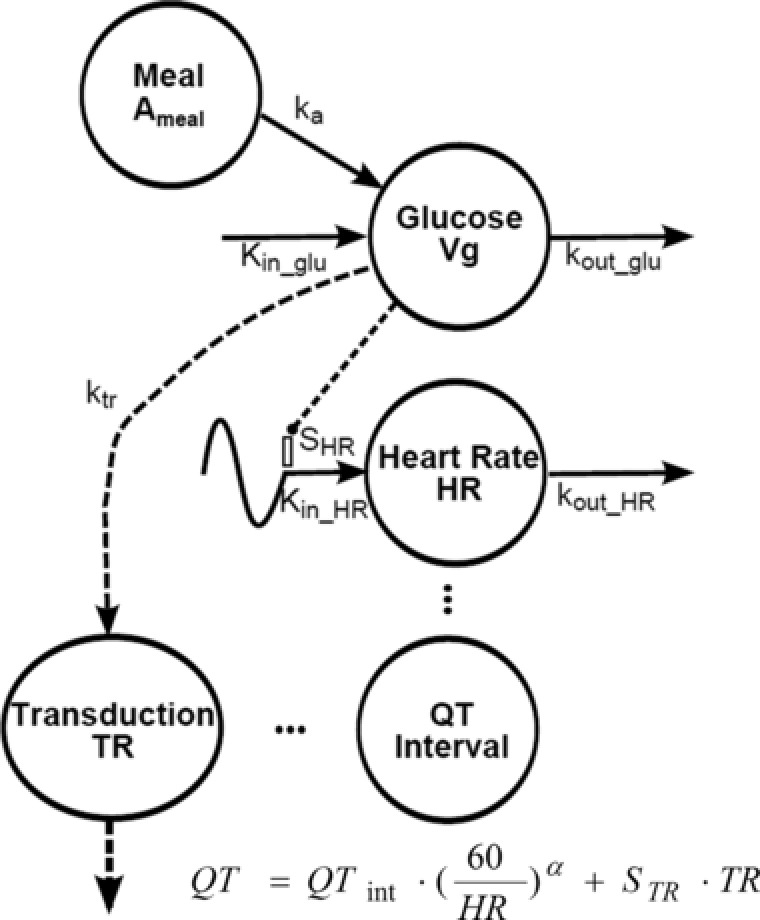
Model diagram of food and glycemic effects on the QT interval. Symbols and model equations are defined in Pharmacodynamic Modeling in the Methods section.
The system was assumed to be at steady state, such that , with Glu ss as the steady‐state glucose concentration. The initial conditions for glucose (Glu0) were set to the individual measured values at the 6 am time. Data collected during the absorption of glucose following breakfast was sparse and uninformative; hence, ka_glu was fixed to 1.72 h‐1.20 Subsequently, the effects on HR and QT were incorporated into the model, and the relationship between glucose and HR was best described by an indirect response model,19 with a zero‐order input rate constant (Kin_HR), stimulated by changes in glucose concentration and a first‐order loss (kout_HR):
| (2) |
where SHR is a stimulatory coefficient. The zero‐order input rate constant is defined as:
| (3) |
where BASEHR is the baseline or steady‐state value.
Diagnostic plots of the QT‐versus‐RR patterns did not reveal hysteresis; thus, the relationship between QT and HR was coded using a traditional direct‐effect relationship:
| (4) |
| (5) |
where HRij is the individual predicted HR for the ith subject at the jth measurement time, RRij is the individual predicted RR interval for the ith subject at the jth measurement, QTinti is a parameter for the intercept of the QT versus RR relationship for the ith subject, QTij is the observed or predicted QT interval for the ith subject at the jth point, and RVQTij is normal residual error. An estimate of the individual model‐predicted HR‐corrected QT interval (mQTcij) was obtained by rearranging equation 4:
| (6) |
Graphical displays of mQTcij versus RR were evaluated. Ingesting a meal may also impact the QT interval beyond its influence on HR.6 Additional effects of the meal on QT were evaluated using glucose signaling via a hypothetical transit compartment to account for distributional and/or transduction delays (TR), with ktr as a first‐order rate constant for signal delay and STR as a proportionality constant for additional delay of QT:
| (7) |
The model output for HR and glucose‐corrected QT was defined as:
| (8a) |
with
| (8b) |
The initial conditions for glucose (Glu0) and HR (HR0) were set to the individual measured values at time zero (6 am), and the initial conditions for the transduction compartment (equation 7) were set to 0.
Extended 24‐Hour Model
Expansion of the model to the 24‐hour window required the incorporation of circadian variation within the system. Several model‐based studies have included a time‐variant effect using multiple cosine functions.5, 21, 22 Plasma samples were not collected while subjects slept; therefore, a circadian rhythm on glucose could not be evaluated. The HR and QT data across the full 24‐hour period were obtained, and the effects of the diurnal variation were incorporated on the HR production rate by modifying equation 2:
| (9) |
The use of single, double, and triple cosine functions was evaluated5:
| (10) |
where CIRC estimates the circadian rhythm in HR with parameters AMP 1, AMP 2, and AMP 3 as the population mean amplitudes and ph 1, ph 2, and ph 3 as the acrophase parameters. Time is referenced to the start of the baseline day (0–24 hours). The optimal number of harmonics was selected based on parameter precision, model stability, and the objective function.
Interindividual and Residual Error Models
Interindividual variability (IIV) was evaluated using a log‐normal distribution model. The residual variability was estimated separately for each end point (glucose, HR, and QT) using a proportional error model. Alternative structures were evaluated but did not improve model performance.
Results
Baseline Subject PD and Demographics
The study population (n = 20) was primarily male (95%) and white (85%), with mean ± standard deviation age and weight of 40.0 ± 12.4 years and 91.2 ± 12.1 kg, respectively. Demographic and baseline characteristics were evenly distributed among the cohorts, with the exception of a lower mean age in cohort B and a lower mean body weight in cohort C. The one female subject participated in cohort A.
Initial data exploration included QTc calculated by Fridericia's method (QTcF)23 to evaluate changes in QTc in addition to uncorrected QT values. Exploratory displays of PD end points across time highlight the diurnal variation within HR and QT (Supplemental Figure S4). Although prior studies have identified a diurnal variation in glucose and insulin,22 the sample collection strategy limited the ability to distinguish this from fluctuations because of meal consumption (clock time, 6–8 am and 2 pm). Figure 2 shows the time course of the median HR, insulin and glucose concentrations, and uncorrected QT and QTcF intervals around the breakfast window (6 am to 2 pm), illustrating the impact of moving the breakfast meal by 1 hour. Peak glucose and insulin concentrations occurred approximately 1 hour after the meal. A change in HR of about 10 bpm was observed following the meal, with the peak in HR occurring approximately 2 hours after the meal or about 1 hour after peak glucose and insulin responses. In addition, a transient decrease in QTcF was observed, with the peak suppression occurring approximately 3 hours after the meal. Movement of the meal 1 hour earlier (cohorts B and C) showed similar relationships, albeit shifted in time, and supports the interdependencies between the system components.
Figure 2.
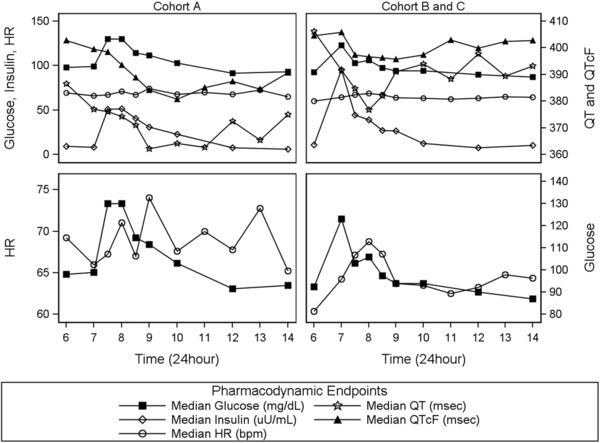
Temporal profiles of median pharmacodynamic end points. Column labels (cohorts A, B, and C) indicate the study group. Symbols indicate data points from the measured response end points: glucose (solid squares), insulin (open diamonds), HR (open circles), QT (open stars), and QTcF (solid triangles). Each row is served by dual y axes to facilitate comparison of data across study groups. The breakfast meal was provided at 7 am for cohort A and at 6 am for cohorts B and C. HR, heart rate; QTcF, QT corrected by Fridericia's method.
PD Modeling: Breakfast Window
Model development began with characterization of glucose following the breakfast meal, and Bayesian parameter estimates for the glucose model components were fixed thereafter. The influence of glucose was incorporated into the system as stimulation of the zero‐order production rate of HR (Figure 1; equation 9). Diagnostic plots of mQTc versus glucose revealed additional hysteresis, with suppression of mQTc approximately 3 hours postmeal (data not shown). The additional influence of a transit compartment (ie, signal transduction) on QT statistically improved model performance. Multiple transit compartments were evaluated; however, 1 compartment was optimal, with an estimated ktr of 0.120 h‐1. All parameters were estimated well, with the exception of the IIV in the stimulation of HR by glucose (SHR), which was estimated with a standard error of 62.4% CV (Table 1). Removal of this parameter resulted in an increase in the objective function as well as a decrease in the precision of other model parameters. The final model included IIV parameters for kout_glu, baseline HR, kout_HR, and the intercept for the QT‐versus‐RR correlation (Table 1). Individual observed data and model predictions for 2 representative subjects during the breakfast window are shown in Figure 3A,B. Figure 4 (top) shows the VPC for the breakfast window, suggesting that the model adequately describes the glucose, HR, and QT data on a population level. Although the model adequately describes the time‐course and majority of changes in HR observed following a meal, there is a slight underprediction of the peak change in HR.
Table 1.
Final Estimated Parameters for QT Interval Models in Healthy Volunteers
| Breakfast Window | 24‐Hour Window | |||||||
|---|---|---|---|---|---|---|---|---|
| Parameter | Parameter Estimate | RSE% | IIV (%) | RSE% | Parameter Estimate | RSE% | IIV (%) | RSE% |
| Vg (dL) | 781 | 20.6 | — | —‐ | 653 | 22.5 | — | — |
| kout_glu (1/h) | 1.52 | 24.5 | 40.5 | 36.9 | 1.94 | 22.3 | 28 | 36.9 |
| ka_glu (1/h) | 1.72 | NE | — | — | 1.72 | NE | — | — |
| Gluss (mg/dL) | 90 | 1.83 | — | — | 92.8 | 1.35 | — | — |
| RV glucose (%CV) | 9.18 | 12.7 | — | — | 11 | 11.8 | — | — |
| kout_HR (1/days) | 7.51 | 33.5 | 113 | 36.3 | 14.3 | 26.2 | 75.7 | 40 |
| HRss (bpm) | 64.3 | 2.67 | 8.62 | 33.9 | 64.1 | 2.2 | 9.2 | 39.8 |
| SHR ([mg/dL]‐1) | 0.00407 | 25.5 | — | — | 0.00103 | 80 | 140.4 | 77.2 |
| QTint (ms) | 406 | 0.68 | 2.85 | 44.6 | 409 | 0.7 | 2.77 | 35.1 |
| α | 0.362 | 10.3 | — | — | 0.425 | 7.76 | — | — |
| AMP1 (1/bpm) | — | — | — | — | 0.062 | 13.6 | — | — |
| ph1 (h) | — | – | — | — | 17.3 | 3.64 | — | — |
| AMP2 (1/bpm) | — | — | — | — | 0.039 | 21.3 | — | — |
| ph2 (h) | — | — | — | — | 10.7 | 5.51 | — | — |
| STR (ms/[mg/dL]) | ‐1.27 | 42.8 | — | — | ‐1.27 | NE | — | — |
| ktr (1/h) | 0.12 | 62.5 | — | — | 0.12 | NE | — | — |
| RV glucose (%CV) | 8.78 | 11.8 | — | — | 11.3 | 14.9 | — | — |
| RV HR (%CV) | 7 | 18.1 | — | — | 7.96 | 11.2 | — | — |
| RV QT (%CV) | 2.48 | 19.8 | — | — | 3.01 | 12.4 | — | — |
α, QT‐RR correction factor; AMP1 and AMP2, amplitudes for the circadian variation; bpm, beats per minute; CV, coefficient of variation; Gluss, steady‐state glucose concentration; HR, heart rate; HRss, steady‐state heart rate; IIV, interindividual variability; ka_glu, first‐order exogenous glucose absorption rate; kout_glu, glucose disposition; kout_HR, first‐order loss of HR; ktr, first‐order rate constant for signal delay; NE, not estimated; ph1 and ph2, acrophase parameters; QTint, intercept for the QT‐RR relationship; RSE%, relative standard error; SHR, stimulatory coefficient for HR by changes in glucose; STR, slope for additional delay of QT; Vg, volume of glucose.
Figure 3.
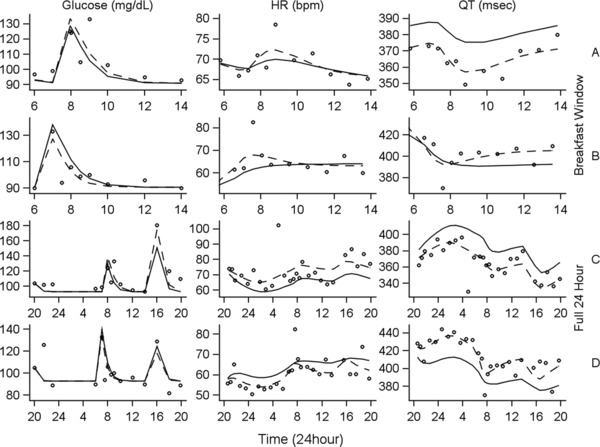
Comparison of observed measurements with population and individual fitted curves for 2 representative subjects. Column labels (glucose, HR, and QT) indicate the measured pharmacodynamic end point. Row labels indicate both the time window of interest (breakfast window [top 2 rows], full 24‐hour [bottom 2 rows]) and the identifier for the 2 representative subjects (A [rows 1 and 3], B [rows 2 and 4]). Observed measurements are represented by open circles. Population‐fitted curves are represented by solid lines, and individual‐fitted curves are represented by dashed lines. HR, heart rate.
Figure 4.

VPC for the breakfast window and full 24‐hour models. Column labels (glucose, HR, and QT) indicate the measured response variable. The top row shows the VPCs for the breakfast window period, and the bottom row corresponds with the full 24‐hour period. Symbols represent individual observed data, and dashed lines are the 5th, 50th, and 95th percentiles of the observed data. Solid lines are medians of the simulations, and shaded areas define the 5th–95th percentiles of 1000 simulations. VPC, visual predictive check.
PD Modeling: 24‐Hour Model
Given that the 24‐hour baseline only contained sparse information for 1 additional meal (lunch), the parameters related to the additional shortening of QT in response to the meal (ktr and slope) were fixed to the estimates obtained during the breakfast window evaluation to avoid potential biases when characterizing the diurnal variation.
During model development, single, dual, and triple cosine functions were evaluated (equation 10), and the inclusion of 2 cosine functions was found to optimally describe the circadian rhythm in HR. The final 24‐hour model included IIV parameters for kout_Glu, baseline HR, kout,HR, the intercept for the QT‐versus‐RR correlation, and the IIV for glucose stimulation of HR. All parameters were estimated with less than 42% CV, with the exception of the stimulation of HR production by glucose (58.4% CV) and the IIV for this parameter (62.4% CV); see Table 1. Figure 3C,D shows the model predictions for the same 2 representative subjects as those shown for the breakfast window. The final model described well the change in glucose following both the breakfast and lunch meals, as well as the diurnal variation within the HR and QT data. The VPCs (Figure 4, bottom) show good agreement of the simulated 90% confidence intervals (CIs; shaded regions) and the simulated median values (solid lines) with the observed data (symbols and dashed lines).
Simulations using the final parameter estimates were conducted to evaluate the influence of a single meal (breakfast) against the backdrop of diurnal HR variation. A total of 500 subjects were simulated, with each subject compared under alternate 24‐hour fed‐versus‐fasted scenarios. The fed scenario began at 8 pm with an 11‐hour fasting period, followed by a 99‐g carbohydrate breakfast at 7 am. The fasted scenario was a full 24‐hour period without food. The resulting mean HR data under fasted conditions (Figure 5A,B) allows examination of the diurnal variation in HR, unconfounded by the effect of meal ingestion and as anticipated, smaller fluctuations in HR occur during the day relative to the night hours.24 Evaluation of the mean HR under fed conditions shows the incremental effect of meal ingestion over the effect of diurnal variation. Although the estimated magnitude of this effect may be influenced by both the diurnal variation and the meal consumption, an incremental increase because of the meal was required to fit the data and capture the influence of the meal. The predicted maximum mean (95%CI) change in glucose was 52.2 mg/dL (50.6–53.7 mg/dL) 30 minutes postmeal. The maximum mean (95%CI) change in HR of 6.8 bpm (6.0–7.6 bpm) occurred 1.5 hours postmeal. The predicted maximum change in uncorrected QT with the 24‐hour model was a decrease of 24 milliseconds (22.4–25.5 milliseconds) occurring 2 hours after the meal, consistent with published results showing a shortened uncorrected QT of 27 milliseconds occurring 1.5 hours after a meal.6
Figure 5.
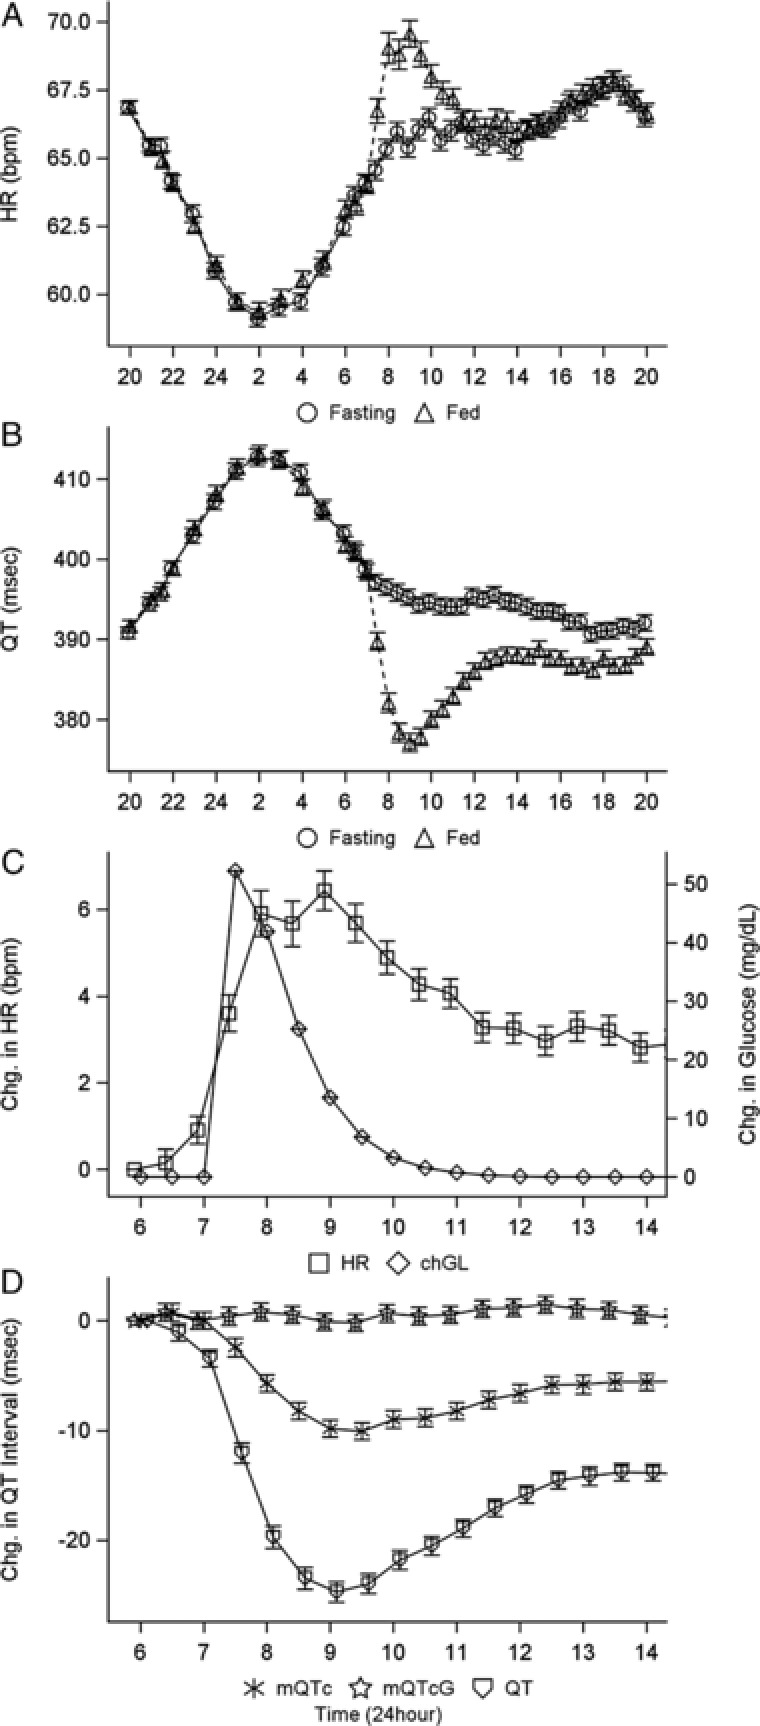
Model‐predicted mean (SE) profiles of (A) heart rate, (B) uncorrected QT for a 24‐hour day, (C) change in heart rate and glucose (QT) for the breakfast window, and (D) change in uncorrected and corrected QT. For A and B, open circles represent fasting conditions, and open triangles represent fed conditions. Symbols and error bars represent the mean and SE of 500 simulated profiles. chGL, change in glucose; mQTcG, heart rate and glucose‐corrected QT; QTc, heart rate–corrected QT; SE, standard error.
Simulations of the breakfast time frame of the 24‐hour profile (Figure 5C,D) show a suppression of 24 milliseconds approximately 2.5 hours after the meal was observed with the uncorrected QT. Correction for HR (mQTc) partially accounts for the observed suppression; however, a suppression of 10 milliseconds remains. The additional correction for glucose via the signal transduction delay (mQTcG, open stars in Figure 5D) further accounts for all remaining meal effects, and no remaining change in mQTcG was observed across time.
Discussion
Accurate interpretation of QT data is essential for assessing the risk of arrhythmia associated with a new therapy, which in turn affects regulatory decisions. The objective of this study was to quantify the influence of glucose on HR and QT following a single meal and across a 24‐hour period. Given the inherent complexities in glucose–QT relationships, a semimechanistic approach was applied to evaluate temporal delays between meals and subsequent changes in hemodynamics that might influence QT assessment. Although plasma glucose concentrations may have peaked approximately 1 hour after a meal and returned to baseline, our final model tracked the peak change in the QT interval that occurred with a time lag of 2–3 hours after a meal, which is sufficient to potentially influence the assessments of QT studies. The food effect remained even after implementation of HR correction methodologies and appeared to be unassociated with direct changes in HR. It is recognized that other physiological changes (eg, possibly autonomic perturbations) take place after a meal and that those specific variables were not accounted for within this analysis.25 Nevertheless, the model performed well in capturing the QT and has significant implications for QT study assessment following a meal or when a cohort is receiving a medication that influences postprandial glucose concentrations.
The sampling strategy and nature of the data collected in this study precluded the simultaneous modeling of glucose and insulin with traditional interacting compartments. Attempts to fix an insulin model and associated parameters to previously published values18 were unsuccessful (data not shown). Given the lack of hysteresis in glucose‐insulin profiles and the goal of assessing food consumption on QT, glucose profiles were selected as the glycemic biomarker for the food effect. The apparent dose of glucose was considered equal to the apparent amount of carbohydrates consumed. The estimate for the elimination rate of glucose (1.52 h‐1) was consistent with several values reported in the literature.16, 18, 22
In contrast to traditional QT models, HR dynamics were modeled using an indirect response approach. This provided a temporal and structural framework for describing the known influence of glucose on HR and the subsequent effect on QT. The influence of the change in glucose on HR was incorporated as a linear stimulation to HR (equations 4 and 5). Saturable or capacity‐limited models were also evaluated; however, the limited range of changes in glucose in this healthy population did not support such a model and suggested overparameterization. In addition, the data collected within this clinical trial was primarily from male patients. Although the baseline QTc is somewhat different in males and females, QTc prolongation in response to a drug in TQT studies is similar when exposure is comparable. Thus, whereas no differences owing to the meal were anticipated between male and female subjects, the data collected within this trial prohibit the evaluation of sex differences.
Additional effects of a meal on QT were observed after correcting for changes in HR, which is consistent with other clinical studies.6 This may be a consequence of several mechanisms, including autonomic tone, glucose shifts into cells, C‐peptide, and cardiac output changes in response to food intake.6, 26, 27 It is important to note that the meal comprised multiple macronutrients (glucose, lipid, proteins, and fat), each of which could contribute to the delays observed in the meal effects on QT. The objective of this study was to inform the design of a QT study for an antiglycemic agent.28, 29 Thus, our analysis used the change in glucose as a surrogate marker for signaling events that initiate these additional effects by including a transit compartment for the delay between change in glucose and the QT interval. This model is simplified, as knowledge of the exact mechanisms for this additional effect on QT is incomplete, including the specific contribution of each macronutrient, and the model may be expanded as further details are identified.
The extended sampling for the 24‐hour baseline period showed an obvious diurnal variation. HR variability analysis suggested that daytime is associated with relative sympathetic dominance, whereas nighttime is dominated by parasympathetic or vagal tone.30, 31, 32, 33 Although models have been developed that include up to 3 harmonics to mimic the diurnal variation,5, 34 our final model used 2 cosine functions to account for this effect on HR. The reduction in the number of harmonics might be attributed to the inclusion of the meal effect on HR. The extension to the 24‐hour period and incorporation of diurnal variation resulted in altered model parameters compared with the breakfast window alone, with an increase in the mean first‐order loss rate constant (kout_HR) from 7.51 to 14.8 days‐1 and a decrease in the IIV on this parameter by 39%. In addition, the coefficient parameter for the stimulation of HR by glucose decreased from 0.004 to 0.0011 mg/dL/ms and was estimated with less precision. The parameters associated with the diurnal variation in the 24‐hour model also include estimated acrophase times similar to previous estimates5 but offset from the meal times. Simulations of subjects with and without breakfast at 7 am show that the mean peak change in HR following a meal occurred 1.5 hours after food consumption. Within the same daily time frame, the maximum change in HR because of diurnal variation alone (no meal) was predicted to occur at 9:30 am. This illustrates the ability of the model to distinguish the influence of diurnal variation and meal consumption.
The model estimated a mean change in HR of approximately 7 bpm 1.5 hours after a meal, with a subsequent maximum change in QT of ‐24.0 milliseconds 2 hours postmeal. Although the predicted temporal profiles for HR and QT are similar to published data,6 the predicted return to baseline values of mQTc was slower in the current analysis. Differences could be because of the small number of subjects and different experimental conditions, such as the macronutrient contents, the number of meals consumed, and the timing of the lunch meal in relationship to breakfast. These findings may have important implications for TQT studies. According to the International Council for Harmonisation (ICH) E14 guidelines, the upper bound of the 2‐sided 90%CI at each time is evaluated to rule out a difference in change from baseline QTc between the investigational drug and placebo of greater than 10 milliseconds.1, 35 For therapeutic agents that do not alter glycemic conditions, traditional baseline QT correction is likely adequate because both the baseline and treatment arms are affected equally by the meal. However, for antiglycemic agents, especially those that lower postprandial hyperglycemia, the application of traditional baseline correction approaches may produce confounded results, as they do not account for the inherent drug‐induced changes in glucose. This analysis and that of Taubel and colleagues6 show that an additional effect of a meal on QTc could be greater than 5 milliseconds, which is large enough to produce false‐positives within a TQT study (using the ICH E14 central tendency definition).1, 35, 36 Thus, consideration of timing of meals and/or additional QT corrections for glucose may be critically important.
The meal effects on QT may be even more important for drugs with long elimination half‐lives, and a parallel‐group design has been recommended for these agents.37 A limitation of the parallel QT design is that each subject cannot serve as his/her own control. In addition, the time lag between HR, glucose changes, and QT alterations can be misinterpreted as being direct drug effects if comparable subject characteristics are not matched in the placebo group.
Conclusions
This study underscores the importance of carefully controlling food composition and recording intake for consistency across subjects during a TQT study. Simulations suggest an additional QTc suppression of approximately 9 milliseconds, 2–3 hours postmeal, and that primary QT assessments 7–8 hours after a meal would be sufficient to avoid any significant food effects. Alternatively, PK/PD models that incorporate the effects of glucose on this system could be used to evaluate the influence of a drug effect on QT while simultaneously accounting for potential factors that influence HR and/or glucose.
Supporting information
Supplementry Information
Acknowledgments
The authors thank the exenatide development team and Amylin Pharmaceuticals for its support of this analysis. The authors thank Demiana Faltaos, Carl LaCerte, Matt Zierhut, and Dave Clawson for their insights and contributions; Malcolm Mitchell for his clinical perspectives and insight during the planning for the analysis; and Frank LaCreta for his scientific and editorial support of this article. In addition, we thank inScience Communications, Springer Healthcare (Philadelphia, Pennsylvania) for providing editorial support for submission and AstraZeneca for funding this support.
Declaration of Conflicting Interests
Brenda Cirincione is an employee of Bristol‐Myers Squibb Company. Philip T. Sager served in the past as a consultant to Amylin Pharmaceuticals Inc. Donald E. Mager declares no conflicts of interest.
Funding
This analysis was supported by Amylin Pharmaceuticals Inc. and Bristol‐Myers Squibb Company.
References
- 1. Guidance for Industry . E14 Clinical evaluation of QT/QTc interval prolongation and proarrhythmic potential for non‐antiarrhythmic drugs. Rockville, MD: US Food and Drug Administration; 2005. http://www.fda.gov/downloads/Drugs/GuidanceComplianceRegulatoryInformation/Guidances/ucm073153.pdf. Accessed October 17, 2014. [Google Scholar]
- 2. Garnett CE, Beasley N, Bhattaram VA, et al. Concentration‐QT relationships play a key role in the evaluation of proarrhythmic risk during regulatory review. J Clin Pharmacol. 2008;48(1):13–18. [DOI] [PubMed] [Google Scholar]
- 3. Malik M. Problems of heart rate correction in assessment of drug‐induced QT interval prolongation. J Cardiovasc Electrophysiol. 2001;12(4):411–420. [DOI] [PubMed] [Google Scholar]
- 4. Malik M, Garnett CE, Zhang J. Thorough QT studies: questions and quandaries. Drug Saf. 2010;33(1):1–14. [DOI] [PubMed] [Google Scholar]
- 5. Piotrovsky V. Pharmacokinetic‐pharmacodynamic modeling in the data analysis and interpretation of drug‐induced QT/QTc prolongation. AAPS J. 2005;7(3):E609–E624. [DOI] [PMC free article] [PubMed] [Google Scholar]
- 6. Taubel J, Wong AH, Naseem A, Ferber G, Camm AJ. Shortening of the QT interval after food can be used to demonstrate assay sensitivity in thorough QT studies. J Clin Pharmacol. 2012;52(10):1558–1565. [DOI] [PubMed] [Google Scholar]
- 7. Florian JA, Tornoe CW, Brundage R, Parekh A, Garnett CE. Population pharmacokinetic and concentration–QTc models for moxifloxacin: pooled analysis of 20 thorough QT studies. J Clin Pharmacol. 2011;51(8):1152–1162. [DOI] [PubMed] [Google Scholar]
- 8. Lee SP, Harris ND, Robinson RT, et al. Effect of atenolol on QTc interval lengthening during hypoglycaemia in type 1 diabetes. Diabetologia. 2005;48(7):1269–1272. [DOI] [PubMed] [Google Scholar]
- 9. Dekker JM, Feskens EJ, Schouten EG, Klootwijk P, Pool J, Kromhout D. QTc duration is associated with levels of insulin and glucose intolerance. The Zutphen Elderly Study. Diabetes. 1996;45(3):376–380. [DOI] [PubMed] [Google Scholar]
- 10. Gastaldelli A, Emdin M, Conforti F, Camastra S, Ferrannini E. Insulin prolongs the QTc interval in humans. Am J Physiol Regul Integr Comp Physiol. 2000;279(6):R2022–R2025. [DOI] [PubMed] [Google Scholar]
- 11. Goldstein RE, Redwood DR, Rosing DR, Beiser GD, Epstein SE. Alterations in the circulatory response to exercise following a meal and their relationship to postprandial angina pectoris. Circulation. 1971;44(1):90–100. [DOI] [PubMed] [Google Scholar]
- 12. Kelbaek H, Munck O, Christensen NJ, Godtfredsen J. Central haemodynamic changes after a meal. Br Heart J. 1989;61(6):506–509. [DOI] [PMC free article] [PubMed] [Google Scholar]
- 13. Sidery MB, Macdonald IA. The effect of meal size on the cardiovascular responses to food ingestion. Br J Nutr. 1994;71(6):835–848. [DOI] [PubMed] [Google Scholar]
- 14. Davis JD, Hackman F, Layton G, Higgins T, Sudworth D, Weissgerber G. Effect of single doses of maraviroc on the QT/QTc interval in healthy subjects. Br J Clin Pharmacol. 2008;65(Suppl 1):68–75. [DOI] [PMC free article] [PubMed] [Google Scholar]
- 15. Tornoe CW, Garnett CE, Wang Y, Florian J, Li M, Gobburu JV. Creation of a knowledge management system for QT analyses. J Clin Pharmacol. 2011;51(7):1035–1042. [DOI] [PubMed] [Google Scholar]
- 16. Landersdorfer CB, Jusko WJ. Pharmacokinetic/pharmacodynamic modelling in diabetes mellitus. Clin Pharmacokinet. 2008;47(7):417–448. [DOI] [PubMed] [Google Scholar]
- 17. World Medical Association declaration of Helsinki . Recommendations guiding physicians in biomedical research involving human subjects. JAMA. 1997;277(11):925–926. [PubMed] [Google Scholar]
- 18. Lima JJ, Matsushima N, Kissoon N, Wang J, Sylvester JE, Jusko WJ. Modeling the metabolic effects of terbutaline in beta2‐adrenergic receptor diplotypes. Clin Pharmacol Ther. 2004;76(1):27–37. [DOI] [PubMed] [Google Scholar]
- 19. Dayneka NL, Garg V, Jusko WJ. Comparison of four basic models of indirect pharmacodynamic responses. J Pharmacokinet Biopharm. 1993;21(4):457–478. [DOI] [PMC free article] [PubMed] [Google Scholar]
- 20. Jauslin PM, Silber HE, Frey N, et al. An integrated glucose‐insulin model to describe oral glucose tolerance test data in type 2 diabetics. J Clin Pharmacol. 2007;47(10):1244–1255. [DOI] [PubMed] [Google Scholar]
- 21. Chakraborty A, Krzyzanski W, Jusko WJ. Mathematical modeling of circadian cortisol concentrations using indirect response models: comparison of several methods. J Pharmacokinet Biopharm. 1999;27(1):23–43. [DOI] [PubMed] [Google Scholar]
- 22. Jauslin PM, Frey N, Karlsson MO. Modeling of 24‐hour glucose and insulin profiles of patients with type 2 diabetes. J Clin Pharmacol. 2011;51(2):153–164. [DOI] [PubMed] [Google Scholar]
- 23. Fridericia LS. The duration of systole in an electrocardiogram in normal humans and in patients with heart disease 1920. Ann Noninvasive Electrocardiol. 2003;8(4):343–351. [DOI] [PMC free article] [PubMed] [Google Scholar]
- 24. Ramaekers D, Ector H, Aubert AE, Rubens A, Van de Werf F. Heart rate variability and heart rate in healthy volunteers. Is the female autonomic nervous system cardioprotective? Eur Heart J. 1998;19(9):1334–1341. [DOI] [PubMed] [Google Scholar]
- 25. Hlebowicz J, Lindstedt S, Bjorgell O, Dencker M. The effect of endogenously released glucose, insulin, glucagon‐like peptide 1, ghrelin on cardiac output, heart rate, stroke volume, and blood pressure. Cardiovasc Ultrasound. 2011;9:43. [DOI] [PMC free article] [PubMed] [Google Scholar]
- 26. Taubel J, Lorch U, Ferber G, et al. Insulin at normal physiological levels does not prolong QT(c) interval in thorough QT studies performed in healthy volunteers. Br J Clin Pharmacol. 2013;75(2):392–403. [DOI] [PMC free article] [PubMed] [Google Scholar]
- 27. Taubel J, Ferber G, Lorch U, Batchvarov V, Savelieva I, Camm AJ. Thorough QT study of the effect of oral moxifloxacin on QTc interval in the fed and fasted state in healthy Japanese and Caucasian subjects. Br J Clin Pharmacol. 2014;77(1):170–179. [DOI] [PMC free article] [PubMed] [Google Scholar]
- 28. Darpö B, Sager P, MacConell L, et al. Exenatide at therapeutic and supratherapeutic concentrations does not prolong the QTc interval in healthy subjects. Br J Clin Pharmacol. 2013;75(4):979–989. [DOI] [PMC free article] [PubMed] [Google Scholar]
- 29. Cirincione B, LaCreta F, Sager P, Mager DE. Model‐based evaluation of exenatide effects on the QT interval in healthy subjects following continuous IV infusion. J Clin Pharmacol. 2017;57(8):956–965. [DOI] [PMC free article] [PubMed] [Google Scholar]
- 30. Furlan R, Guzzetti S, Crivellaro W, et al. Continuous 24‐hour assessment of the neural regulation of systemic arterial pressure and RR variabilities in ambulant subjects. Circulation. 1990;81(2):537–547. [DOI] [PubMed] [Google Scholar]
- 31. Guo YF, Stein PK. Circadian rhythm in the cardiovascular system: considerations in non‐invasive electrophysiology. Card Electrophysiol Rev. 2002;6(3):267–272. [DOI] [PubMed] [Google Scholar]
- 32. Mancia G. Methods for assessing blood pressure values in humans. Hypertension. 1983;5(5 Pt 2):III5–III13. [DOI] [PubMed] [Google Scholar]
- 33. Parati G, Castiglioni P, Di Rienzo M, Omboni S, Pedotti A, Mancia G. Sequential spectral analysis of 24‐hour blood pressure and pulse interval in humans. Hypertension. 1990;16(4):414–421. [DOI] [PubMed] [Google Scholar]
- 34. Chenel M, Canini L, Ogungbenro K, Foos‐Gilbert E. Optimal design of QTc interval measurements for circadian rhythm determination. Paper presented at: PAGE 172008.
- 35. Sager PT, Nebout T, Darpo B. ICH E14: a new regulatory guidance on the clinical evaluation of QT/QTc interval prolongation and proarrhythmic potential for non‐antiarrhythmic drugs. Drug Information J. 2005;39:387–394. [Google Scholar]
- 36. Darpo B, Nebout T, Sager PT. Clinical evaluation of QT/QTc prolongation and proarrhythmic potential for nonantiarrhythmic drugs: the International Conference on Harmonization of Technical Requirements for Registration of Pharmaceuticals for Human Use E14 guideline. J Clin Pharmacol. 2006;46(5):498–507. [DOI] [PubMed] [Google Scholar]
- 37. Zhang J, Machado SG. Statistical issues including design and sample size calculation in thorough QT/QTc studies. J Biopharm Stat. 2008;18(3):451–467. [DOI] [PubMed] [Google Scholar]
Associated Data
This section collects any data citations, data availability statements, or supplementary materials included in this article.
Supplementary Materials
Supplementry Information