Abstract
Purpose
Models relating perimetric sensitivities to ganglion cell numbers have been proposed for combining structural and functional measures from patients with glaucoma. Here we compared seven models for ability to differentiate progressing and stable patients, testing the hypothesis that the model incorporating local spatial scale would have the best performance.
Methods
The models were compared for the United Kingdom Glaucoma Treatment Study (UKGTS) data for the right eyes of 489 patients recently diagnosed with glaucoma. The SITA 24‐2 program was utilised for perimetry and Stratus OCT fast scanning protocol for thickness of circumpapillary retinal nerve fibre layer (RNFL). The first analysis defined progression in terms of decline in RNFL thickness. The highest and lowest quintiles (22 subjects per group) were identified for change in thickness of inferior temporal (IT), superior temporal (ST), and global RNFL (μm year−1); a two‐way anova was used to look for differences between the models in ability to discriminate the two quintiles. The second analysis defined a ‘progression group’ as those who were flagged by the UKGTS criteria as having progressive loss in perimetric sensitivity, and a ‘no progression’ group as those with rate of change in Mean Deviation (MD) closest to 0 dB year−1 (87 subjects per group). The third analysis characterised variability of retinal ganglion cell (RGC) models for the two groups in the second analysis, using the standard deviation of residuals from linear regression of ganglion cell number over time to compute Coefficient of Variation (CoV).
Results
The first analysis produced a negative result because the three anovas found no effect of model or interaction of model and group (F 6,294 < 3.1, p > 0.08). There was an effect of group only for the anova with the ST sector (F 6,294 = 12.2, p < 0.001). The second analysis also produced a negative result, because ROC areas were in the range 0.69–0.72 for all models. The third analysis found that even when variability in MD was low, the CoV was so large that test‐retest variation could include 100% loss of ganglion cells.
Conclusions
Two very different approaches for testing the hypothesis both gave a negative result. For all seven ganglion cell models, rates of ganglion cell loss were highly affected by fluctuations in height of the hill of vision. Methods for reducing effects of between‐visit variability are needed in order to assess progression by relating perimetric sensitivities and ganglion cell numbers.
Keywords: disease progression, glaucoma, perimetry, retinal ganglion cells
Introduction
Clinical evaluation of glaucomatous damage relies on both structural and functional measurements, but normal between‐subject variability results in frequent discordance between structural and functional measures.1 In the late 20th century the consensus about this discordance was that substantial loss of retinal ganglion cells had to occur before perimetric damage could be present. This consensus led to efforts to find either better perimetric tests or else structural tests that would detect glaucoma earlier. This consensus was developed into a model of a ‘glaucoma continuum’: first retinal ganglion cells (RGC) die, then retinal nerve fibre layer thins, then new types of perimetry (such a short‐wavelength or flicker) show defects, and only at advanced stages does conventional perimetry show defects.2 In time, it became clear that the consensus about ganglion cell loss was incorrect, and that conventional perimetry could show defects in some patients before new types of perimetry, and even before imaging.3 The original view about ganglion cell loss arose from inappropriate statistical analyses,4 as did the view that new types of perimetry were more sensitive to glaucomatous damage than conventional perimetry.
This is an example of the ‘reproducibility crisis’ in biomedical science, which also plagues psychology.5 More than half of pre‐clinical research results that have been tested have failed on replication, and the American Statistical Association (ASA) recently made a strong statement about use and abuse of p values.6 The current study addresses the crisis by showing how to adhere to the ASA principles when examining models relating perimetric sensitivity and ganglion cell loss.
The understanding that perimetric loss accompanies ganglion cell loss led to a number of models7, 8, 9, 10, 11 that provide estimates of ganglion cell loss for a local retinal region based on perimetric sensitivity for that region, as illustrated in Figures 1 and 2. The models vary in number of parameters, in assumptions about linearity, and in the role of retinal location. Gardiner et al.12 compared six models for ability to predict progression based on baseline visual field data, and found modest differences among the models. The fact that a wide range of models with very different assumptions can give similar results limits the conclusions that can be drawn about pathophysiology. Gardiner et al. specifically avoided attempts to distinguish between progressing and non‐progressing eyes, because there is no standard way to define progression, and performed an exploratory analysis with no a priori hypothesis about how the models might differ. The current study tested an a priori hypothesis about spatial scale by applying those six models (plus an additional model) to address the issue of distinguishing progressing from non‐progressing eyes.
Figure 1.
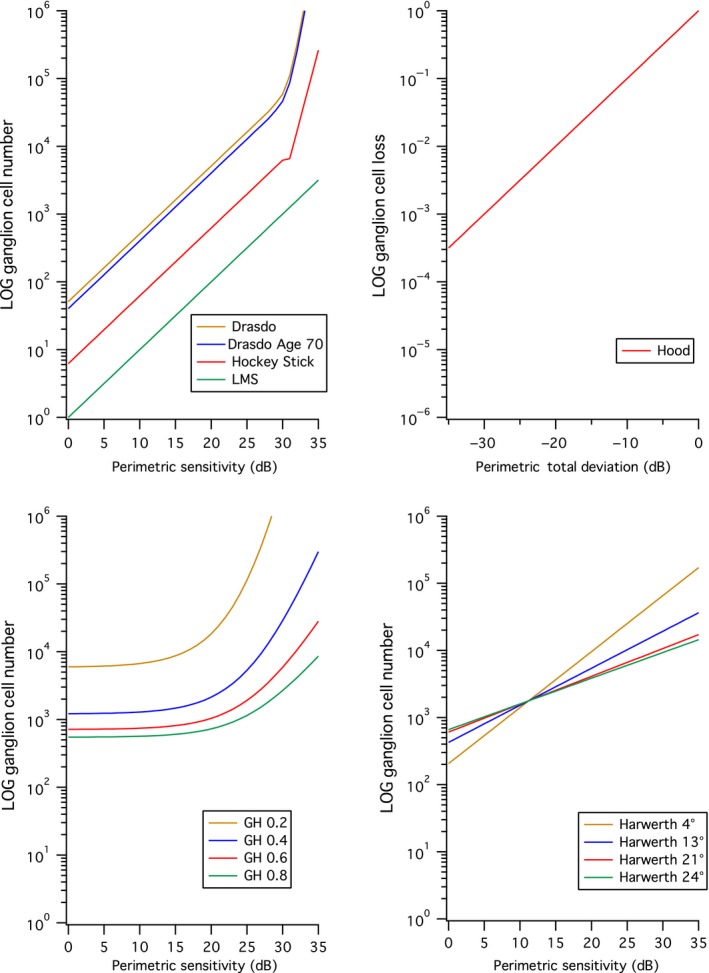
Seven models relating ganglion cell number to perimetric sensitivity. The upper left panel shows four models that do not account for effects of eccentricity. The upper right panel shows the Hood model, which does not directly give ganglion cell number. The lower left shows the Garway‐Heath (GH) model with four different values of the spatial summation coefficient K, and the lower right shows the Harwerth model for four different eccentricities.
Figure 2.
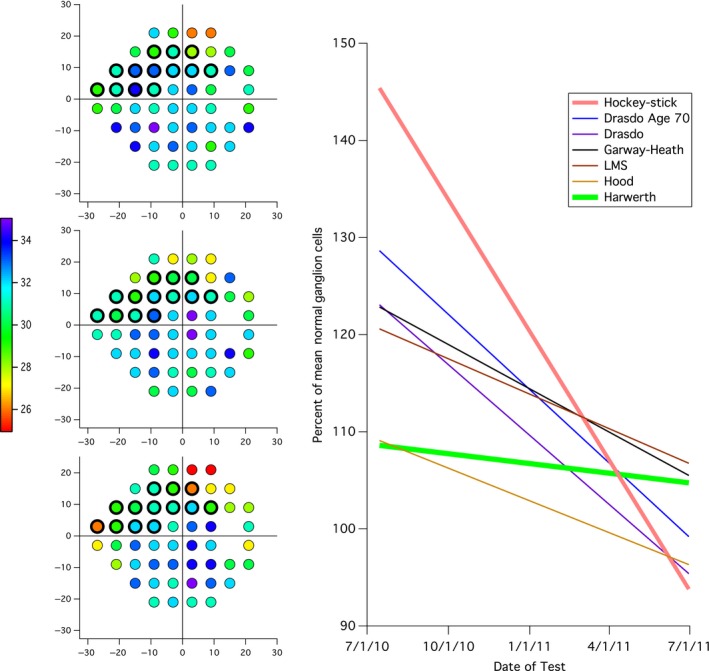
Example of conversion of perimetric sensitivities into ganglion cell loss for the 13 visual field locations in superior nasal visual field that correspond to the inferior temporal (IT) sector of the optic disc, indicated by the black outlines in the visual field plots on the left. The visual field plots are for the 1st (upper), 5th (middle) and 8th (lower) fields; the color scale indicates the decibel value. The graph on the right shows linear regression lines for ganglion cell number vs time for the seven models. LMS, Linear mean sensitivity model.
Three models use a single input, two models use two inputs, one model uses three inputs and one model uses four inputs. Three models (Figure 1, upper left panel) use just contrast sensitivity as the input: the Linear Mean Sensitivity (LMS) model13 assumes a linear relation between linear contrast sensitivity and ganglion cell number, the Drasdo model10 assumes that the relation is linear for contrast threshold less than 40% and exponential for higher contrast thresholds, and the hockey‐stick model8, 11 assumes that log contrast sensitivity is linearly related to log ganglion cell number, with two different linear functions above and below a contrast threshold of 25%. The Drasdo age model adds age as a second input (upper left panel, for age 70). The Harwerth model14 uses two inputs, contrast sensitivity and distance from fixation (lower right panel), and assumes that at each eccentricity the relation is logarithmic. The Garway‐Heath model7 uses three inputs, contrast sensitivity and both horizontal and vertical distances from fixation, and assumes the relation at each location is nonlinear (lower left panel). The Hood model15 assumes a linear relation and uses four inputs (contrast sensitivity, age, x and y distances from fixation) to compute Total Deviation (TD) as difference from mean normal expected for the age and location, then converts TD to linear units in order to compute loss of ganglion cells as percent of mean normal (upper right panel). The Harwerth model16 has been used in a number of studies to combine perimetric and structural findings.17, 18, 19, 20 However, our lab and another lab have found some weaknesses with this approach,21, 22 so the current study compares all seven models.
A challenge with many scientific studies is that the hypothesis to be tested is derived in the process of analysing the data, rather than identified before analysing the data. This means that many analyses may be conducted and only a few reported, giving misleading values for statistical significance. The ASA guidelines call for transparency, in which all analyses are described. For the current study the planned statistical analyses described in Methods were recorded before each round of data analysis, and only these p values are discussed in Results. Analyses that were not planned in this way are presented in Discussion. The first planned analysis was based on a specific hypothesis, and when it failed to reject the null hypothesis a second analysis was designed with ~4‐fold larger sample size. When both of those analyses failed to reject the null hypothesis, a planned analysis was performed to assess test‐retest variability. This process of systematically testing the hypothesis lead to a better understanding of the limitations for these models as a class, and identified a key obstacle that must be overcome before such models can be used in a meaningful way. This analysis demonstrates how transparent hypothesis‐testing can lead to useful insights, even when there is negative result.
Our analysis of relative spatial scale23 showed that the relation between ganglion cell density and perimetric sensitivity is different for locations at the same eccentricity but in different hemifields. Currently, most models relating ganglion cell loss to perimetric sensitivity do not address such local differences. Only the Garway‐Heath model utilises spatial summation data to account for local differences in the relation between ganglion cell density and perimetric sensitivity. A recent study of patients with glaucoma concluded that local spatial summation influences ability of perimetry to detect ganglion cell damage.24 If local spatial summation values are critical for ganglion cell loss calculations, then the Garway‐Heath model should have an advantage over the other models of ganglion cell loss. Therefore we tested the hypothesis that the Garway‐Heath model would be superior to the other models for detecting progressive loss of retinal ganglion cells.
Methods
Subjects and instrumentation
Data were retrieved from the United Kingdom Glaucoma Treatment Study (UKGTS), a randomised, double‐masked, placebo‐controlled, multicentre treatment trial for open angle glaucoma.25 The UKGTS recruited 516 patients recently diagnosed with glaucoma, who were randomly assigned to treatment and placebo groups. Data about placebo or treatment were not extracted for our analysis, because the hypothesis does not concern treatment. Exclusion was based on any of the following criteria: visual acuity worse than 20/40 (6/12, 0.30 logMAR), cataracts exceeding N1, C2, or P1 (Lens Opacities Classification System III), highly elevated IOP (either eye >35 mmHg on two consecutive visits or average between eyes >30 mmHg on two consecutive visits), and ocular or neurological co‐morbidities affecting visual field testing. Other inclusion and exclusion criteria can be located in the original study methodology.26
Removal from the study due to progressive visual field loss was determined using the Guided Progression Analysis (GPA) software of the Humphrey Field Analyzer II‐i. If the GPA software identified at least three visual field locations worse than baseline at p < 0.05 in two consecutive reliable visual fields and at least three visual field locations worse than baseline in the two subsequent reliable visual fields, a confirmation visit was scheduled followed by an exit visit if progression was confirmed. Two independent glaucoma specialists confirmed that the deterioration was consistent with glaucoma, based on the visual fields and a fundus photograph taken at the endpoint.
Data analysis
Data for the perimetric locations at and above the blind spot were removed before ganglion cell numbers were computed. The analyses were for right eyes only, with the intention that any results meeting criteria for statistical significance would be repeated on the left eyes as a test of internal validity. The initial analysis used RNFL data to identify progression, and based on those findings a second analysis used perimetric data. The results of the second analysis lead to a third analysis concerning perimetric variability.
Progression defined as RNFL thickness loss
Our own perimetric and RNFL reliability criteria were applied to the UKGTS data for this analysis. Individual visual field tests were removed for fixation losses greater than 20% or false‐positive rates greater than 15%. Individual RNFL scans were excluded for signal strength less than 7, image error messages, and one or more pixels with thickness less than 10 μm. After these scans were removed, an entire visit was removed when the range of global thicknesses for repeated RNFL scans at that visit was greater than 15 μm. In total, visits were removed for 29 subjects.
Only subjects between the ages of 46 and 85 were included in the analysis. Subjects were required to have reliable perimetric and RNFL data collected on the same day for at least seven visits, and the most recent seven visits were used for analysis. If multiple reliable measures of either RNFL thickness or perimetric sensitivity were taken on the same day, then the measures were averaged for that date. One hundred eleven subjects remained after these criteria were applied.
Rate of loss of RNFL was then calculated from data meeting the exclusion and inclusion criteria. To examine the extreme cases, subjects showing the highest and lowest quintile of RNFL slopes (μm year−1) were compared (22 subjects per quintile). This was done for inferior temporal (IT), superior temporal (ST), and global RNFL thicknesses. Numbers of retinal ganglion cells were calculated for each visit using the seven models. For each model, mean normal ganglion cell number was computed from control data in Swanson et al., 27 The resulting ganglion cell number for each visit was converted to percent of mean normal (%MN) and rate of ganglion cell loss was calculated (%MN year−1). anovas were performed to compare the high and low progression groups defined by IT, ST, and global slopes. IT and ST sectors utilised the 13 locations defined in Swanson & Horner,21 to calculate number of cells. Figure 2 illustrates this with an example showing three of eight visual fields, and linear regression lines for ganglion cell estimates over time for all eight fields.
Receiver operating characteristic (ROC) curves were generated based on ability of ganglion cells models to categorise high and low progression groups defined by change in RNFL thickness. The area under the ROC curve was calculated for each model as percent correct for a two‐alternative forced‐choice task where equal numbers of the two choices are present.28
Progression defined as perimetric sensitivity loss
The quintiles approach was not used in this second analysis, because there are more highly developed indices for assessing perimetric loss than for RNFL loss. Reliability criteria were not applied for this analysis, there was no requirement for matching RNFL data, and different tests on the same day were not averaged. The inclusion criteria for this analysis required subjects to have at least eight perimetry tests. The most recent eight tests were used for analysis when a subject had more than eight tests. Subjects were grouped into ‘progression’ and ‘no progression’ groups. ‘Progression’ was flagged as progressing by the UKGTS criteria: at least three visual field locations worse than baseline at the 5% levels in two consecutive reliable visual fields and at least three visual field locations worse than baseline at the 5% levels in the two subsequent consecutive reliable visual fields.25 In addition to the UKGTS criteria, for the ‘progression’ group 10 locations in the 24‐2 test grid were required to be decreasing in sensitivity based on linear regression (Slope < 0). The ‘no progression’ group consisted of the same number of subjects as the ‘progression’ group, but was composed of people who were scored as no‐progression and were chosen for having rates of change closest to zero for Mean Deviation (MD). Ganglion cell number and its rate of change for each model were calculated for IT, ST, and global measures in the same manner as the preceding analysis. ROC curves were generated based on ability of ganglion cells models to categorize defined by visual field analysis as ‘progression’ and ‘no‐progression’ and the area under the curve was calculated for each model. Eighty‐seven subjects were placed in each group.
Characterising variability of RGC models
Six subjects were selected to represent average and high variability at varying levels of perimetric sensitivity loss. The standard deviation (S.D.) of the residuals from linear regression of MD vs age was calculated for each subject in the low progression group defined in the second analysis. Three subjects with the minimum, median, and maximum MD were selected from subjects within ±0.1 dB of the median for the standard deviation of the residuals. Three subjects with the minimum, median, and maximum MD were selected from subjects within ±0.1 dB of the upper quartile for the standard deviation of the residuals. Ganglion cell number and its coefficient of variation (standard deviation divided by mean) were calculated for the six subjects with each model using IT, ST, and global perimetric sensitivity measures.
Results
Figure 3 shows the average MD plotted against the average global RNFL thickness of all subjects with perimetric and RNFL data gathered on the same day. The global high and low progression groups for the analysis defined by RNFL progression are shown as open symbols. The bivariate Gaussian ellipse represents 90% of normal between‐subject variability. A greater number of subjects in the high RNFL progression group fell outside of the normal range than the low RNFL progression group (14 vs 8). Figure 4 shows global rate of change in ganglion cell number for each model expressed as percent of mean normal, plotted against the rate of RNFL thickness change for low and high progression groups in the first analysis. The two‐way anovas (Tables 1, 2, 3) found no effect of model or interaction of the model and group (F 6,294 < 3.1, p > 0.08). There was an effect of group (high and low RNFL progression) only for the anova with the ST sector (F 6,294 = 12.2, p = 0.001). Subject data points were similarly spread in both groups, with ratio of S.D.s (low progression/high progression) from 0.59 to 1.62 across the seven models, median 1.06. For all models, the ROC areas were largest for Global, ranging from 0.65 to 0.68, with the Garway‐Heath model at 0.66, as shown in Figure 5. For IT and ST, the Garway‐Heath model also had ROC area that was neither largest nor smallest. Therefore the first analysis did not support the hypothesis about spatial scale.
Figure 3.
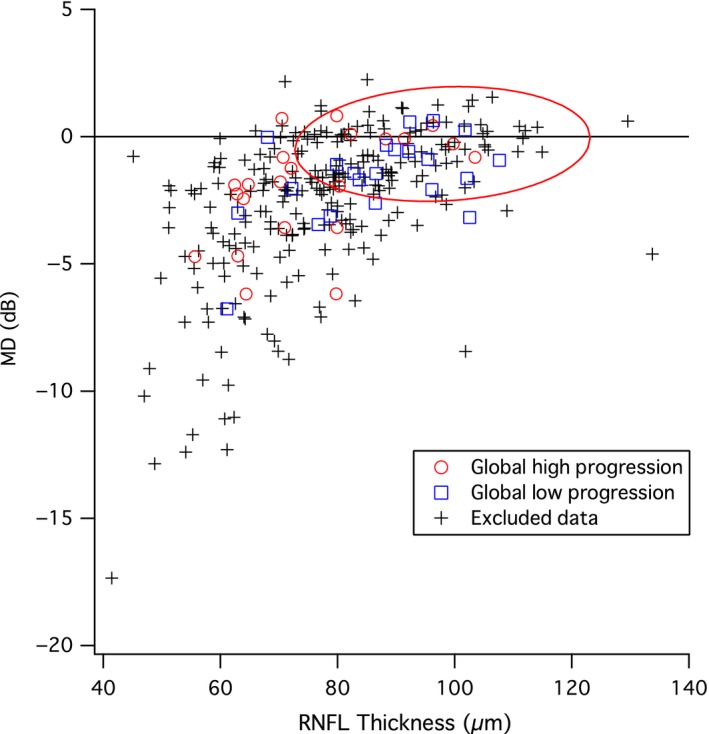
Comparison of average MD (Mean Deviation, y‐axis) and average RNFL (retinal nerve fibre layer) thickness (x‐axis) for subjects with reliable perimetric and RNFL data on the same day. Bivariate Gaussian ellipse represents normal between‐subject variability at p = 0.90. Red circles show subjects in the high progression group defined by change in RNFL thickness and the blue squares show subjects in the low progression group defined by change in RNFL thickness.
Figure 4.
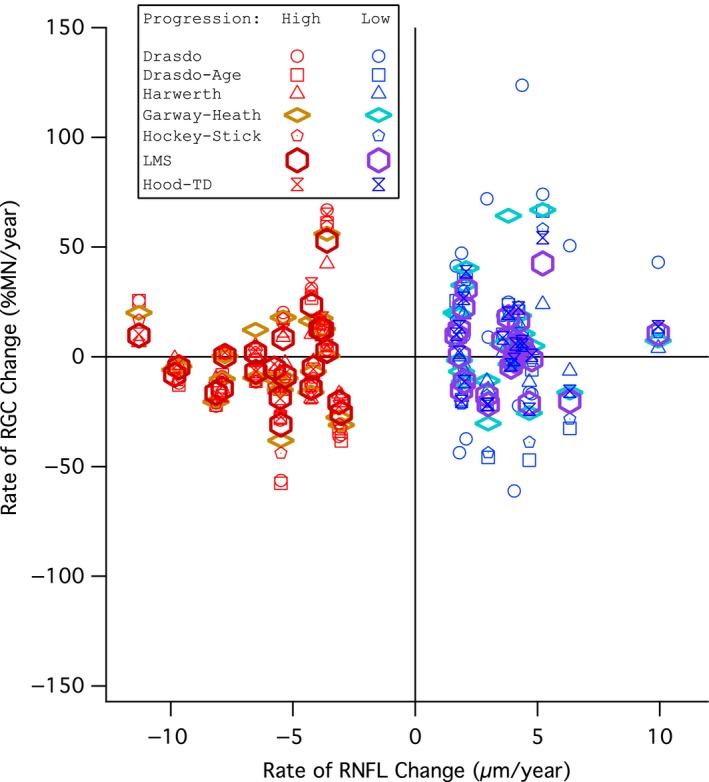
Comparison of global rate of retinal ganglion cell (RGC) change (y‐axis) and global rate of retinal nerve fibre layer (RNFL) change (x‐axis) for subjects in the progression groups defined by RNFL thickness change. Red markers show high progression group subjects and blue markers show low progression group subjects. Circles show the Drasdo model, squares show the Drasdo Age‐corrected model, triangles show the Harwerth model, diamonds show the Garway‐Heath model, pentagons show the Hockey‐Stick model, hexagons show the Linear mean sensitivity model (LMS model), and hourglasses show the Hood model.
Table 1.
Results of a two‐way anova on global retinal ganglion cell (RGC) change per year (%MN year−1) for the progression groups in the progression by retinal nerve fibre layer (RNFL) loss analysis
| Source | Type III Sum of Squares | d.f. | Mean Square | F ratio | p‐value |
|---|---|---|---|---|---|
| Model | 0.000 | 6 | 3.60E‐5 | 1.43 | 0.20 |
| Progression | 7.732E‐5 | 1 | 7.73E‐5 | 3.08 | 0.08 |
| Model × Progression | 0.000 | 6 | 3.86E‐5 | 1.54 | 0.17 |
| Error | 0.007 | 294 | 2.51E‐5 | ||
| Total | 0.008 | 308 | |||
| Corrected Total | 0.008 | 307 |
d.f. = degrees of freedom.
Table 2.
Results of a two‐way anova on superior temporal (ST) sector retinal ganglion cell (RGC) change per year (%MN year−1) for the progression groups in the progression by retinal nerve fibre layer (RNFL) loss analysis
| Source | Type III Sum of Squares | d.f. | Mean Square | F ratio | p‐value |
|---|---|---|---|---|---|
| Model | 2.054E‐6 | 6 | 3.42E‐7 | 0.34 | 0.92 |
| Progression | 1.238E‐5 | 1 | 1.24E‐5 | 12.2 | 0.001 |
| Model × Progression | 5.520E‐6 | 6 | 9.20E‐7 | 0.91 | 0.49 |
| Error | 0.000 | 294 | 1.01E‐6 | ||
| Total | 0.000 | 308 | |||
| Corrected Total | 0.000 | 307 |
Table 3.
Results of a two‐way anova on inferior temporal (IT) sector retinal ganglion cell (RGC) change per year (%MN year−1) for the progression groups in the progression by retinal nerve fibre layer (RNFL) loss analysis
| Source | Type III Sum of Squares | d.f. | Mean Square | F ratio | p‐value |
|---|---|---|---|---|---|
| Model | 4.739E‐6 | 6 | 7.90E‐7 | 0.62 | 0.72 |
| Progression | 6.254E‐7 | 1 | 6.25E‐7 | 0.49 | 0.48 |
| Model × Progression | 6.592E‐7 | 6 | 1.10E‐7 | 0.09 | 1.00 |
| Error | 0.000 | 294 | 1.28E‐6 | ||
| Total | 0.000 | 308 | |||
| Corrected Total | 0.000 | 307 |
Figure 5.
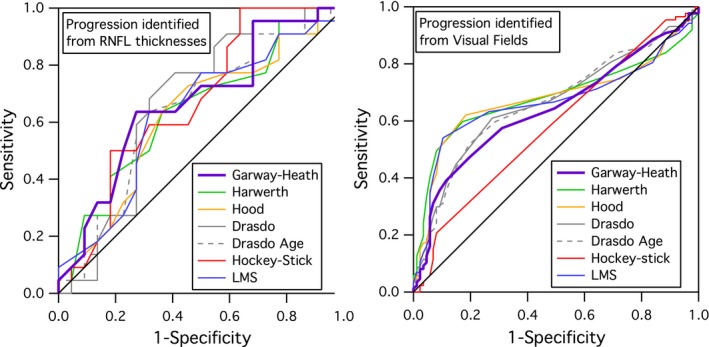
ROC curves for global measures for the seven models, for analyses 1 (left) and 2 (right).
Figure 6 shows the average MD and PSD for each of the 489 subjects with post‐screening perimetric data in the UKGTS. High and low progression groups for each analysis are shown. The red ellipse represents 90% of normal between‐subject variability from our published normative data.27 The second analysis, which defined progression by local changes in perimetric sensitivity, utilised data with slightly lower average MD (−2.8 dB vs −1.8 dB) and greater average PSD (4.7 dB vs 3.3 dB) than the first analysis. The second analysis yielded similar ROC areas as the first analysis (Figure 5). For all models, the ROC areas were largest for Global (Figure 5), ranging from 0.67 to 0.72, with the Garway‐Heath model at 0.67. For IT and ST, the Garway‐Heath model also had ROC area that was not the largest. Therefore the second analysis did not support the hypothesis about spatial scale.
Figure 6.
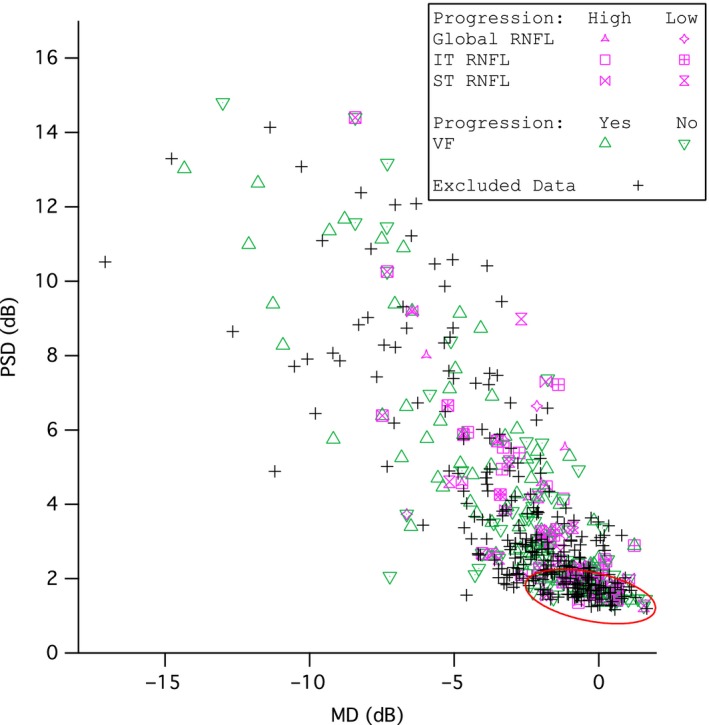
Average Pattern standard deviation (PSD, y‐axis) vs average Mean Deviation (MD, x‐axis) for the 489 subjects in the UKGTS whose data were analysed in this study. Bivariate Gaussian ellipse represents the limits of the controls at p = 0.90. Purple markers represent subjects in the progression from retinal nerve fibre layer (RNFL) change analysis and green markers represent subjects from the progression from perimetric sensitivity analysis.
Figure 7 shows test‐retest variability of MD as the standard deviation of the residuals, for the progression and no‐progression groups. The standard deviation of the residuals for MD had mean (S.E.) = 1.08 (0.06) dB for the progression group and 0.67 (0.04) dB for the no progression group. Figure 8 shows the coefficients of variation plotted for six representative subjects from the no‐progression group in Figure 7. Variability can be considered high when the coefficient of variation is 0.5, because decline by 2 standard deviations will yield zero ganglion cells (which is equivalent to 100% loss of ganglion cells). This is shown in Figure 8 as a dashed line at 0.5. All models had high variability for at least one of the six subjects, and all six subjects had high variability for at least some models.
Figure 7.
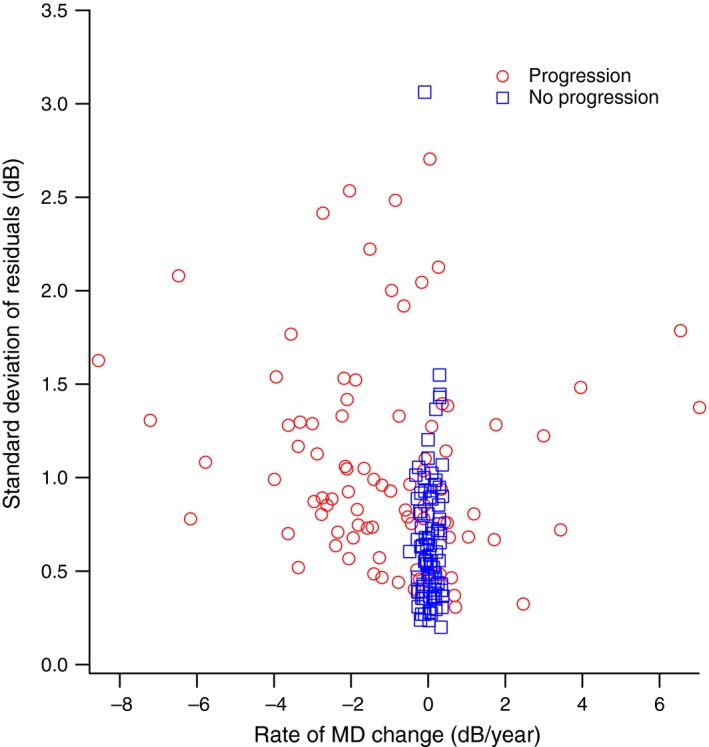
Standard Deviation of the residuals for linear regression of Mean Deviation (MD) vs time (y‐axis), plotted against the rate of MD change (x‐axis) for subjects in the ‘progression’ and ‘no progression’ groups defined by change in perimetric sensitivity. Red circles show subjects in the ‘progression’ group and blue squares show subjects in the ‘no progression’ group.
Figure 8.
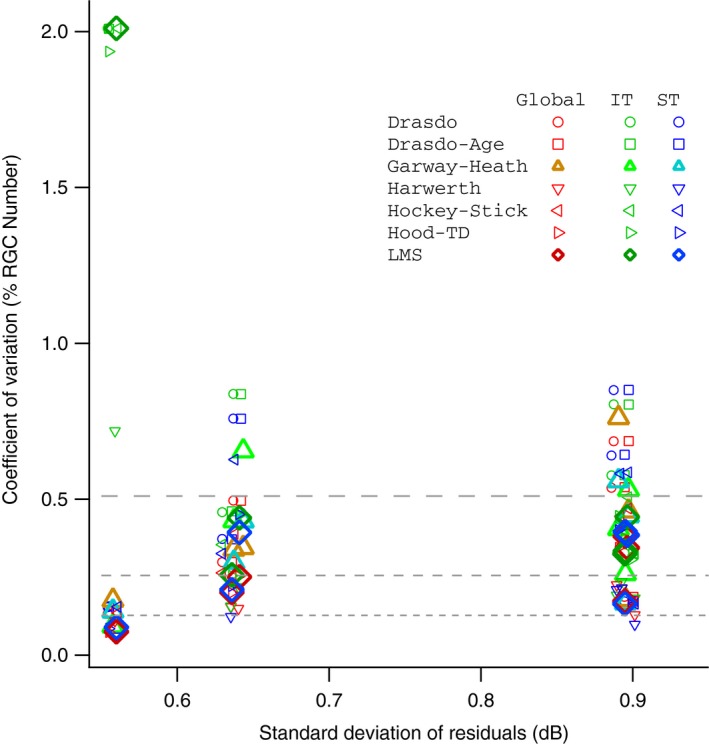
Comparison of Coefficient of Variation (CV) for retinal ganglion cells (RGCs, y‐axis) and Standard Deviation of the Residuals of Mean Deviation, MD (x‐axis) for six subjects in the no‐progression group defined by perimetric sensitivity. Red markers show coefficient of variation for global RGC count, green markers show CV for IT RGC count, and blue markers show CV for ST RGC count. Circles show Drasdo model, squares show Drasdo‐Age corrected model, upright triangles show Garway‐Heath model, inverted triangles show Harwerth model, left‐facing pennants show Hockey‐Stick model, right‐facing pennants show Hood‐TD model, and diamonds show LMS model. The dashed lines indicate where the 95% range for test‐retest variability includes 100% loss (upper line), 50% loss (middle line) and 25% loss (lower line).
Discussion
This hypothesis‐based study obtained a negative result, and reports of negative results are an important aspect of transparency and reproducibility.6 Therefore, when the first analysis failed to reject the null hypothesis, a second analysis was performed using a very different approach. The use of RNFL changes to define progression may have obscured differences between the models, due to structure‐function discordance.1 As can be seen in Figure 4, rates of increase in RNFL thickness for the upper quintile were of similar magnitude as rates of decrease for the lower quintile, with mean (S.D.) slope of +3.8 (1.9) μm year−1 and −5.9 (2.4) μm year−1, respectively. Therefore RNFL slope may not be a reliable indicator of progression over this time period. Therefore the second analysis did not define progression in terms of RNFL, but relied entirely on perimetry. The first analysis had 22 people per group, so statistical power may have been low. Therefore the second analysis used a larger number of subjects, 87 people per group. For such a large sample, an effect size that does not reach statistical significance is unlikely to be clinically meaningful.
After both approaches failed to reject the null hypothesis, an analysis of test‐retest variability in perimetric sensitivity found that typical variability in global sensitivity lead to high variability in ganglion cell number. The average value for the S.D. of residuals of MD was 0.7 dB for the no‐progression group in Figure 7, and 1.1 dB for the progression group. Values for variability of MD have previously been reported as 1.0 dB29 and 1.6 dB,30 consistent with our results for the progression group. The dB units used in perimetry are on a logarithmic scale,3 while ganglion cell numbers are on a linear scale, so what seems like modest variability in dB units can translate to substantial variability in ganglion cell numbers. This is illustrated in Figure 8, where the coefficient of variation becomes so great that 100% loss of ganglion cells can be within test‐retest variability.
Perimetric variability can be analysed in terms of within‐session variability and between‐session variability. Within‐session variability can be characterised in terms of intrinsic noise, inferred from the slope of a frequency‐of‐seeing curve.31 Frequency‐of‐seeing curves in perimetry are typically steep in regions of the visual field with sensitivity in the normal range and more shallow in damaged regions.32 Between‐session variability can be characterised by two components: ‘homogeneous fluctuation’ as an overall change in sensitivity that affects all locations, and ‘heterogeneous fluctuation’ as change at individual locations that increases with eccentricity and in locations with glaucomatous defects.33 Heterogeneous fluctuation is typically low at locations with steep frequency‐of‐seeing curves, and high at locations with shallow frequency‐of‐seeing curves. Homogeneous fluctuation has also been referred to as variation in the ‘height of the hill of vision’, and can be caused by differences in the psychophysical criterion on different days, shifting the frequency‐of‐seeing curves horizontally without affecting slope. It is common to see learning effects,34, 35 where the subject's criterion for detecting the stimulus undergoes changes between tests so that the subject produces overall higher sensitivities after becoming experienced with perimetry. Seasonal patterns for homogeneous fluctuation have also been reported.36, 37
Learning effects may be responsible for the positive slopes for MD in some of the patients classed as progressing by the UKGTS criteria. We noted that in the progression group, for a number of patients MD increased over time (Figure 7), so the height of the hill of vision was increasing even though there was progression at individual locations. The UKGTS criterion detected local losses despite increases in the height of the hill of vision, but our applications of the ganglion cell models did not.
A reviewer asked us to repeat the analysis after removing the people with MD slope > 0. This was not a planned analysis, so was not included in the Methods and Results sections. For this analysis, we removed the 20 people from the high‐progression group who had MD > 0, and 20 from the low‐progression group whose MD slopes were the greatest distances from 0. This caused ROC areas to increase, with a range from 0.80 (Garway‐Heath model) to 0.88 (Harwerth model).
Traditional psychophysics controls for a subject's response criterion, such as by use of many blank trials to make precise estimates of false positive rates for yes/no tasks, or by using forced‐choice methods with many blank trials. By comparison, perimetry uses few or no blank trials, and makes only crude estimates of false positive rates.38 We have found that forced‐choice methods can reduce between‐visit variability in glaucomatous defects by a factor of two as compared to perimetry.39 Perimetric indices provide an adjustment for homogeneous fluctuation with the ‘pattern deviation’ (PD) analysis, which attempts to compensate for fluctuations in the height of the hill of vision but is known to have limitations.40 In a follow‐up analysis we used PD to estimate the height of hill of vision, but correcting for this did not reduce variability in ganglion cell number. The determination of visual progression in logarithmic units appears to be more robust than determination of visual progression in ganglion cell numbers.
Our approach was to ensure equal numbers of visual fields for each analysis, not necessarily equal durations covered by that number of fields. For the first analysis with seven visits, duration had mean (S.D.) = 1.3 (0.3) years for the high progression group, and 1.5 (0.3) years for the low progression group (t = 1.69, two‐tailed p = 0.098). For the second analysis with eight visual fields, mean (S.D.) = 0.7 (0.3) years duration for progression, and 1.1 (0.4) years duration for no‐progression (t = 7.96, two‐tailed p < 0.0001). This difference in mean duration for the second analysis was due to the fact that when a patient was scored as progressing, there were multiple confirmatory tests over a relatively short time period before they were removed from study. In a follow‐up evaluation in response to a reviewer we repeated the analyses for global indices using equal mean durations for both groups and found ROC areas from 0.72 to 0.77, with the Garway‐Heath model at 0.72.
We computed area under the ROC curve to estimate percent correct for the two‐alternative forced‐choice task28 of distinguishing between two different groups of patients. For instance, an ROC area of 0.75 means that the classification was correct 75% of the time, equivalent to guessing 50% of the time (similar to 75% correct on a true/false test with half of questions true and half false). Changing the criterion used can change how the effect of guessing is applied to the two groups (trade‐offs between sensitivity and specificity), but the underlying guess rate is the same for all criteria. In both of our planned analyses, all ROC areas were less than 0.75; this means that the guess rate was always greater than 50%, indicating poor diagnostic efficiency.
Converting perimetric sensitivities to ganglion cell numbers has been promoted as an aid in combining structural and functional measures,19 but as shown in Figures 1 and 2 there are a number of models in the literature that convert perimetric sensitivities to ganglion cell numbers and these can give substantially different results about progression. We attempted to differentiate between these models in terms of ability to detect progression as loss of ganglion cells, but between‐visit variability was too high in these linear units. New methods for reducing effects of between‐visit variability appear to be necessary before models relating perimetric sensitivities and ganglion cell numbers can offer an improvement over existing methods for detecting progression.
Disclosure
Dr Swanson is a consultant for Carl Zeiss Meditec and Heidelberg Engineering. He affirms that these relationships had no impact on this research. Dr Horner & Mr Price have no potential conflicts of interest to disclose.
Acknowledgements
This work was supported by the US National Institutes of Health (grants R01EY007716, R01EY024542, P30EY019008, T35EY013937). The authors thank the UKGTS team for providing them with de‐identified data from the UKGTS study. The authors alone are responsible for the content and writing of the paper.
Price DA, Swanson WH & Horner DG. Using perimetric data to estimate ganglion cell loss for detecting progression of glaucoma: a comparison of models. Ophthalmic Physiol Opt 2017; 37: 409–419. doi: 10.1111/opo.12378
References
- 1. Ashimatey BS & Swanson WH. Between‐subject variability in healthy eyes as a primary source of structural‐functional discordance in patients with gaucoma. Invest Ophthalmol Vis Sci 2016; 57: 502–507. [DOI] [PMC free article] [PubMed] [Google Scholar]
- 2. Weinreb RN, Friedman DS, Fechtner RD et al Risk assessment in the management of patients with ocular hypertension. Am J Ophthalmol 2004; 138: 458–467. [DOI] [PubMed] [Google Scholar]
- 3. Malik R, Swanson WH & Garway‐Heath DF. ‘Structure‐function relationship’ in glaucoma: past thinking and current concepts. Clin Exp Ophthalmol 2012; 40: 369–380. [DOI] [PMC free article] [PubMed] [Google Scholar]
- 4. Marin‐Franch I, Malik R, Crabb DP & Swanson WH. Choice of statistical method influences apparent association between structure and function in glaucoma. Invest Ophthalmol Vis Sci 2013; 54: 4189–4196. [DOI] [PMC free article] [PubMed] [Google Scholar]
- 5. Baker M. 1,500 scientists lift the lid on reproducibility. Nature 2016; 533: 452–454. [DOI] [PubMed] [Google Scholar]
- 6. Wasserstein RL & Lazar NA. The ASA's statement on p‐values: context, process, and purpose. Am Stat 2016; 70: 129–133. [Google Scholar]
- 7. Garway‐Heath DF, Caprioli J, Fitzke FW & Hitchings RA. Scaling the hill of vision: the physiological relationship between light sensitivity and ganglion cell numbers. Invest Ophthalmol Vis Sci 2000; 41: 1774–1782. [PubMed] [Google Scholar]
- 8. Swanson WH, Felius J & Pan F. Perimetric defects and ganglion cell damage: interpreting linear relations using a two‐stage neural model. Invest Ophthalmol Vis Sci 2004; 45: 466–472. [DOI] [PubMed] [Google Scholar]
- 9. Harwerth RS & Quigley HA. Visual field defects and retinal ganglion cell losses in patients with glaucoma. Arch Ophthalmol 2006; 124: 853–859. [DOI] [PMC free article] [PubMed] [Google Scholar]
- 10. Drasdo N, Mortlock KE & North RV. Ganglion cell loss and dysfunction: relationship to perimetric sensitivity. Optom Vis Sci 2008; 85: 1036–1042. [DOI] [PubMed] [Google Scholar]
- 11. Redmond T, Anderson RS, Russell RA & Garway‐Heath DF. Relating retinal nerve fiber layer thickness and functional estimates of ganglion cell sampling density in healthy eyes and in early glaucoma. Invest Ophthalmol Vis Sci 2013; 54: 2153–2162. [DOI] [PubMed] [Google Scholar]
- 12. Gardiner SK, Demirel S, Johnson CA & Swanson WH. Assessment of linear‐scale indices for perimetry in terms of progression in early glaucoma. Vision Res 2011; 51: 1801–1810. [DOI] [PMC free article] [PubMed] [Google Scholar]
- 13. Hot A, Dul MW & Swanson WH. Development and evaluation of a contrast sensitivity perimetry test for patients with glaucoma. Invest Ophthalmol Vis Sci 2008; 49: 3049–3057. [DOI] [PMC free article] [PubMed] [Google Scholar]
- 14. Harwerth RS, Carter‐Dawson L, Smith EL 3rd, Barnes G, Holt WF & Crawford ML. Neural losses correlated with visual losses in clinical perimetry. Invest Ophthalmol Vis Sci 2004; 45: 3152–3160. [DOI] [PubMed] [Google Scholar]
- 15. Hood DC & Kardon RH. A framework for comparing structural and functional measures of glaucomatous damage. Prog Retin Eye Res 2007; 26: 688–710. [DOI] [PMC free article] [PubMed] [Google Scholar]
- 16. Harwerth RS, Wheat JL, Fredette MJ & Anderson DR. Linking structure and function in glaucoma. Prog Retin Eye Res 2010; 29: 249–271. [DOI] [PMC free article] [PubMed] [Google Scholar]
- 17. Distante P, Lombardo S, Verticchio Vercellin AC et al Structure/Function relationship and retinal ganglion cells counts to discriminate glaucomatous damages. BMC Ophthalmol 2015; 15: 185. [DOI] [PMC free article] [PubMed] [Google Scholar]
- 18. Gracitelli CP, Tatham AJ, Zangwill LM, Weinreb RN, Liu T & Medeiros FA. Estimated rates of retinal ganglion cell loss in glaucomatous eyes with and without optic disc hemorrhages. PLoS One 2014; 9: e105611. [DOI] [PMC free article] [PubMed] [Google Scholar]
- 19. Medeiros FA, Zangwill LM, Anderson DR et al Estimating the rate of retinal ganglion cell loss in glaucoma. Am J Ophthalmol 2012; 154: 814–824. [DOI] [PMC free article] [PubMed] [Google Scholar]
- 20. Tatham AJ, Weinreb RN & Medeiros FA. Strategies for improving early detection of glaucoma: the combined structure‐function index. Clin Ophthalmol 2014; 8: 611–621. [DOI] [PMC free article] [PubMed] [Google Scholar]
- 21. Swanson WH & Horner DG. Assessing assumptions of a combined structure‐function index. Ophthalmic Physiol Opt 2015; 35: 186–193. [DOI] [PMC free article] [PubMed] [Google Scholar]
- 22. Raza AS & Hood DC. Evaluation of a method for estimating retinal ganglion cell counts using visual fields and optical coherence tomography. Invest Ophthalmol Vis Sci 2015; 56: 2254–2268. [DOI] [PMC free article] [PubMed] [Google Scholar]
- 23. Keltgen KM & Swanson WH. Estimation of spatial scale across the visual field using sinusoidal stimuli. Invest Ophthalmol Vis Sci 2012; 53: 633–639. [DOI] [PMC free article] [PubMed] [Google Scholar]
- 24. Kalloniatis M & Khuu SK. Equating spatial summation in visual field testing reveals greater loss in optic nerve disease. Ophthalmic Physiol Opt 2016; 36: 439–452. [DOI] [PubMed] [Google Scholar]
- 25. Garway‐Heath DF, Crabb DP, Bunce C et al Latanoprost for open‐angle glaucoma (UKGTS): a randomised, multicentre, placebo‐controlled trial. Lancet 2015; 385: 1295–1304. [DOI] [PubMed] [Google Scholar]
- 26. Garway‐Heath DF, Lascaratos G, Bunce C et al The United Kingdom Glaucoma Treatment Study: a multicenter, randomized, placebo‐controlled clinical trial: design and methodology. Ophthalmology 2013; 120: 68–76. [DOI] [PubMed] [Google Scholar]
- 27. Swanson WH, Malinovsky VE, Dul MW et al Contrast sensitivity perimetry and clinical measures of glaucomatous damage. Optom Vis Sci 2014; 91: 1302–1311. [DOI] [PMC free article] [PubMed] [Google Scholar]
- 28. Massof RW & Emmel TC. Criterion‐free parameter‐free distribution‐independent index of diagnostic test performance. Appl Opt 1987; 26: 1395–1408. [DOI] [PubMed] [Google Scholar]
- 29. Wall M, Doyle CK, Zamba KD, Artes P & Johnson CA. The repeatability of mean defect with size III and size V standard automated perimetry. Invest Ophthalmol Vis Sci 2013; 54: 1345–1351. [DOI] [PubMed] [Google Scholar]
- 30. Jampel HD, Vitale S, Ding Y et al Test‐retest variability in structural and functional parameters of glaucoma damage in the glaucoma imaging longitudinal study. J Glaucoma 2006; 15: 152–157. [DOI] [PubMed] [Google Scholar]
- 31. Swanson WH & Birch EE. Extracting thresholds from noisy psychophysical data. Percept Psychophys 1992; 51: 409–422. [DOI] [PubMed] [Google Scholar]
- 32. Henson DB, Chaudry S, Artes PH, Faragher EB & Ansons A. Response variability in the visual field: comparison of optic neuritis, glaucoma, ocular hypertension, and normal eyes. Invest Ophthalmol Vis Sci 2000; 41: 417–421. [PubMed] [Google Scholar]
- 33. Hutchings N, Wild JM, Hussey MK, Flanagan JG & Trope GE. The long‐term fluctuation of the visual field in stable glaucoma. Invest Ophthalmol Vis Sci 2000; 41: 3429–3436. [PubMed] [Google Scholar]
- 34. Heijl A & Bengtsson B. The effect of perimetric experience in patients with glaucoma. Arch Ophthalmol 1996; 114: 19–22. [DOI] [PubMed] [Google Scholar]
- 35. Wood JM, Wild JM, Hussey MK & Crews SJ. Serial examination of the normal visual field using Octopus automated projection perimetry. Evidence for a learning effect. Acta Ophthalmol (Copenh) 1987; 65: 326–333. [DOI] [PubMed] [Google Scholar]
- 36. Junoy Montolio FG, Wesselink C, Gordijn M & Jansonius NM. Factors that influence standard automated perimetry test results in glaucoma: test reliability, technician experience, time of day, and season. Invest Ophthalmol Vis Sci 2012; 53: 7010–7017. [DOI] [PubMed] [Google Scholar]
- 37. Gardiner SK, Demirel S, Gordon MO, Kass MA & Ocular Hypertension Treatment Study Group . Seasonal changes in visual field sensitivity and intraocular pressure in the ocular hypertension treatment study. Ophthalmology 2013; 120: 724–730. [DOI] [PMC free article] [PubMed] [Google Scholar]
- 38. Newkirk MR, Gardiner SK, Demirel S & Johnson CA. Assessment of false positives with the Humphrey Field Analyzer II perimeter with the SITA Algorithm. Invest Ophthalmol Vis Sci 2006; 47: 4632–4637. [DOI] [PubMed] [Google Scholar]
- 39. Pearson P, Swanson WH & Fellman RL. Chromatic and achromatic defects in patients with progressing glaucoma. Vision Res 2001; 41: 1215–1227. [DOI] [PubMed] [Google Scholar]
- 40. Marin‐Franch I, Swanson WH & Malinovsky VE. A novel strategy for the estimation of the general height of the visual field in patients with glaucoma. Graefes Arch Clin Exp Ophthalmol 2014; 252: 801–809. [DOI] [PMC free article] [PubMed] [Google Scholar]


