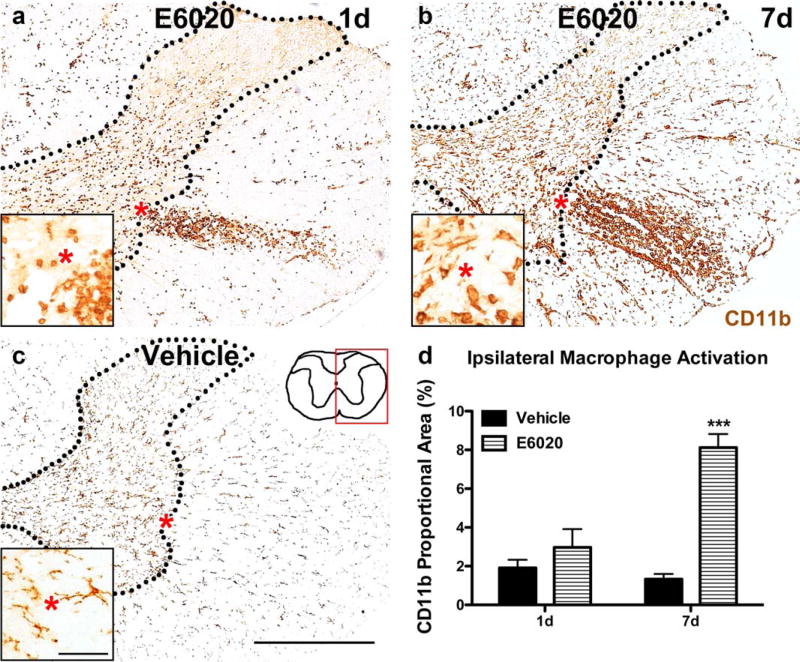
FIGURE 2.
E6020 microinjection (MI) at the GM/WM border activated intraspinal macrophages. (a) Activated macrophages in the GM and WM were present in E6020 MI tissue at day 1. (b) Overall CD11b immunoreactivity increased between day 1 and day 7 after E6020 MI. At both times, an oval shaped accumulation of activated macrophages was present in the lateral WM. (c) CD11b immunoreactivity in vehicle-treated tissue displayed resting microglia morphology at day 1 and day 7 (pictured here). Red box on spinal cord schematic (c) outlines area of representative images. Insets show high power of GM/WM border for each treatment. Red asterisks denote same area in regular and high power images. (d) Proportional area quantification of CD11b immunoreactivity in the ipsilateral spinal cord showed increased macro-phage activation with E6020 MI (striped bars) at day 7 compared to vehicle (black bars). ***p <.001 versus vehicle. Scale bar 5500 µm (a– c); 50 µm (insets, a–c). Data are mean ± SEM. [Color figure can be viewed at wileyonlinelibrary.com]

