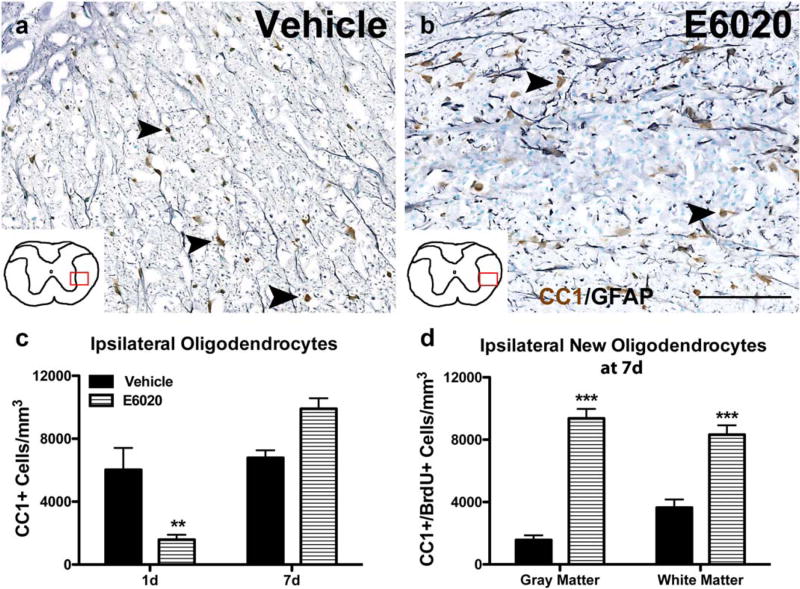
FIGURE 4.
Oligodendrocytes are lost and replaced following E6020 microinjection (MI). Representative images of oligodendrocytes (CC1, brown) and astrocytes (GFAP, gray) counterstained with methyl green at the injection site at 7 days after vehicle (a) and E6020 MI (b). Arrowheads indicate CC1+ oligodendrocytes. Red box over spinal cord schematics outline where representative images were taken. (c) Quantification of CC1+ oligodendrocytes in the ipsilateral half showed oligodendrocyte loss 1 day after E6020 MI (striped bars) compared to vehicle (black bars), and a rebound in oligodendrocyte numbers slightly beyond baseline at 7 days. (d) BrdU+ oligodendrocytes were counted in the gray and white matter at the injection site 7 days post-MI from animals receiving BrdU at 1 hr and 1–7 days. In both gray and white matter regions, the E6020 group (striped bars) had significantly more new oligodendrocytes compared to vehicle (black bars). **p < .01, ***p < .001 versus vehicle. Scale bar = 100 µm (a, b). Data are mean ± SEM. [Color figure can be viewed at wileyonlinelibrary.com]

