Abstract
Inherited and acquired mitochondrial defects have been associated with podocyte dysfunction and chronic kidney disease (CKD). Peroxisome proliferator-activated receptor γ coactivator-1α (PGC1α) is one of the main transcriptional regulators of mitochondrial biogenesis and function. We hypothesized that increasing PGC1α expression in podocytes could protect from CKD. We found that PGC1α and mitochondrial transcript levels are lower in podocytes of patients and mouse models with diabetic kidney disease (DKD). To increase PGC1α expression, podocyte-specific inducible PGC1α-transgenic mice were generated by crossing nephrin-rtTA mice with tetO-Ppargc1a animals. Transgene induction resulted in albuminuria and glomerulosclerosis in a dose-dependent manner. Expression of PGC1α in podocytes increased mitochondrial biogenesis and maximal respiratory capacity. PGC1α also shifted podocytes towards fatty acid usage from their baseline glucose preference. RNA sequencing analysis indicated that PGC1α induced podocyte proliferation. Histological lesions of mice with podocyte-specific PGC1α expression resembled collapsing focal segmental glomerular sclerosis. In conclusion, decreased podocyte PGC1α expression and mitochondrial content is a consistent feature of DKD, but excessive PGC1α alters mitochondrial properties and induces podocyte proliferation and dedifferentiation, indicating that there is likely a narrow therapeutic window for PGC1α levels in podocytes.
Keywords: Metabolism, Nephrology
Increased expression of PGC1α in podocytes increased mitochondrial content, size and function, but also induced podocyte proliferation resulting in the development of collapsing glomerulopathy.
Introduction
Podocytes are highly specialized epithelial cells with a large cell body and elaborate foot processes that surround the glomerular capillaries. Interdigitation of foot processes between adjacent podocytes form the filtration slit, functioning as the final layer of the filtration barrier impeding the passage of macromolecules into the urine. Podocytes are terminally differentiated and have exited the cell cycle. Following injury, podocytes are unable to replicate; therefore, most glomerular diseases, including focal segmental glomerular sclerosis (FSGS) and diabetic kidney disease (DKD) are associated with podocyte loss (1, 2). Decline in glomerular podocyte density leads to scar formation, causing a decrease in glomerular filtration (3, 4).
Unlike other glomerular diseases, collapsing glomerulopathy (CGN) presents with a distinct histological injury pattern. CGN is characterized by podocyte dedifferentiation, proliferation, and subsequent collapse of the glomerular tuft. Clinically, this injury pattern is associated with a rapid loss of renal function and poor therapeutic response. The pathogenesis of CGN is not well understood. It is best described in the context of HIV infection, but mitochondrial gene mutations and different toxins can also result in this injury pattern (5, 6).
Although constituting only 0.5% of body mass, kidneys consume 10% of the oxygen by the human body. Mitochondrial dysfunction has increasingly been recognized in patients and animal models of chronic kidney disease (CKD). Mutations in CoQ10 biosynthetic genes, such as COQ6, COQ2, and prenyl diphosphate synthase subunit 2 (PDSS2) have been shown to cause glomerulosclerosis due to mitochondrial dysfunction. Indeed, CoQ10 supplementation ameliorated proteinuria and renal disease in a child with nephrotic syndrome caused by mitochondrial mutation, indicating the critical role of mitochondrial dysfunction in glomerular disease (7–11). Metabolomic studies performed in urine samples suggest a potential acquired mitochondrial defect in patients with DKD (12).
The peroxisome proliferator-activated receptor γ coactivator-1α (PGC1α, encoded by the gene PPARGC1A) is a transcriptional coactivator that interacts with other transcriptional factors to regulate mitochondrial biogenesis. Decreased PGC1α expression, mitochondrial loss, and defective mitochondrial function have been described and thought to contribute to various metabolic diseases including heart failure, diabetes, and Parkinson disease (13). Previous studies proposed that Tug1, AMPK, and KLF6 regulate podocyte health and glomerulosclerosis by altering PGC1α expression (14). PGC1α loss was proposed to be the key contributor of mitochondrial dysfunction in renal epithelial cells including podocytes. Transgenic expression of PGC1α in tubule cells can protect mice from development of acute kidney disease and CKD (15).
This study aimed to directly address the role of PGC1α in podocytes using in vivo and in vitro systems. We found that while PGC1α enhances mitochondrial biogenesis and respiratory capacity, excessive PGC1α induces podocyte proliferation, leading to CGN.
Results
Decreased PGC1α expression and mitochondrial transcripts in DKD glomeruli.
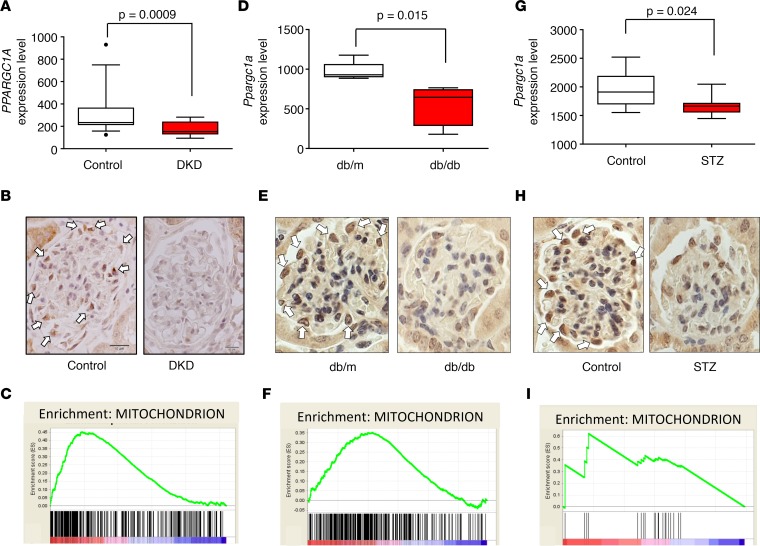
Gene expression changes of microdissected human glomerular samples were analyzed via microarrays (16). Healthy kidney samples (n = 14) were compared to samples obtained from patients with DKD (n = 7). We found that PPARGC1A transcript level was significantly lower in DKD glomeruli (P = 0.0009) when compared with controls (Figure 1A). Protein expression was examined by immunohistological staining. In glomeruli, we found that PGC1α protein expression was highest in podocyte nuclei. In line with the transcriptional changes, PGC1α protein expression was also lower in DKD samples (Figure 1B). As PGC1α regulates mitochondrial biogenesis and function, next we performed gene set enrichment analysis. We found that the expression of mitochondrial genes was significantly decreased in DKD samples (Figure 1C), suggesting decreased PGC1α transcriptional activity.
Figure 1. Glomerular PGC1α expression and mitochondrial transcript abundance in diabetic glomeruli.
(A) Glomerular PPARGC1A expression in diabetic kidney disease patients and controls. Box-and-whisker plots depict the median (line within box), 2.5–97.5 percentile (whiskers), and first and third quartiles (bottom and top of box) (n = 21). Significance evaluated by unpaired t test. (B) Representative PGC1α immunostaining of human kidneys. Arrows indicate positive PGC1α staining in podocytes of control samples. Scale bars: 10 μm. (C) Gene set enrichment analysis shows that mitochondrial gene transcript abundance is lower in diabetic human glomeruli compared with control samples. (D) Glomerular Ppargc1a mRNA expression level in db/db and control mice (n = 10). (E) Representative PGC1α immunostaining of db/db and control mice. (F) Gene set enrichment analysis of mitochondrial gene transcript abundance in glomeruli of db/db and control mice. (G) Glomerular Ppargc1a mRNA expression level in streptozotocin-injected and control mice (n = 17). (H) Representative PGC1α immunostaining in streptozotocin-injected and control mice. (I) Gene set enrichment analysis of mitochondrial gene transcript abundance in glomeruli of streptozotocin-injected and control mice. PGC1α, peroxisome proliferator-activated receptor γ coactivator-1α; DKD, diabetic kidney disease; STZ, streptozotocin.
Next, we analyzed PGC1α in glomeruli of mouse DKD models. Mouse models represent early DKD stages. In agreement with the human data, we found that the Ppargc1a transcript level was lower in glomeruli (P = 0.015) (Figure 1, D and E) of a leptin receptor–mutant db/db model of type 2 diabetes. Similarly, the Ppargc1a level was also lower in glomeruli of streptozotocin-induced type 1 diabetic mice (Figure 1, G and H). Gene set enrichment analysis indicated a loss of mitochondrial transcripts (Figure 1, F and I). Taken together, these results show that PGC1α and mitochondrial transcript levels were lower in glomeruli of patients and mouse models with DKD.
TGF-β regulates PGC1α levels in podocytes.
Several factors have been proposed to contribute to podocyte dysfunction in DKD, including high glucose, LPS, and dysregulated cytokine levels (TGF-β, TNF-α, VEGF, and VEGF). To explore the role of these potential mediators in regulating PGC1α expression, we cultured podocytes in the presence and absence of these factors. In our experiments, glucose, TNF-α, VEGF, and LPS did not influence PGC1α levels in podocytes. TGF-β, a key profibrotic cytokine, decreased PGC1α expression (Supplemental Figure 1; supplemental material available online with this article; https://doi.org/10.1172/jci.insight.92930DS1). This is consistent with previously described binding of Smad3 to the PPARGC1A enhancer region (15). Increased TGF-β levels observed in DKD samples might play a role in lowering PGC1α expression in DKD glomeruli.
Increasing PGC1α levels in podocytes causes albuminuria and renal failure.
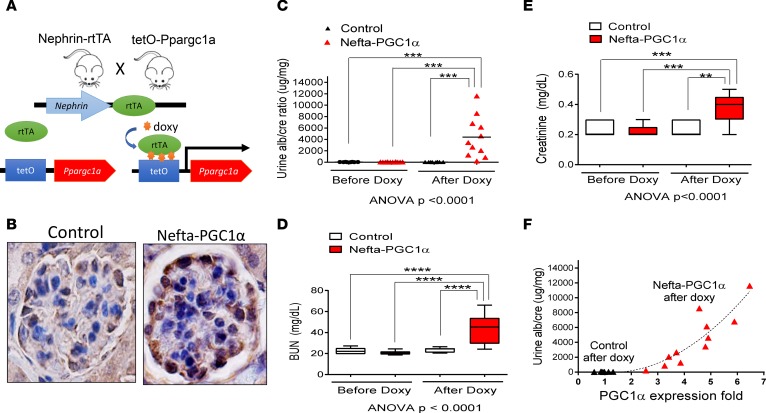
Given the decrease in PGC1α expression in DKD, we next examined whether restoring PGC1α levels can be protective. We generated mice with podocyte-specific inducible PGC1α expression by breeding nephrin-rtTA (Nefta) mice (17), which express the rtTA transactivator specifically in podocytes, with tetO-Ppargc1a animals (18), in which the Ppargc1a gene is under the control of a doxycycline-responsive promoter element. Double-transgenic mice (Nefta-PGC1α) were born at the expected Mendelian frequency and appeared healthy without evidence of renal histological abnormalities or albuminuria. To induce transgene expression, mice were placed on doxycycline-containing food starting at 4 weeks of age (Figure 2A). Single-transgenic littermates served as controls. PGC1α immunostaining confirmed the successful transgene expression in podocytes (Figure 2B). Kidney function measurement showed that Nefta-PGC1α mice developed albuminuria as early as 7 days after doxycycline induction (Figure 2C). Serum biochemical analysis indicated significant azotemia evidenced by elevated blood urea nitrogen (BUN) and creatinine levels (Figure 2, D and E). We observed significant heterogeneity in phenotype severity and timing. Transcript analysis of PGC1α by quantitative PCR (qPCR) indicated a strong positive correlation between albuminuria and glomerular PGC1α levels (Figure 2F). We titrated doxycycline chow amount to control PGC1α transgene expression in the Nefta-PGC1α mice, and found that doubling the PGC1α level was not associated with albuminuria during the 16-week observation period. We also made these animals diabetic via low-dose streptozotocin injection and found that podocyte-specific PGC1α-transgenic mice were not protected from diabetes-induced albuminuria (Supplemental Figure 2).
Figure 2. Increasing PGC1α levels in podocytes leads to proteinuria and renal failure.
(A) Breeding scheme for generating podocyte-specific PGC1α-transgenic mice. (B) Representative PGC1α immunostaining in control and Nefta-PGC1α mouse glomeruli. Scale bar: 10 μm. (C) Urine albumin/creatinine ratio in control and Nefta-PGC1α mice (n = 9–13 per group). (D and E) Serum blood urea nitrogen (BUN) and creatinine levels of control and Nefta-PGC1α mice, 2 weeks after initiation of doxycycline-containing food. Box-and-whisker plots show the median (line within box), upper and lower quartiles (bounds of box), and minimum and maximum values (whiskers). **P < 0.01, ***P < 0.001, ****P < 0.0001 by 1-way ANOVA with post-hoc analysis. (F) Correlation between PGC1α expression and urine albumin/creatinine ratio. Nefta, nephrin-rtTA; PGC1α, peroxisome proliferator-activated receptor γ coactivator-1α.
In summary, podocytes have a very narrow PGC1α tolerance. Mice with podocyte-specific inducible PGC1α expression developed albuminuria and azotemia. The phenotype strongly correlated with transgene expression.
PGC1α increases mitochondrial biogenesis and function.
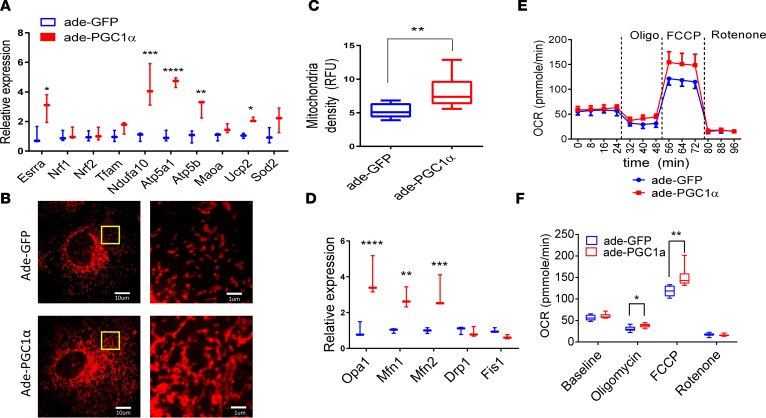
To understand the mechanism of PGC1α-induced podocyte dysfunction, we used an adenoviral system to increase PGC1α levels of immortalized cultured podocytes. When compared with GFP control adenovirus, PGC1α increased the expression of mitochondrial genes, including Esrra, Ndfua10, Atp5a, Atp5b, and UCP2 (Figure 3A). Next, we examined mitochondrial structure and content by Mitotracker staining. Representative Mitotracker images of control and PGC1α-expressing podocytes are shown on Figure 3B. Overall, we observed that PGC1α significantly increased mitochondrial density (Figure 3C). In addition, we found that mitochondria formed long tubular networks following PGC1α expression when compared with control cells that contained mostly short, oval-shaped mitochondria (Figure 3B). Mitochondria are highly dynamic organelles that constantly undergo fission (fragmentation) and fusion. Next, we analyzed expression of genes that regulate mitochondrial dynamics. Transcript levels of genes that regulate mitochondrial fusion including Opa1, Mfn1, and Mfn2 were significantly increased in PGC1α podocytes. Expression of genes that mediate mitochondrial fission, such as Drp1 and Fis1, were not influenced by increased PGC1α levels (Figure 3D); these observations indicate a PGC1α-induced shift of mitochondrial dynamics towards fusion in podocytes.
Figure 3. PGC1α increase mitochondrial biogenesis, mitochondrial fusion, and mitochondrial respiratory capacity in vitro.
(A) Expression of genes involved in mitochondrial biogenesis and anti-ROS in control and PGC1α-expressing podocytes. Relative expression of estrogen-related receptor α (Esrra), nuclear respiratory factor 1 (Nrf1), Nrf2, transcription factor A mitochondrial (Tfam), ubiquinone oxidoreductase subunit A10 (Ndufa10), ATP synthase subunit α (Atp5a), ATP synthase subunit β (Atp5b), monoamine oxidase A (Maoa), uncoupling protein 2 (Ucp2), and superoxide dismutase 2 (Sod2) was evaluated. (B) A representative images of Mitotracker fluorescence staining in control and PGC1α-expressing podocytes. Scale bars: 10 μm (left) and 1 μm (higher magnification, right). (C) Mitochondrial density quantified by Mitotracker fluorescence (n = 10 per group). Box-and-whisker plots depict the median (line within box), upper and lower quartiles (bounds of box), and minimum and maximum values (whiskers). (D) Expression of genes involved in mitochondrial fusion and fission in control and PGC1α-expressing podocytes. Optic atrophy 1 (Opa1), mitofusin 1 (Mfn1), Mfn2, dynamin-related protein 1 (Drp1), and mitochondrial fission 1 (Fis1) were evaluated. (E and F) PGC1α increases the oxygen consumption rate after added ATP synthase inhibitor oligomycin and electron transport chain accelerator FCCP; each data point represents the mean and SD (n = 20 per group). *P ≤ 0.05, **P ≤ 0.01, ***P ≤ 0.001, ****P ≤ 0.0001 by unpaired t tests with Bonferroni correction or 1-way ANOVA with post-hoc analysis. Ade, adenovirus; FCCP, p-trifluoromethoxy carbonyl cyanide phenyl hydrazone; PGC1α, peroxisome proliferator-activated receptor γ coactivator-1α.
We then characterized mitochondrial function using the Seahorse Bioscience XF24 Extracellular Flux Analyzer. Control cells and PGC1α-expressing cells had a similar baseline oxygen consumption rate (OCR). The ATP synthesis inhibitor oligomycin decreased OCR to a lesser degree in PGC1α-expressing cells, suggesting a higher rate of proton leak. The maximal respiratory capacity, analyzed by electron transport chain accelerator p-trifluoromethoxy carbonyl cyanide phenyl hydrazone (FCCP) administration, on the other hand, was significantly higher in PGC1α-expressing cells (Figure 3, E and F). We did not observe differences in ATP levels when PGC1α-expressing podocytes were compared with controls (data not shown). Expression of the antioxidant enzyme Ucp2 was increased (Figure 3A). We did not detect significant differences in ROS levels in PGC1α-expressing podocytes (data not shown).
PGC1α alters podocyte energy source preference.
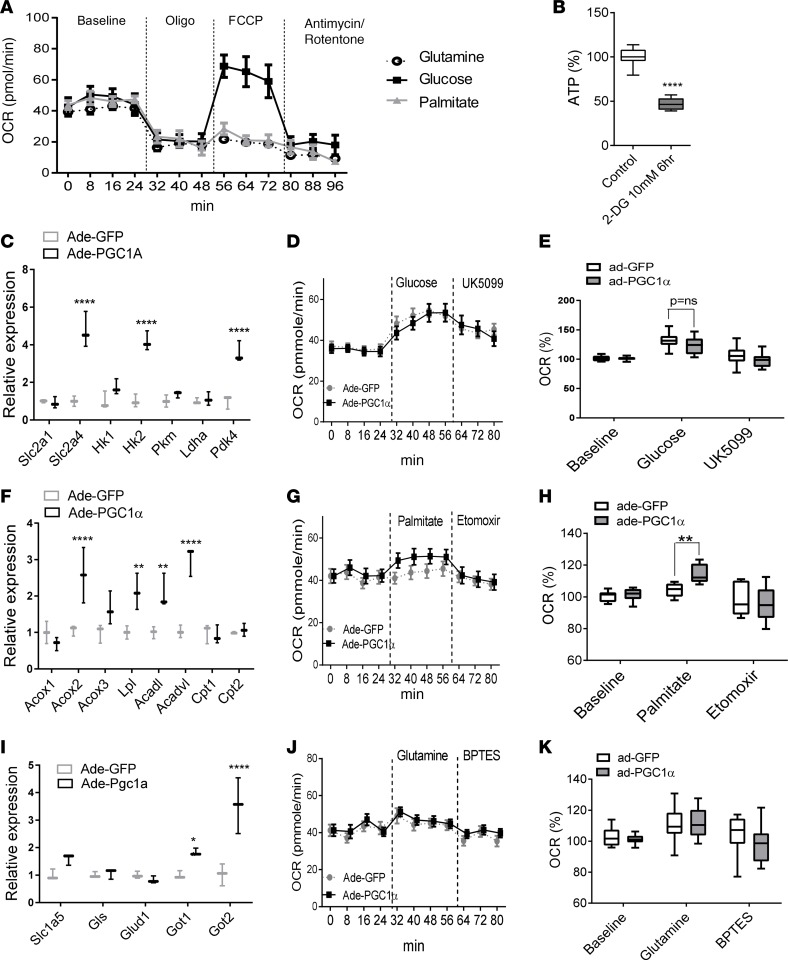
Cardiomyocytes and kidney tubular cells are high-energy-demanding cells, and they preferentially use fatty acid as their energy source (15); however, the fuel preference of podocytes has not been clarified. We again used the Seahorse Bioscience XF24 Analyzer to study bioenergetics of podocytes cultured in different fuel–containing media. When compared with palmitate and glutamine, glucose resulted in a much higher increase in OCR in response to FCCP (Figure 4A). Consistent with these findings, blockade of glucose utilization by 2-deoxyglucose significantly suppressed ATP production in podocytes (Figure 4B), indicating that cultured podocytes preferentially use glucose as their energy source. To test the net effect of PGC1α on podocyte fuel preference, we first cultured cells in substrate-limiting medium for 24 hours, and then in medium containing either glucose, palmitate, or glutamine. Compared with control podocytes, cells expressing PGC1α had higher expression of glycolytic genes such as Slc2a4, Hk1, and Hk2. In addition, the transcript level of Pdk4 (the enzyme that inhibits pyruvate conversion to acetyl-CoA and promotes cellular utilization of fatty acids) (19) was also significantly higher (Figure 4C). We did not observe a significant increase in glucose-induced OCR when PGC1α-expressing and control cells were compared (Figure 4, D and E). While palmitate did not change the OCR of control podocytes, it significantly increased the OCR in PGC1α-expressing cells, which was sensitive to the carnitine palmitoyltransferase 1 (CPT-1) inhibitor etomoxir (Figure 4, G and H). Consistently, expression of genes involved in fatty acid oxidation such as Acox2, Acox3, Lpl, Acadl, and Acadvl (Figure 4F) were significantly higher in PGC1α-expressing cells. Glutamine did not alter the OCR in control or PGC1α-transfected podocytes (Figure 4, J and K), even though we observed a slight increase in expression of cell membrane amino acid transporter (Slc1a5) and aspartate aminotransferase (Got1 and Got2) (Figure 4I). Taken together, these data indicate that podocytes preferentially use glucose, although PGC1α slightly shifted cells toward fatty acid utilization.
Figure 4. PGC1α alters mitochondrial fuel preference in podocytes.
(A) Oxygen consumption rate (OCR) of podocytes measured by Seahorse XF. Podocytes were cultured in various energy substrates (Seahorse XF Base Medium supplemented with glucose, palmitate, or glutamine). OCRs were measured at baseline, following 1 μM oligomycin, 3 μM FCCP, and 1 μM antimycin/rotenone (n = 5 per group). (B) ATP concentration in control and 2-deoxyglucose–treated podocytes (n = 10). Box-and-whisker plots show the median (line within box), upper and lower quartiles (bounds of box), and minimum and maximum values (whiskers). (C) Expression of genes involved in glycolysis in control and PGC1α-expressing podocytes. Glucose transporter 1 (Slc2a1), Slc2a4, hexokinase 1 (Hk1), Hk2, pyruvate kinase isozymes M1/M2 (Pkm), lactate dehydrogenase A (Ldha), and pyruvate dehydrogenase kinase 4 (Pdk4) were evaluated. (D and E) OCR in glucose/UK5099–treated podocytes (n = 20 per group). (F) Expression of genes involved in fatty acid oxidation in control and PGC1α-expressing podocytes. Acyl-CoA oxidase 1 (Acox1), Acox2, Acox3, lipoprotein lipase (Lpl), acyl-CoA dehydrogenase long chain (Acadl), acyl-CoA dehydrogenase very long chain (Acadvl), carnitine palmitoyltransferase I (Cpt1), and Cpt2 were evaluated. (G and H) OCR in palmitate/etomoxir–treated podocytes (n = 20 per group). (I) Expression of amino acid transporter in control and PGC1α-expressing podocytes. Neutral amino acid transporter B (Slc1a5), glutaminase (Gls), glutamate dehydrogenase 1 (Glud1), glutamic-oxaloacetic transaminase 1 (Got1), and Got2 were evaluated. (J and K) OCR in glutamine/BPTES–treated podocytes (n = 20 per group). *P ≤ 0.05, **P ≤ 0.01 by unpaired t test with Bonferroni correction or 1-way ANOVA with post-hoc analysis. ns, not significant; Ade, adenovirus; BPTES, bis-2-(5-phenylacetamido-1,3,4-thiadiazol-2-yl)ethyl sulfide; FCCP, p-trifluoromethoxy carbonyl cyanide phenyl hydrazone; PGC1α, peroxisome proliferator-activated receptor γ coactivator-1α.
RNA sequencing analysis indicates that PGC1α promotes cell cycle reentry and potentially aberrant mitochondrial assembly.
PGC1α (being a transcriptional coactivator) can activate multiple downstream pathways including HIF, Notch, Wnt, and PDGF (20–23). Many of these pathways have been proposed to mediate the beneficial or deleterious effects of PGC1α in different cell types (24, 25). We have tested the regulation of genes by comparing their expression in control and PGC1α-transfected podocytes. We did not observe significant and consistent differences in transcript levels when these pathways were analyzed (Supplemental Figure 3).
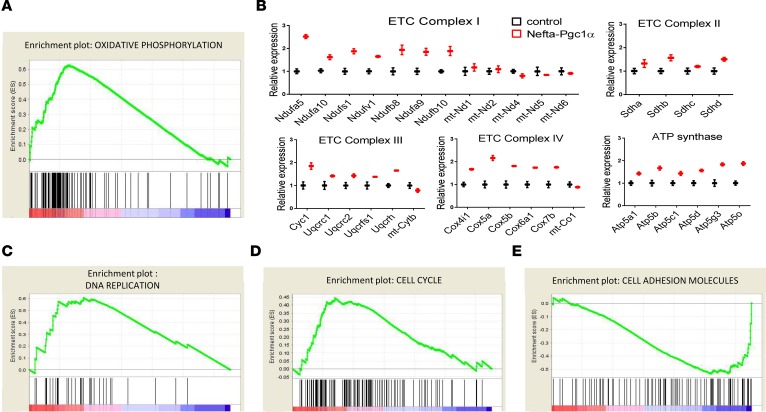
To better understand the mechanism of PGC1α-induced phenotypic changes in podocytes, we performed RNA sequencing analysis of glomeruli isolated from control and Nefta-PGC1α–transgenic animals. Glomerular isolation and sequencing data processing are detailed in the Methods section. Stringent statistical comparison indicated 460 differentially expressed transcripts between control and transgenic mice (Supplemental Table 1). Next, we performed gene set enrichment analysis to identify key dysregulated pathways. Consistent with our cell biological studies, glomeruli of the Nefta-PGC1α mice showed enrichment for genes involved in oxidative phosphorylation (Figure 5A). The RNA sequencing analysis also indicated that mitochondrial assembly might be impaired in PGC1α-transgenic podocytes. The expression level of most electron transport chain subunits was about 2-fold higher in Nefta-PGC1α–transgenic mice compared with controls. On the other hand, transcripts encoded by the mitochondrial genome (mt-Nd1, mt-Nd2, mt-Nd4, mt-Nd 5, and mt-Nd6 in complex I, mt-Cybt in complex III, and mt-Cox1 in complex IV) were not proportionally increased (Figure 5B). Expression of genes involved in DNA replication and cell cycle pathways were higher in PGC1α-transgenic glomeruli (Figure 5, C and D). Transcript levels of genes involved in cell adhesion were decreased in Nefta-PGC1α–transgenic animals (Figure 5E).
Figure 5. RNA sequencing analysis indicates that PGC1α induces aberrant mitochondrial assembly and promotes cell cycle re-entry.
(A) Gene set enrichment analysis of oxidative phosphorylation gene transcript abundance in glomeruli of control and Nefta-PGC1α mice. (B) Relative transcript levels of electron transport chain (ETC) subunits in glomeruli of control and Nefta-PGC1α mice. (C) Gene set enrichment analysis of DNA replication gene transcript abundance. (D) Gene set enrichment analysis of cell cycle gene transcript abundance. (E) Gene set enrichment analysis of cell adhesion molecule transcript abundance. Nefta, nephrin-rtTA; PGC1α, peroxisome proliferator-activated receptor γ coactivator-1α.
PGC1α induces podocyte proliferation in vitro.
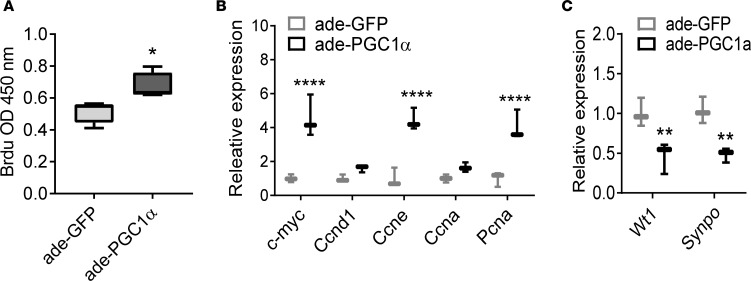
Differences in expression of cell cycle genes, observed by RNA sequencing, prompted us to examine podocyte proliferation. In cultured podocytes, PGC1α transfection increased BrdU incorporation (Figure 6A), indicating increased cell proliferation. Consistently, the expression of genes associated with cell proliferation, such as c-Myc, Ccne, and Pcna were also increased (Figure 6B). In cultured podocytes, PGC1α also resulted in a reduction in expression of podocyte-specific genes such as Wt1 and Synpo, indicating dedifferentiation (Figure 6C). We found that blocking fatty acid oxidation by etomoxir was not able to attenuate PGC1α-induced proliferation and de-differentiation. Therefore, mitochondrial fuel shift may not be the main cause of PGC1α-induced cell cycle reentry of podocytes (Supplemental Figure 4).
Figure 6. PGC1α induces podocyte proliferation in vitro.
(A) BrdU incorporation in cultured podocytes following control (GFP) and PGC1α adenoviral infection (n = 10 per group). Box-and-whisker plots depict the median (line within box), upper and lower quartiles (bounds of box), and minimum and maximum values (whickers). **P < 0.01 by Student’s t test. (B) Expression of genes involved in cell proliferation in control and PGC1α-expressing podocytes. c-Myc, cyclin D1 (Ccnd1), cyclin E (Ccne), cyclin A (Ccna), and proliferating cell nuclear antigen (Pcna) were evaluated. (C) Podocyte-specific gene expression in control and PGC1α-expressing podocytes. Wilms tumor 1 (Wt1) and synaptopodin (Synpo) were evaluated.*P ≤ 0.05, **P ≤ 0.01 by unpaired t test with Bonferroni correction. Ade, adenovirus; PGC1α, peroxisome proliferator-activated receptor γ coactivator-1α.
Podocyte-specific PGC1α expression induces collapsing glomerulosclerosis in vivo.
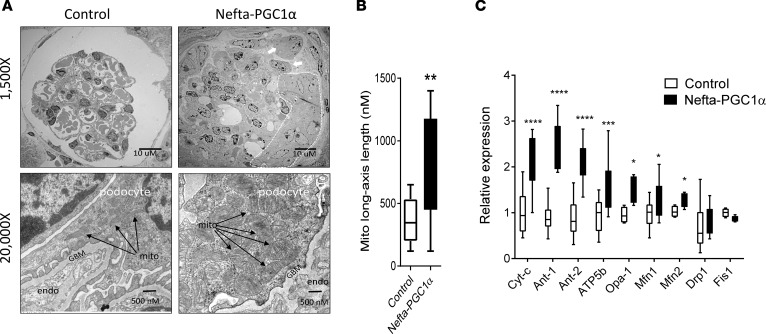
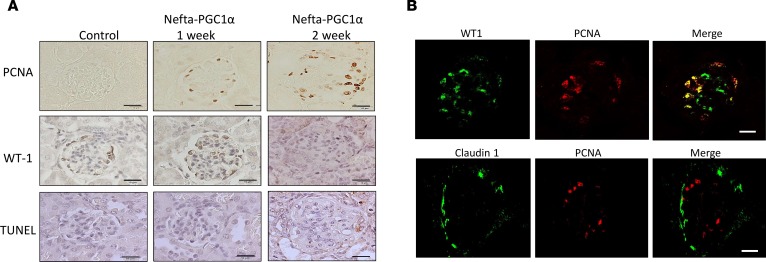
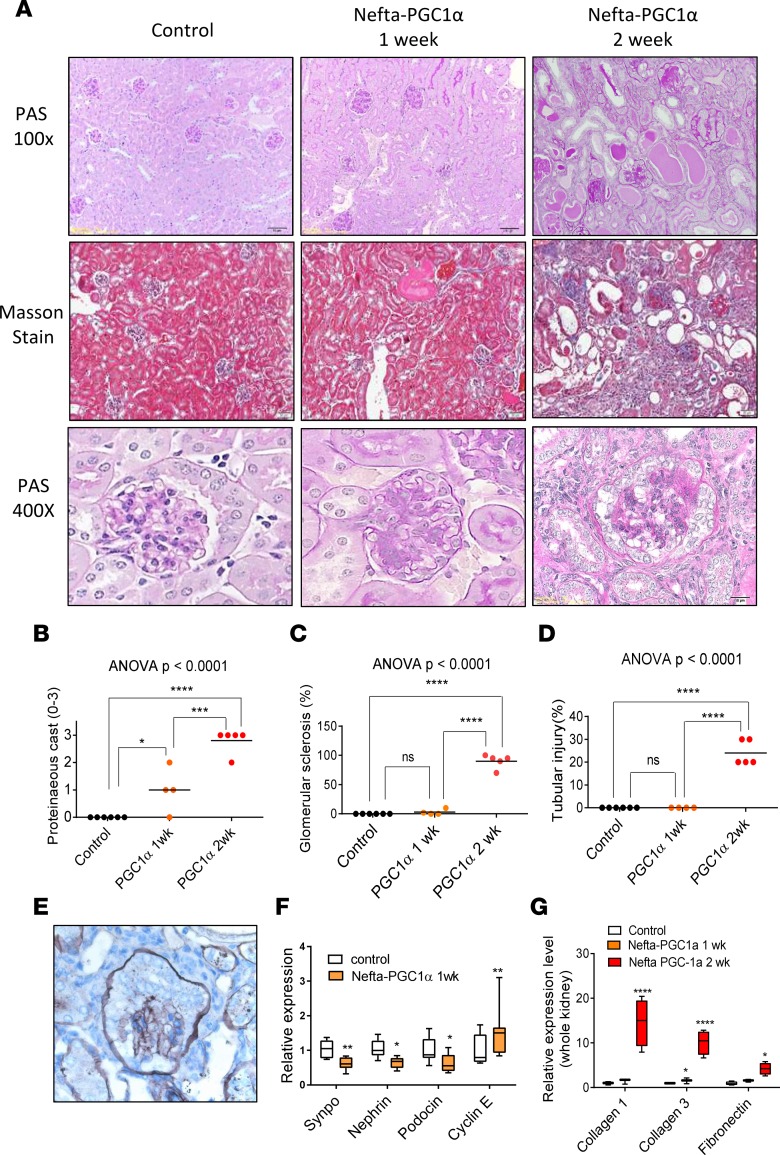
Transmission electron microscopic (TEM) examination of the Nefta-PGC1α mice showed numerous giant mitochondria in podocytes. The cristae of these large mitochondria were generally intact. Occasionally, we also observed binuclear podocytes, indicative of podocyte proliferation. Capillary tuft collapse and podocyte hypertrophy were also observed in TEM images (Figure 7, A and B). qPCR analysis of isolated glomeruli confirmed the increase in expression of electron transport chain (Ndufa10, Atp5b) and mitochondrial fusion (Opa1, Mfn1) genes (Figure 7C). Immunohistochemical staining analysis revealed lack of TUNEL-positive (apoptotic), but a decrease in WT1-positive cell numbers in glomerular cells. There was a significant increase in proliferating cell nuclear antigen–positive (PCNA-positive) cells in Nefta-PGC1α mice. PCNA-positive cells were located at the edge of glomeruli, likely indicating podocyte proliferation (Figure 8A). Immunofluorescence staining indicated that PCNA-positive cells were positive for podocyte marker WT1 but negative for parietal cell marker claudin 1 (Figure 8B). Light microscopic analysis, at the time of development of albuminuria, revealed marked structural changes in Nefta-PGC1α glomeruli. Glomeruli showed global and segmental glomerulosclerosis, podocyte hyperplasia, hypertrophy with pseudocrescent formation, and focal podocyte hyaline droplets. Tubules appeared dilated with proteinaceous cast and severe tubule-interstitial fibrosis (Figure 9, A–D). Silver staining of Nefta-PGC1α kidneys showed marked podocyte hypertrophy and hyperplasia, which occupied the entire Bowman’s space. The glomerular tufts were compressed without capillary lumens (Figure 9E). qPCR analysis, at early time points, indicated a decrease in levels of podocyte differentiation markers (Nphs1, Nphs2, and Synpo) and an increase in proliferation gene Ccne level (Figure 9F). PGC1α did not alter VEGF-a mRNA or protein expression in podocytes in vivo (Supplemental Table 1 and Supplemental Figure 5; see complete unedited blots in the supplemental material). Expression of profibrotic genes such as Col1a1, Col3a1, and Fn was increased at later stages (Figure 9G). Overall, the light microscopic and TEM analyses showed strong resemblance to human CGN, which is characterized by podocyte proliferation and dedifferentiation.
Figure 7. Excessive PGC1α alters mitochondrial properties in vivo.
(A) Representative electron microscopic images of glomeruli of control and Nefta-PGC1α–transgenic mice. Note podocyte hypertrophy with extensive glomerular capillary collapse in the Nefta-PGC1α mice. Arrowheads indicate collapsed glomerular capillary lumens; white arrows indicate binuclear podocytes; the dashed line area indicates a pseudocrescent. Higher magnification image shows a podocyte with numerous giant mitochondria and foot process effacement. Black arrows indicate mitochondria. GBM, glomerular basement membrane; endo, endothelial cell; mito, mitochondria. (B) Quantification of mitochondrial size in control and Nefta-PGC1α podocytes. Box-and-whisker plots depict the median (line within box), 2.5–97.5 percentile (whiskers), and first and third quartiles (bottom and top of box). **P < 0.01 compared with control by Student’s t test. (C) Mitochondrial gene expression in control and Nefta-PGC1α mice glomeruli (n = 8–9 per group). Ubiquinone oxidoreductase subunit A10 (Ndufa10), ATP synthase subunit β (Atp5b), optic atrophy 1 (Opa1), mitofusin 1 (Mfn1), Mfn2, dynamin-related protein 1 (Drp1), and mitochondrial fission 1 (Fis1) were evaluated. *P ≤ 0.05, **P ≤ 0.01, ***P ≤ 0.001, ****P ≤ 0.0001 by unpaired t test with Bonferroni correction. Nefta, nephrin-rtTA; PGC1α, peroxisome proliferator-activated receptor γ coactivator-1α.
Figure 8. PGC1α induces podocyte proliferation in vivo.
(A) Proliferating cell nuclear antigen (PNCA), Wilms tumor 1 (WT1), and TUNEL staining in control and Nefta-PGC1α mouse glomeruli. Scale bars: 10 μm. (B) Representative immunofluorescence staining of proliferating cell marker PCNA, podocyte marker WT1, and parietal epithelial cell marker claudin 1 in Nefta-PGC1α mice. Nefta, nephrin-rtTA; PGC1α, peroxisome proliferator-activated receptor γ coactivator-1α.
Figure 9. Nefta-PGC1α mice develop collapsing glomerulosclerosis.
(A) Periodic acid–Schiff (PAS) and Masson staining of kidney sections after starting doxycycline-containing food. (B) Quantification of proteinaceous cast (1–4) in control and Nefta-PGC1α mice. (C) Quantification of glomerular sclerosis. (D) Quantification of tubular injury. (E) Representative silver staining of Nefta-PGC1α glomeruli. (F) qPCR analysis of podocyte differentiation markers and cyclin E, 1 week after doxycycline containing food (n = 8–9 per group). Synaptopodin (Synpo), nephrin (Nphs1), podocin (Nphs2), cyclin E (Ccne) were evaluated. Box-and-whisker plots depict the median (line within box), upper and lower quartiles (bounds of box), and minimum and maximum values (whiskers). (G) Transcript levels of genes associated with fibrosis at different time points. Collagen type I α 1 chain (Col1a1), collagen type 3 α 1 chain (Col3a1), and fibronectin (Fn) were evaluated. *P ≤ 0.05, **P ≤ 0.01,***P ≤ 0.001, ****P ≤ 0.0001 by unpaired t test with Bonferroni correction or 1-way ANOVA with post-hoc analysis. ns, not significant; Nefta, nephrin-rtTA; PGC1α, peroxisome proliferator-activated receptor γ coactivator-1α.
Discussion
While PGC1α is abundantly expressed in the kidney, the role and regulation of PGC1α are still poorly understood. PGC1α is a main transcriptional regulator of mitochondrial biogenesis and is highly expressed in mitochondria-rich tissues such as liver, muscle, and kidney. The cellular energy demand is a strong regulator of PGC1α expression. In the liver, PGC1α is induced by fasting; in brown adipose tissue, it is induced by cold temperature; and in skeletal muscle and heart, it is induced by exercise (13).
Impaired PGC1α expression and mitochondrial loss in podocytes have been observed in glomerular disease (12). Recently, the role of several upstream regulators of PGC1α has been shown to contribute to DKD development. The lncRNA Tug1 (26) and AMPK (27) have been shown to decrease PGC1α levels and induce DKD development. Overexpression of Sirt1 has been reported to attenuate aldosterone-induced nephropathy in a rodent model by deacetylating PGC1α and increasing its activity (28). Our analysis also indicated that PGC1α levels are decreased in glomeruli of patients and mice with DKD. All these observations support the hypothesis that a reduced level of PGC1α in podocytes contributes to DKD development.
On the other hand, the direct role of reduced PGC1α levels in glomerulosclerosis development has not been demonstrated. Global-PGC1α-knockout mice do not develop glomerulosclerosis and CKD (29). The role of PGC1α has been proposed based on in vivo and in vitro overexpression studies (15). Under these circumstances, PGC1α increased the expression of multiple metabolic genes and mitochondrial function. These observations only support the potential benefit of improving bioenergetics, but not directly PGC1α. There are several other transcription factors in the kidney those expression is also reduced in glomerulosclerosis and might have overlapping functions with PGC1α (30–34). For this reason, here we performed studies to directly address the role of PGC1α in podocytes.
Our studies directly analyzed the role of PGC1α in podocytes by cell type–specific gene targeting. We found that podocytes are unable to tolerate increased PGC1α levels. Podocytes show similarities to cardiomyocytes in this context. Although PGC1α expression and mitochondrial biogenesis are decreased in heart failure patients and mice (35), induction of PGC1α in mouse hearts resulted in alterations in mitochondrial morphology and heart failure (18, 36, 37). In podocytes, the phenotype development was dose dependent and even a modest increase in PGC1α levels resulted in kidney failure. Podocytes therefore seem to be similar to cardiomyocytes, another postmitotic cell type that is highly sensitive to PGC1α levels (37). Another possible explanation, although very unlikely, could be that postmitotic cells such as podocytes and cardiomyocytes are more sensitive to artificial overexpression of any protein, not just PGC1α.
Similar to cancer cells, metabolic reprogramming by PGC1α seems to alter cell fate in podocytes. Increased PGC1α expression resulted in podocyte proliferation and dedifferentiation. Recent studies described a similar role for PGC1α in different cancer types (38, 39). Mitochondria are tailored to meet the metabolic and signaling needs of each cell. The metabolic and morphological diversity of mitochondria in different cell types is a result of mitochondrial composition, such as tissue-specific differences in expression of oxidative phosphorylation enzymes (40). Changes in mitochondrial intrinsic properties can affect cell characteristics; for example, mitochondrial alterations can directly determine stem cell differentiation (41). There is accumulating evidence showing that PGC1α not only activates mitochondrial biogenesis, but also regulates mitochondrial composition and dynamics. For example, skeletal muscle–specific overexpression of PGC1α increases electron transport chain subunit V-α, ANT1, and UCP-2 (42–44), but decreases UCP3 (43), leading to a fast-twitch type II to slow-twitch type 1 fiber conversion (45). These studies suggest that mitochondria do more than passively adjust to the cell’s need; in contrast, mitochondria might be one of the primary drivers of cell plasticity. Our studies are in line with these observations, and suggest that PGC1α regulates cell fate of podocytes and is able to induce proliferation of normally postmitotic cells.
It is also important to highlight the accumulating evidence supporting the role of mitochondrial dysfunction in CGN development. The number of mitochondria per cell is closely regulated within a given cell type (46). However, accumulation of dysmorphic mitochondria in podocytes has been shown in patient samples with CGN, including bisphosphonate-induced CGN (47–50). In mouse models, prenyltransferase-like mitochondrial protein (Pdss2) mutation leads to dysmorphic mitochondrial accumulation in podocytes and CGN development (51, 52). While PGC1α and podocytes are lost in DKD and FSGS, it seems that CGN is characterized by increased mitochondrial number, suggesting that an overactive PGC1α level may be associated with CGN development.
CGN is a rare disease and therefore it is very difficult to collect enough human samples to perform a comprehensive analysis. A dataset including 6 human CGN glomerular samples (53) clearly showed a trend of increased expression of PGC1α and its downstream target genes (Supplemental Figure 6). Our model demonstrated that excessive PGC1α activity in podocytes phenocopies pathological signatures of CGN, including mitochondrial number increase, mitochondrial morphology change, podocyte proliferation, glomerular tuff collapse, and rapid onset of renal failure, suggesting that excessive PGC1α may be involved in the pathological mechanism of CGN. Future studies shall determine how PGC1α alters mitochondrial properties and changes cell fate (Supplemental Figure 7).
In conclusion, the work presented here shows that in diabetic glomeruli, podocyte PGC1α and mitochondrial gene expression is decreased. Podocytes have a narrow PGC1α tolerance and excessive PGC1α alters mitochondrial properties, which induces podocyte proliferation, leading to a CGN-like phenotype.
Methods
Glomerular gene expression analysis.
Microarray data from human diabetic nephropathy samples (GSM1146201–1146207) and tumor nephrectomy without CKD/diabetes mellitus (GSM1146215–1146222, 1146229-1146234) were compared (16). Type 2 diabetes db/db mice were compared with their nondiabetic db/m littermates (GSM833993 –834002), and low-dose streptozotocin–induced type 1 diabetic DBA mice were compared with nondiabetic littermates (GSM834015- 834031) (54). The data weree processed using Bioconductor R package and normalized using the RMA method. Gene set enrichment analysis was performed for human (diabetic nephropathy vs. normal part of tumor nephrectomy) and mouse (db/db vs. db/m; streptozotocin vs. control) samples using the default option. Glomeruli were isolated using manual microdissection or Dynabead perfusion and magnetic separation (55) in human and mouse samples, respectively.
Animals.
Nefta mice carrying the nephrin-rtTA transgene were obtained from Jeffrey Miner (Washington University, St. Louis, Missouri, USA) (17). TetO-Ppargc1a–transgenic mice were purchased from The Jackson Laboratory (stock number 012387). Animals were on the FVB background. We crossed male tetO-Pgargc1a mice with female Nefta mice. Double-transgenic mice were identified by genomic PCR analysis. Mice were placed on doxycycline-containing chow (Bio Serv S3888) starting at 4 weeks of age. Type 1 diabetes was induced by daily intraperitoneal injections of streptozotocin (Sigma-Aldrich), 50 mg/kg for 5 days, in 6-week-old male mice (56). Only male mice were used in the study.
Urine albumin and blood biochemical analysis.
Mouse urine albumin concentration was quantified using an ELISA kit (Bethyl Laboratories) and normalized by creatinine concentration (Pointe Scientific). Serum BUN and creatinine were measured by i-STAT blood analyzer (Abbott).
Podocyte culture.
The conditional immortalized mouse podocyte line was cultured as described previously (57); all experiments were performed 14 days after thermos-shifting. To test the regulator of PGC1α, podocytes were stimulated either with TGF-β (2 ng/ml), high glucose (30 mg/ml), TNF-α (10 ng/ml), or VEGF (10 ng/ml) at different time points. Podocytes were incubated with an adenovirus encoding murine PGC1α or control GFP for 48 hours. Transfection efficiency was confirmed by GFP visualization, qPCR, and by Western blots.
Mitochondrial density.
Differentiated podocytes cultured in 96-well plates (2 × 10⁴ per well) were stained with MitoTracker Red FM (Thermo Fisher Scientific) according to the manufacturer’s instructions, and the mitochondrial density was read by a plate reader at 588/650 nm and presented as relative fluorescence units (RFU).
Oxygen consumption experiments and ATP assay.
Differentiated podocytes were seeded in an XF 24-well cell culture plate (Seahorse Bioscience) at 2 × 10⁴ cells per well and studied in Seahorse XF Base Medium supplemented with 5 mM glucose and 1 mM glutamine. Based on previous reports we used the ATP synthase inhibitor oligomycin (Agilent) (1 μM), uncoupling agent FCCP (Agilent) (3 μM), and complex I inhibitor antimycin/rotenone (Agilent) (1 μM) (58). For fuel preference experiments, cells were cultured in substrate-limited medium (0.5 mM glucose, 1 mM glutamine, 0.5 mM carnitine, 1% FBS) 24 hours before incubating the cells in glucose (10 mM) and mitochondrial pyruvate carrier inhibitor UK5099 (Sigma) (10 μM); palmitate (200 mM) and CTP-1 inhibitor etomoxir (Sigma) (40 μM); glutamine (10 mM) and glutaminase inhibitor bis-2-(5-phenylacetamido-1,3,4-thiadiazol-2-yl)ethyl sulfide (BPTES) (Sigma) (10 μM). The ATP concentration of cultured podocytes was measured using an ATP Fluorometric Assay Kit (BioVision) according to the manufacturer’s protocol.
qRT-PCR.
Mouse glomeruli were isolated by Dynabead perfusion as described previously (55). RNA was isolated from harvested cells and tissue using the RNeasy Mini Kit (Qiagen). RNA (1 μg) was reverse transcribed using the cDNA Archival Kit (Life Technologies), and qRT-PCR was run in the ViiA 7 System (Life Technologies) instrument using SYBR Green Master Mix and gene-specific primers. The data were normalized and analyzed using the ΔΔCt method. The primers used are listed in Supplemental Table 2.
RNA sequencing.
Mouse glomerular RNA quality was assessed with the Agilent Bioanalyzer 2100 and only samples with RIN scores above 7 were used for cDNA production. The library was prepared in the DNA Sequencing Core at UT Southwestern Medical Center (Dallas, Texas, USA). RNA (100 ng) was used to isolate poly(A)-purified mRNA using the Illumina TruSeq RNA Preparation Kit. Single-end 50-bp sequencing was performed in an Illumina HiSeq, and the annotated RNA counts (fastq) were calculated by Illumina’s CASAVA 1.8.2. Sequence quality was surveyed with FastQC. Adaptor and lower-quality bases were trimmed with TrimGalore. Reads were aligned to the Gencode mouse genome (GRCm38) using STAR-2.4.1d. Read counts for each sample were obtained using HTSeq-0.6.1 (htseq-count). DESeq2 was used to test for differential gene expression between control and transgenic groups. Gene set enrichment analysis was used to identify pathways enriched in the differentially expressed gene groups (59).
Cell proliferation assay.
Differentiated podocytes were cultured in low-serum (0.2% FBS) medium to fully imitate quiescent podocytes in vivo. A BrdU-based cell proliferation assay was performed according to the manufacturer’s instructions (EMD Millipore, catalog 2750).
Histology, immunohistochemistry, and TEM.
Histological changes of the kidney were examined by periodic acid–Schiff and Masson staining, and then quantified by a pathologist. Kidney sections were immunostained with primary antibodies against PGC1α (ab54481, Abcam), WT-1 (C-19, Santa Cruz), and PCNA (clone PC10, MAB424, EMD Millipore) after heat-induced antigen retrieval by 10 mM sodium citrate buffer (pH 6.0). Immunofluorescence double staining was performed with antibodies against PGC1α, WT-1, and claudin 1 (ab15098, Abcam) in OCT-embedded frozen sections. TUNEL staining of paraffin sections was used for detection of cell death (ApopTag kit, EMD Millipore). For TEM exam, mouse kidney cortex was fixed with 2.5% glutaraldehyde followed by 0.5% osmium tetroxide. Specimens were then series dehydrated and embedded into epoxy resin according to routine procedures. Ultrathin sections were stained with 2% uranyl acetate and 1% lead citrate. Sections were viewed by TEM and digitally recorded using a JEOL 1010 microscope.
Statistics.
Statistical analyses were performed using GraphPad Prism software. All values are expressed as mean and standard deviation or box-and-whisker plots. A 2-tailed Student’s t test was used to compare 2 groups. Bonferroni correction was applied for multiple comparisons. One-way ANOVA with post-hoc Tukey test was used to compare multiple groups. A P value less than 0.05 was considered statistically significant.
Study approval.
All experiments in animals were reviewed and approved by the Institutional Animal Care and Use Committee of the University of Pennsylvania, and were performed in accordance with the institutional guidelines.
Author contribution
SYL performed in vitro and in vivo experiments. JP and CQ generated and analyzed the microarray and RNAseq data. SHH helped with the mouse experiments. MBP helped with histopathological analysis. ZA generated the adenovirus and provided help and guidance. SYL and KS wrote the manuscript.
Supplementary Material
Acknowledgments
S.Y. Li received research support from Taipei Veterans General Hospital–National Yang-Ming University Excellent Physician Scientists Cultivation Program 104-V-A-003 and Ministry of Science and Technology R.O.C. MOST 104-2314-B-075-042-MY3. Work in the Susztak lab is supported by NIH grants R01 DK076077, DK087635, and DP3 DK108220.
Footnotes
Conflict of interest: The Susztak lab receives research support from Biogen, Boehringer Ingelheim, Celgene, GSK, Merck, Regeneron, and ONO Pharma.
Reference information:JCI Insight. 2017;2(14):e92930. https://doi.org/10.1172/jci.insight.92930.
Contributor Information
Szu-Yuan Li, Email: syli@vghtpe.gov.tw.
Jihwan Park, Email: jihwan.park724@gmail.com.
Chengxiang Qiu, Email: quorly@gmail.com.
Seung Hyeok Han, Email: anythingbox70@gmail.com.
Matthew B. Palmer, Email: Matthew.Palmer@uphs.upenn.edu.
Zoltan Arany, Email: zarany@mail.med.upenn.edu.
Katalin Susztak, Email: ksusztak@mail.med.upenn.edu.
References
- 1.Susztak K, Raff AC, Schiffer M, Böttinger EP. Glucose-induced reactive oxygen species cause apoptosis of podocytes and podocyte depletion at the onset of diabetic nephropathy. Diabetes. 2006;55(1):225–233. doi: 10.2337/diabetes.55.01.06.db05-0894. [DOI] [PubMed] [Google Scholar]
- 2.Sato Y, et al. Urine podocyte mRNAs mark progression of renal disease. J Am Soc Nephrol. 2009;20(5):1041–1052. doi: 10.1681/ASN.2007121328. [DOI] [PMC free article] [PubMed] [Google Scholar]
- 3.Reidy K, Kang HM, Hostetter T, Susztak K. Molecular mechanisms of diabetic kidney disease. J Clin Invest. 2014;124(6):2333–2340. doi: 10.1172/JCI72271. [DOI] [PMC free article] [PubMed] [Google Scholar]
- 4.Kato H, Susztak K. Repair problems in podocytes: Wnt, Notch, and glomerulosclerosis. Semin Nephrol. 2012;32(4):350–356. doi: 10.1016/j.semnephrol.2012.06.006. [DOI] [PMC free article] [PubMed] [Google Scholar]
- 5.Albaqumi M, Barisoni L. Current views on collapsing glomerulopathy. J Am Soc Nephrol. 2008;19(7):1276–1281. doi: 10.1681/ASN.2007080926. [DOI] [PubMed] [Google Scholar]
- 6.Albaqumi M, Soos TJ, Barisoni L, Nelson PJ. Collapsing glomerulopathy. J Am Soc Nephrol. 2006;17(10):2854–2863. doi: 10.1681/ASN.2006030225. [DOI] [PubMed] [Google Scholar]
- 7.Gasser DL, et al. Focal segmental glomerulosclerosis is associated with a PDSS2 haplotype and, independently, with a decreased content of coenzyme Q10. Am J Physiol Renal Physiol. 2013;305(8):F1228–F1238. doi: 10.1152/ajprenal.00143.2013. [DOI] [PMC free article] [PubMed] [Google Scholar]
- 8.Güçer S, et al. Focal segmental glomerulosclerosis associated with mitochondrial cytopathy: report of two cases with special emphasis on podocytes. Pediatr Dev Pathol. 2005;8(6):710–717. doi: 10.1007/s10024-005-0058-z. [DOI] [PubMed] [Google Scholar]
- 9.Ashraf S, et al. ADCK4 mutations promote steroid-resistant nephrotic syndrome through CoQ10 biosynthesis disruption. J Clin Invest. 2013;123(12):5179–5189. doi: 10.1172/JCI69000. [DOI] [PMC free article] [PubMed] [Google Scholar]
- 10.Mallipattu SK, et al. Krüppel-like factor 6 regulates mitochondrial function in the kidney. J Clin Invest. 2015;125(3):1347–1361. doi: 10.1172/JCI77084. [DOI] [PMC free article] [PubMed] [Google Scholar]
- 11.O’Toole JF. Renal manifestations of genetic mitochondrial disease. Int J Nephrol Renovasc Dis. 2014;7:57–67. doi: 10.2147/IJNRD.S37887. [DOI] [PMC free article] [PubMed] [Google Scholar]
- 12.Sharma K, et al. Metabolomics reveals signature of mitochondrial dysfunction in diabetic kidney disease. J Am Soc Nephrol. 2013;24(11):1901–1912. doi: 10.1681/ASN.2013020126. [DOI] [PMC free article] [PubMed] [Google Scholar]
- 13.Finck BN, Kelly DP. PGC-1 coactivators: inducible regulators of energy metabolism in health and disease. J Clin Invest. 2006;116(3):615–622. doi: 10.1172/JCI27794. [DOI] [PMC free article] [PubMed] [Google Scholar]
- 14.Li SY, Susztak K. The long noncoding RNA Tug1 connects metabolic changes with kidney disease in podocytes. J Clin Invest. 2016;126(11):4072–4075. doi: 10.1172/JCI90828. [DOI] [PMC free article] [PubMed] [Google Scholar]
- 15.Kang HM, et al. Defective fatty acid oxidation in renal tubular epithelial cells has a key role in kidney fibrosis development. Nat Med. 2015;21(1):37–46. doi: 10.1038/nm.3762. [DOI] [PMC free article] [PubMed] [Google Scholar]
- 16.Ju W, et al. Defining cell-type specificity at the transcriptional level in human disease. Genome Res. 2013;23(11):1862–1873. doi: 10.1101/gr.155697.113. [DOI] [PMC free article] [PubMed] [Google Scholar]
- 17.Lin X, Suh JH, Go G, Miner JH. Feasibility of repairing glomerular basement membrane defects in Alport syndrome. J Am Soc Nephrol. 2014;25(4):687–692. doi: 10.1681/ASN.2013070798. [DOI] [PMC free article] [PubMed] [Google Scholar]
- 18.Russell LK, et al. Cardiac-specific induction of the transcriptional coactivator peroxisome proliferator-activated receptor gamma coactivator-1alpha promotes mitochondrial biogenesis and reversible cardiomyopathy in a developmental stage-dependent manner. Circ Res. 2004;94(4):525–533. doi: 10.1161/01.RES.0000117088.36577.EB. [DOI] [PubMed] [Google Scholar]
- 19.Wende AR, Huss JM, Schaeffer PJ, Giguère V, Kelly DP. PGC-1alpha coactivates PDK4 gene expression via the orphan nuclear receptor ERRalpha: a mechanism for transcriptional control of muscle glucose metabolism. Mol Cell Biol. 2005;25(24):10684–10694. doi: 10.1128/MCB.25.24.10684-10694.2005. [DOI] [PMC free article] [PubMed] [Google Scholar]
- 20.Sawada N, et al. Endothelial PGC-1α mediates vascular dysfunction in diabetes. Cell Metab. 2014;19(2):246–258. doi: 10.1016/j.cmet.2013.12.014. [DOI] [PMC free article] [PubMed] [Google Scholar]
- 21.O’Hagan KA, et al. PGC-1alpha is coupled to HIF-1alpha-dependent gene expression by increasing mitochondrial oxygen consumption in skeletal muscle cells. Proc Natl Acad Sci U S A. 2009;106(7):2188–2193. doi: 10.1073/pnas.0808801106. [DOI] [PMC free article] [PubMed] [Google Scholar]
- 22.Rasbach KA, et al. PGC-1alpha regulates a HIF2alpha-dependent switch in skeletal muscle fiber types. Proc Natl Acad Sci U S A. 2010;107(50):21866–21871. doi: 10.1073/pnas.1016089107. [DOI] [PMC free article] [PubMed] [Google Scholar]
- 23.Arany Z, et al. HIF-independent regulation of VEGF and angiogenesis by the transcriptional coactivator PGC-1alpha. Nature. 2008;451(7181):1008–1012. doi: 10.1038/nature06613. [DOI] [PubMed] [Google Scholar]
- 24.Niranjan T, et al. The Notch pathway in podocytes plays a role in the development of glomerular disease. Nat Med. 2008;14(3):290–298. doi: 10.1038/nm1731. [DOI] [PubMed] [Google Scholar]
- 25.Kato H, et al. Wnt/β-catenin pathway in podocytes integrates cell adhesion, differentiation, and survival. J Biol Chem. 2011;286(29):26003–26015. doi: 10.1074/jbc.M111.223164. [DOI] [PMC free article] [PubMed] [Google Scholar]
- 26.Long J, et al. Long noncoding RNA Tug1 regulates mitochondrial bioenergetics in diabetic nephropathy. J Clin Invest. 2016;126(11):4205–4218. doi: 10.1172/JCI87927. [DOI] [PMC free article] [PubMed] [Google Scholar]
- 27.Dugan LL, et al. AMPK dysregulation promotes diabetes-related reduction of superoxide and mitochondrial function. J Clin Invest. 2013;123(11):4888–4899. doi: 10.1172/JCI66218. [DOI] [PMC free article] [PubMed] [Google Scholar]
- 28.Yuan Y, et al. Activation of peroxisome proliferator-activated receptor-γ coactivator 1α ameliorates mitochondrial dysfunction and protects podocytes from aldosterone-induced injury. Kidney Int. 2012;82(7):771–789. doi: 10.1038/ki.2012.188. [DOI] [PubMed] [Google Scholar]
- 29.Tran M, et al. PGC-1α promotes recovery after acute kidney injury during systemic inflammation in mice. J Clin Invest. 2011;121(10):4003–4014. doi: 10.1172/JCI58662. [DOI] [PMC free article] [PubMed] [Google Scholar]
- 30.Stadler K, Goldberg IJ, Susztak K. The evolving understanding of the contribution of lipid metabolism to diabetic kidney disease. Curr Diab Rep. 2015;15(7):40. doi: 10.1007/s11892-015-0611-8. [DOI] [PMC free article] [PubMed] [Google Scholar]
- 31.Woroniecka KI, Park AS, Mohtat D, Thomas DB, Pullman JM, Susztak K. Transcriptome analysis of human diabetic kidney disease. Diabetes. 2011;60(9):2354–2369. doi: 10.2337/db10-1181. [DOI] [PMC free article] [PubMed] [Google Scholar]
- 32.Han SH, et al. Deletion of Lkb1 in Renal tubular epithelial cells leads to CKD by altering metabolism. J Am Soc Nephrol. 2016;27(2):439–453. doi: 10.1681/ASN.2014121181. [DOI] [PMC free article] [PubMed] [Google Scholar]
- 33.Breyer MD, Susztak K. The next generation of therapeutics for chronic kidney disease. Nat Rev Drug Discov. 2016;15(8):568–588. doi: 10.1038/nrd.2016.67. [DOI] [PMC free article] [PubMed] [Google Scholar]
- 34.Li SY, Susztak K. Fat burning problem in cystic kidneys: an emerging common mechanism of chronic kidney disease. EBioMedicine. 2016;5:22–23. doi: 10.1016/j.ebiom.2016.02.035. [DOI] [PMC free article] [PubMed] [Google Scholar]
- 35.Rowe GC, Jiang A, Arany Z. PGC-1 coactivators in cardiac development and disease. Circ Res. 2010;107(7):825–838. doi: 10.1161/CIRCRESAHA.110.223818. [DOI] [PMC free article] [PubMed] [Google Scholar]
- 36.Lehman JJ, Barger PM, Kovacs A, Saffitz JE, Medeiros DM, Kelly DP. Peroxisome proliferator-activated receptor gamma coactivator-1 promotes cardiac mitochondrial biogenesis. J Clin Invest. 2000;106(7):847–856. doi: 10.1172/JCI10268. [DOI] [PMC free article] [PubMed] [Google Scholar]
- 37.Lynn EG, et al. Transient upregulation of PGC-1alpha diminishes cardiac ischemia tolerance via upregulation of ANT1. J Mol Cell Cardiol. 2010;49(4):693–698. doi: 10.1016/j.yjmcc.2010.06.008. [DOI] [PMC free article] [PubMed] [Google Scholar]
- 38.Weinberg SE, Chandel NS. Targeting mitochondria metabolism for cancer therapy. Nat Chem Biol. 2015;11(1):9–15. doi: 10.1038/nchembio.1712. [DOI] [PMC free article] [PubMed] [Google Scholar]
- 39.Haq R, et al. Oncogenic BRAF regulates oxidative metabolism via PGC1α and MITF. Cancer Cell. 2013;23(3):302–315. doi: 10.1016/j.ccr.2013.02.003. [DOI] [PMC free article] [PubMed] [Google Scholar]
- 40.Fernández-Vizarra E, Enríquez JA, Pérez-Martos A, Montoya J, Fernández-Silva P. Tissue-specific differences in mitochondrial activity and biogenesis. Mitochondrion. 2011;11(1):207–213. doi: 10.1016/j.mito.2010.09.011. [DOI] [PubMed] [Google Scholar]
- 41.Wanet A, Arnould T, Najimi M, Renard P. Connecting mitochondria, metabolism, and stem cell fate. Stem Cells Dev. 2015;24(17):1957–1971. doi: 10.1089/scd.2015.0117. [DOI] [PMC free article] [PubMed] [Google Scholar]
- 42.Austin S, Klimcakova E, St-Pierre J. Impact of PGC-1α on the topology and rate of superoxide production by the mitochondrial electron transport chain. Free Radic Biol Med. 2011;51(12):2243–2248. doi: 10.1016/j.freeradbiomed.2011.08.036. [DOI] [PubMed] [Google Scholar]
- 43.Hoeks J, Arany Z, Phielix E, Moonen-Kornips E, Hesselink MK, Schrauwen P. Enhanced lipid-but not carbohydrate-supported mitochondrial respiration in skeletal muscle of PGC-1α overexpressing mice. J Cell Physiol. 2012;227(3):1026–1033. doi: 10.1002/jcp.22812. [DOI] [PubMed] [Google Scholar]
- 44.Miura S, et al. Overexpression of peroxisome proliferator-activated receptor gamma co-activator-1alpha leads to muscle atrophy with depletion of ATP. Am J Pathol. 2006;169(4):1129–1139. doi: 10.2353/ajpath.2006.060034. [DOI] [PMC free article] [PubMed] [Google Scholar]
- 45.Lin J, et al. Transcriptional co-activator PGC-1 alpha drives the formation of slow-twitch muscle fibres. Nature. 2002;418(6899):797–801. doi: 10.1038/nature00904. [DOI] [PubMed] [Google Scholar]
- 46.Robin ED, Wong R. Mitochondrial DNA molecules and virtual number of mitochondria per cell in mammalian cells. J Cell Physiol. 1988;136(3):507–513. doi: 10.1002/jcp.1041360316. [DOI] [PubMed] [Google Scholar]
- 47.Markowitz GS, et al. Collapsing focal segmental glomerulosclerosis following treatment with high-dose pamidronate. J Am Soc Nephrol. 2001;12(6):1164–1172. doi: 10.1681/ASN.V1261164. [DOI] [PubMed] [Google Scholar]
- 48.Perazella MA, Markowitz GS. Bisphosphonate nephrotoxicity. Kidney Int. 2008;74(11):1385–1393. doi: 10.1038/ki.2008.356. [DOI] [PubMed] [Google Scholar]
- 49.Diomedi-Camassei F, et al. COQ2 nephropathy: a newly described inherited mitochondriopathy with primary renal involvement. J Am Soc Nephrol. 2007;18(10):2773–2780. doi: 10.1681/ASN.2006080833. [DOI] [PubMed] [Google Scholar]
- 50.Liakopoulos V, et al. Familial collapsing focal segmental glomerulosclerosis. Clin Nephrol. 2011;75(4):362–368. doi: 10.5414/CN106544. [DOI] [PMC free article] [PubMed] [Google Scholar]
- 51.Barisoni L, Madaio MP, Eraso M, Gasser DL, Nelson PJ. The kd/kd mouse is a model of collapsing glomerulopathy. J Am Soc Nephrol. 2005;16(10):2847–2851. doi: 10.1681/ASN.2005050494. [DOI] [PMC free article] [PubMed] [Google Scholar]
- 52.Peng M, et al. Mutant prenyltransferase-like mitochondrial protein (PLMP) and mitochondrial abnormalities in kd/kd mice. Kidney Int. 2004;66(1):20–28. doi: 10.1111/j.1523-1755.2004.00702.x. [DOI] [PMC free article] [PubMed] [Google Scholar]
- 53.Hodgin JB, et al. A molecular profile of focal segmental glomerulosclerosis from formalin-fixed, paraffin-embedded tissue. Am J Pathol. 2010;177(4):1674–1686. doi: 10.2353/ajpath.2010.090746. [DOI] [PMC free article] [PubMed] [Google Scholar]
- 54.Hodgin JB, et al. Identification of cross-species shared transcriptional networks of diabetic nephropathy in human and mouse glomeruli. Diabetes. 2013;62(1):299–308. doi: 10.2337/db11-1667. [DOI] [PMC free article] [PubMed] [Google Scholar]
- 55.Takemoto M, et al. A new method for large scale isolation of kidney glomeruli from mice. Am J Pathol. 2002;161(3):799–805. doi: 10.1016/S0002-9440(10)64239-3. [DOI] [PMC free article] [PubMed] [Google Scholar]
- 56.Li SY, et al. Four-and-a-half LIM domains protein 2 is a coactivator of Wnt signaling in diabetic kidney disease. J Am Soc Nephrol. 2015;26(12):3072–3084. doi: 10.1681/ASN.2014100989. [DOI] [PMC free article] [PubMed] [Google Scholar]
- 57.Li SY, et al. Matrix metalloproteinase-9 deficiency attenuates diabetic nephropathy by modulation of podocyte functions and dedifferentiation. Kidney Int. 2014;86(2):358–369. doi: 10.1038/ki.2014.67. [DOI] [PubMed] [Google Scholar]
- 58.Abe Y, Sakairi T, Kajiyama H, Shrivastav S, Beeson C, Kopp JB. Bioenergetic characterization of mouse podocytes. Am J Physiol, Cell Physiol. 2010;299(2):C464–C476. doi: 10.1152/ajpcell.00563.2009. [DOI] [PMC free article] [PubMed] [Google Scholar]
- 59.Subramanian A, et al. Gene set enrichment analysis: a knowledge-based approach for interpreting genome-wide expression profiles. Proc Natl Acad Sci U S A. 2005;102(43):15545–15550. doi: 10.1073/pnas.0506580102. [DOI] [PMC free article] [PubMed] [Google Scholar]
Associated Data
This section collects any data citations, data availability statements, or supplementary materials included in this article.


