

Abstract
The gut microbiota includes a community of bacteria that and play an integral part in host health and biological processes. Pronounced and repeated findings have linked gut microbiome to stress, anxiety, and depression. Currently, however, there remains only a limited set of studies focusing on microbiota change in substance abuse, including alcohol use disorder. To date, no studies have investigated the impact of vapour alcohol administration on the gut microbiome. For research on gut microbiota and addiction to proceed, an understanding of how route of drug administration affects gut microbiota must first be established. Animal models of alcohol abuse have proven valuable for elucidating the biological processes involved in addiction and alcohol-related diseases. This is the first study to investigate the effect of vapour route of ethanol administration on gut microbiota in mice. Adult male C57BL/6J mice were exposed to 4 weeks of chronic intermittent vapourized ethanol (CIE, N=10) or air (Control, N=9). Faecal samples were collected at the end of exposure followed by 16S sequencing and bioinformatic analysis. Robust separation between CIE and Control was seen in the microbiome, as assessed by alpha (Shannon and Simpson index, p<0.05) and beta (ANOSIM, p<0.001) diversity, with a notable decrease in alpha diversity in CIE. These results demonstrate that CIE exposure markedly alters the gut microbiota in mice. Significant increases in genus Alistipes (p<0.001) and significant reductions in genra Clostridium IV and XIVb (Kruskal-Wallis, p<0.001), Dorea (Kruskal-Wallis, p<0.01), and Coprococcus (Kruskal-Wallis, p<0.01) were seen between CIE mice and Control. These findings support the viability of the CIE method for studies investigating the microbiota-gut-brain axis and align with previous research showing similar microbiota alterations in inflammatory states during alcoholic hepatitis and psychological stress.
Keywords: Chronic alcohol, microbiome, vapour ethanol, microbiota-gut-brain axis
The gut microbiota includes a community of bacteria that play an integral part in nutrient metabolism and absorption in addition to gating host immune function [1]. Recently, a growing body of evidence points to the presence of a microbiota-gut-brain axis. Indeed, preclinical studies have associated commensal bacteria to hypothalamic-pituitary-adrenal (HPA) signalling [1], neurodevelopment processes [2], such as myelination [3], in addition to various behavioural phenotypes [1]. Currently, however, there remains only a limited set of studies focusing on microbiota change in substance abuse, including alcohol use disorder [4–6]. To date, no studies have investigated the impact of vapour alcohol administration on the gut microbiome.
Chronic alcohol abuse can cause damage to health including nutrient depletion, cognitive deficits, and alcoholic liver disease. Animal models of alcohol abuse have proven valuable for elucidating the biological processes involved in addiction, fetal alcohol syndrome, and alcohol-related diseases. A widely used murine model of chronic alcohol abuse is chronic intermittent ethanol (EtOH) (CIE) exposure because it resembles the prolonged, repeated patterns of alcohol abuse seen in humans [7, 8]. Prior studies using the CIE model have reported changes in a range of neural indices and behavioural phenotypes, including increased EtOH self-administration [9–13].
The CIE model could be advantageous for studying potential changes in the gut microbiome resulting from chronic EtOH exposure, as compared to other methods such as EtOH drinking, because 1) there is less potential for confounding effects of caloric intake 2) administration dose is consistent among subjects, and 3) vapour administration circumvents the physiological effects of EtOH in the gastrointestinal tract, such as altered nutrient absorption. For these reasons, the current study employed the CIE method in order to investigate the consequences of chronic vapour EtOH on gut microbiome.
Adult male C57BL/6J mice were obtained from The Jackson Laboratory (Bar Harbor, ME, USA) at 7 weeks of age. Mice were housed two per cage in a temperature (72±5°F) and humidity (45±15%) controlled SPF vivarium on a 12 hour light/dark cycle (lights on 06:00). Animals were allowed to acclimate to the facility for 1 week prior to CIE. Food and water was provided ad libitum for the duration of the experiment. Food, NIH-31 Harlan/Teklad Roden Chow, was obtained from Harlan Teklad (Indianapolis, IN, USA). Cages were changed the same day each week (Mondays) and fresh Teklad corn cob bedding (1/8”) was also obtained from Harlan Teklad. Experimental procedures were approved by the NIAAA Animal Care and Use Committee and followed NIH guidelines.
Subjects were randomly assigned to either the air (Control) or CIE group; N=10 for each group. A previously described vapour inhalation procedure was employed [8, 11]. Prior to being placed in the vapour chambers, test subjects received IP injections of 1.5 g/kg of 20% EtOH (v/v) with 71.6 mg/kg of an alcohol dehydrogenase (ADH) inhibitor, pyrazole (Sigma, St. Louis, MO, USA), in a combined volume of 10 ml/kg body weight, to initiate intoxication and stabilize blood EtOH concentrations (BECs). The average weight of mice was ~22 grams for both groups. During exposure, mice were removed from their home cages and singly housed in clean 60×36×60 cm cages (PlasLabs, Lansing, MI, USA) and placed into Plexiglas vapour chambers. 95% EtOH was passed through a vapourization stone at 19–22 mg EtOH/L of fresh air and delivered at a rate of ~10 L/min. BECs were measured in sentinels using the Analox AM1 alcohol analyzer (Analox Instruments USA, Lunenburg, MA, USA) and achieved BECs of 175±25 mg/dL. The protocol for Control group was similar to the CIE. The Control group received a 68.1 mg/kg IP injection of pyrazole and was exposed to air at a rate of ~10L/min in Plexiglas vapour chambers directly adjacent to the EtOH vapour chambers. Pyrazole dose was adjusted based on solubility for mice to receive equal concentrations, thus dosage was higher in the CIE treated group because the solubility of pyrazole (a hydrophobic heterocyclic compound) is lower in EtOH than in saline (0.9% NaCl). Vapour exposure occurred for 16 hours per day (17:00–09:00), 5 days a week (Monday–Friday) for 4 consecutive weeks. Mice were 8 weeks of age at the beginning of the study and 12 weeks of age at the end of the study.
We utilized a previously published method for isolating microbiota from fecal samples under sterile conditions [14]. Immediately following the final exposure, mice from both groups were euthanatized via cervical dislocation and cecal and colonic contents were harvested, pooled and diluted 40-fold (weight: volume) in sterile water. After centrifugation at 800 RPM, the supernatant was aliquoted under sterile conditions for storage at −80°C.
The QIAamp DNA Stool Mini Kit (Qiagen, Hilden, Germany) was used to extract bacterial DNA from samples dilutions. Extracted DNA was further concentrated using a standard EtOH precipitation protocol. The prokaryotic 16S ribosomal RNA gene (16S rRNA) was amplified from extracted DNA using amplicon PCR for the V3 and V4 regions following the Illumina 16S Sample Preparation Guide. Using the Nextera XT DNA Library Prep Kit (Illumina, San Diego, CA, USA), 16S rRNA amplicons were further prepared for 2×250bp sequencing on the Illumina MiSeq platform. The Illumina V3–V4 primers were selected for this study because they have a high coverage (94.5% bacteria) while remaining in the amplicon size necessary to sequence at 2×250bp [15].
All sequences in FASTQ files format were filtered using PRINSEQ. Sequences with length less than 150 nucleotides or with low quality at the 3′ end were removed. Paired-end reads with a minimum overlap of 20 base-pairs were joined using FASTQ-join. Finally, all single files were processed to a final filtering sequence (mean quality score > 20). Sequences from one sample in the control group had to be removed due to low sequencing reads, which resulted in a low quality score (< 20). After filtering quality and length trimming, the average number of high-quality sequences generated per sample (Control N=9, CIE N=10) was 63,600 ±25,932 SD. The average number of OTUs per sample was 649±128 SD.
The sequences were matched at operational taxonomic unit (OTU; 97% identity level) using closed-reference USEARCH v7.0 algorithm against The Ribosomal Database Project. Alpha and beta diversity was determined using QIIME. Additional alpha and beta diversity analyses were performed with the R package phyloseq.
Alpha diversity was computed based on Shannon and Simpson methods and was visualized via the phyloseq package. Family and genera-level analyses were carried out using the Kruskal-Wallis method with the phyloseq package. Corrected p-values (q-value) adjust for multiple testing according to the method of Benjamini and Hochberg [16]. Post hoc analysis of statistically significant taxa was performed to calculate log2 fold change in CIE relative to Control, p-values were estimated using negative binomial distribution (Gamma-Poisson).
The Shannon and Simpson indexes are the most commonly used formulas for calculating the alpha diversity of microbiota [17]. These indexes showed significant (Shannon and Simpson indexes, p<0.05) differences in alpha diversity, with mean diversity decreased in the CIE group, relative to controls (Figure 1A).
Figure 1.
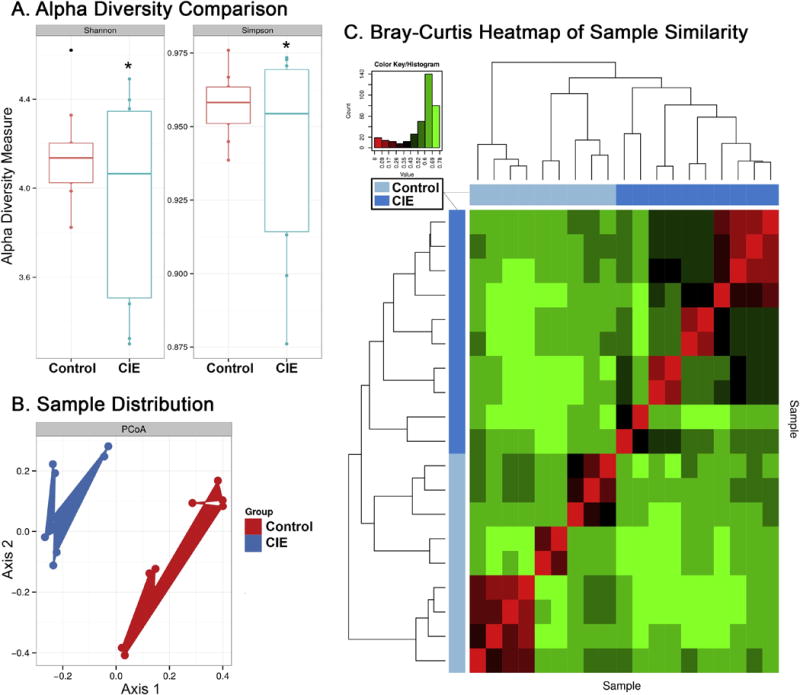
Effects of CIE vapour exposure on the microbiome. (A) Shannon and Simpson Index alpha diversity measures of bacterial number and distribution by group. Group outliers indicated with a dot, significance (p<0.05) indicated with an asterisk. (B) PCA plot showing distribution of samples by OTUs. Clusters are colored based on their respective experimental group. (C) Bray-Curtis heatmap of beta diversity correlations between samples. Axes indicate: i) individual sample per row (right y-axis) and column (bottom x-axis) and ii) dendrogram showing taxonomic relationships by total OTUs with blue bar showing group assignment (left y-axis, top x-axis).
Sample distribution by sequenced OTUs using Principle Coordinate Analysis (PCoA) revealed phylogenetic separation between CIE and Control groups (Figure 1B). Beta diversity analysis comparing taxonomic similarities between individual samples was calculated with Bray-Curtis (Figure 1C). The heatmap shows correlations of taxonomic OTU composition for each sample compared to every other sample in the study. Samples are distributed by overall taxonomic OTU similarity, regardless of group designation. This method is used to assess if subjects cluster by exposure method, similar to a PCoA plot. In the Bray-Curtis heatmap, subjects clustered by exposure group (Figure 1C). Multivariate analysis of beta diversity between CIE and Control groups revealed significant differences in total sequenced OTUs (ANOSIM, p<0.001 or adonis, p<0.001) and at the genus level (ANOSIM, p<0.01) but no significant difference at the family level (ANOSIM, p=0.157).
At the family level, data revealed a significant difference in the Rikenellaceae family (Kruskal-Wallis, p<0.001) between groups, which remained statistically significant when corrected for multiple comparisons (Bonferonni, q-value<0.05) (Figure 2B). Rikenellaceae was significantly increased (log2 fold change>3.5, p<0.0001) in CIE relative to Control (Figure 2B).
Figure 2.
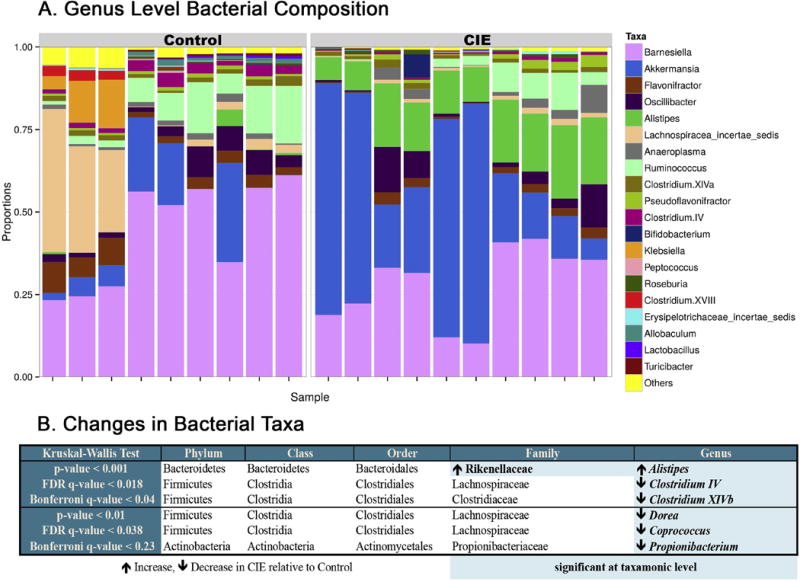
Effects of CIE vapour exposure on bacterial composition. (A) Genus level bacterial composition by group. (B) Statistically significant taxonomic changes in CIE exposed relative to Controls. Statistically significant taxa highlighted in blue and grouped into rows ordered based on p-value.
At the genus level, data revealed significant differences in Alistipes (Kruskal-Wallis, p<0.001) and Clostridium IV and XIVb (Kruskal-Wallis, p<0.001) between CIE mice and Control, which remained statistically significant when corrected for multiple comparisons (Bonferonni, q-value<0.05) (Figure 2B). A higher abundance of Alistipes (log2 fold change>3.8, p<0.0001) was seen in the CIE group, with decreases in Clostridium IV (log2 fold change>−1.4, p<0.001) and Clostridium XIVb (log2 fold change>−2.0, p<0.001) (Figure 2).
Less statistically significant changes were seen for Dorea (Kruskal-Wallis, p<0.01), Coprococcus (Kruskal-Wallis, p<0.01), and Propionibacterium (Kruskal-Wallis, p<0.01), which did not remain statistically significant when corrected for multiple comparisons (Bonferonni, q-value=0.23) but did remain significant when corrected for false discovery rate (FDR, q-value<0.05). Akkermansia was visibly increased in the CIE graph of bacterial composition (Figure 2A), but significance (Kruskal-Wallis, p<0.05) did not hold after corrections (Bonferonni q-value=1.00). Significant decreases in Dorea (log2 fold change>−2.5, p<0.01), Coprococcus (log2 fold change>−1.6, p<0.05), and Propionibacterium (log2 fold change>−1.7, p<0.05) were observed in the CIE group relative to Control (Figure 2).
Although disturbances in the microbiome are linked to a variety of health states and the action of a variety of pharmacological agents, there is a paucity of information on the impact of chronic EtOH on microbiome composition [18]. Here we found that the bacterial composition in mice exposed to CIE, as measured from Bray-Curtis and PCoA analyses, exhibited a clear separation from that seen in air-exposed Controls. These data add to a growing literature showing how changes in the microbiome can occur independently of direct administration of a substance into the gut [19]. They also extend the findings of a previous report showing reductions in alpha diversity following chronic alcohol feeding [4]. Taken together with the current findings, these results demonstrate alterations in the gut microbiota in response to chronic EtOH across a range of routes of administration.
In this study, Alistipes was the only genus of bacteria that significantly increased with CIE. Increases in Alistipes and reductions in Clostridium cluster IV have been found in mice receiving fecal microbiota transfer from alcoholic patients with severe hepatitis [5]. An increased population of Alistipes has also been observed in chronic fatigue syndrome, inflammation, inflammatory bowel syndrome, and depression [20, 21]. We observed a decrease in genus Dorea in CIE relative to Control (Figure 2B). Conversely, a study by Leclerq and colleagues found increases in Dorea associated with high intestinal permeability in alcoholics. However, our current study found reductions in Clostridium cluster IV also seen in this aformentioned study [6]. The genus Clostridium cluster IV is populated by bacterial species believed to confer an anti-inflammatory effect and therefore beneficial to the host [5]. Faecalibacterium prausnitzii and Clostridium leptum are among these beneficial species within this genus and are reduced in studies of alcohol consumption and hepatitis [5, 6]. There is limited information about the functions of genra Propionibacterium and Clostridium XIVb within the gut microbiome though they are known to include species that produce short-chain fatty acids [22, 23] which are implicated in behavior and cognition [24]. Similar reductions in Dorea and Coprococcus which have previosly been observed in chronic social stress and correlated to increases in proinflammatory cytokines IL-6 and MCP-1 [19]. Future studies are needed to examine the relative importance of these alterations to the pathophysiology in disease states.
Despite its advantage of mimicking the most common route of alcohol administration in humans, oral EtOH self-administration in rodents has several limitations, including: 1) dosage variability between test subjects, 2) inconsistent and unreliable self-administration in animals, 3) difficulty in achieving and maintaining a desired BEC, and 4) experimental confounds such as caloric intake [10]. While vapour exposure is not a common form of achieving intoxication in humans, this method is valuable in differentiating the underlying mechanisms involved in microbial changes caused by gastrointestinal EtOH exposure and other changes acting through the brain-gut-microbiota axis. A limitation in using this CIE model of vapour exposure is the administration of pyrazole, a known hepatoxin, which may confound result by having a synergistic effect with ethanol [25] that may further alter liver function, inflammation, and gut microbiome. No overt signs of liver damage were observed in either the AIR or CIE mice during the necropsies that immediately followed the respective exposures. It is possible that by using the V3–V4 16S amplification primers, certain bacterial taxa may have been missed and/or misrepresented, though limitations exist within every sequencing method that could potentially affect results. Finally, differences in microbiota composition across strains [26, 27] and vendors [28] is a significant factor affecting reproducibility in animal studies. To generalize results outside of strain or environment, the functional ecology of the microbiome must be examined [29]. We acknowledge that some changes in bacteria seen in this study may not be seen in another animal strain under the same experimental conditions, however changes in other bacteria with the same functional traits are likely to be observed.
In conclusion, the current study reveals marked changes in the bacterial composition of faecal microbiota in C57BL/6J mice chronically exposed to EtOH vapours. These findings align with and extend a growing body of evidence of microbiota changes associated with inflammation and support the viability of the CIE method for future studies investigating the effects of EtOH on the microbiota-gut-brain axis. Furthermore, the robust effects of EtOH vapour suggest that other substances of abuse administered outside of the gastrointestinal system may potentially alter gut microbiota.
Highlights.
Mice chronically exposed to ethanol vapours exhibited marked changes in microbiota
Ethanol exposure significantly increases in genus Alistipes
Ethanol exposure reduces many bacterial taxa, most significantly Clostridium
Chronic ethanol exposure caused reductions in bacteria alpha diversity
Bacterial changes found align with previous findings associated to inflammation
Acknowledgments
Research supported by the APC Microbiome Institute and Science Foundation Ireland (SFI) [Grant No. 12/RC/2273] and the National Institute on Alcohol Abuse and Alcoholism Intramural Research Program. We would like to thank Ms. Katherine Kaugars and Dr. Gerard Moloney for excellent technical assistance.
Footnotes
Publisher's Disclaimer: This is a PDF file of an unedited manuscript that has been accepted for publication. As a service to our customers we are providing this early version of the manuscript. The manuscript will undergo copyediting, typesetting, and review of the resulting proof before it is published in its final citable form. Please note that during the production process errors may be discovered which could affect the content, and all legal disclaimers that apply to the journal pertain.
The authors have no potential conflicts of interest to report.
References
- 1.Luczynski P, Neufeld KAM, Oriach CS, Clarke G, Dinan TG, Cryan JF. Growing up in a Bubble: Using Germ-Free Animals to Assess the Influence of the Gut Microbiota on Brain and Behaviour. International Journal of Neuropsychopharmacology. 2016:pyw020. doi: 10.1093/ijnp/pyw020. [DOI] [PMC free article] [PubMed] [Google Scholar]
- 2.McVey Neufeld KA, Luczynski P, Dinan TG, Cryan JF. Reframing the Teenage Wasteland: Adolescent Microbiota-Gut-Brain Axis. The Canadian Journal of Psychiatry. 2016;61(4):214–221. doi: 10.1177/0706743716635536. [DOI] [PMC free article] [PubMed] [Google Scholar]
- 3.Hoban AE, Stilling RM, Ryan FJ, Shanahan F, Dinan TG, Claesson MJ, Clarke G, Cryan JF. Regulation of prefrontal cortex myelination by the microbiota. Transl Psychiatry. 2016;6:e774. doi: 10.1038/tp.2016.42. [DOI] [PMC free article] [PubMed] [Google Scholar]
- 4.Bull-Otterson L, Feng W, Kirpich I, Wang Y, Qin X, Liu Y, Gobejishvili L, Joshi-Barve S, Ayvaz T, Petrosino J, Kong M, Barker D, McClain C, Barve S. Metagenomic analyses of alcohol induced pathogenic alterations in the intestinal microbiome and the effect of Lactobacillus rhamnosus GG treatment. PloS one. 2013;8(1):e53028. doi: 10.1371/journal.pone.0053028. [DOI] [PMC free article] [PubMed] [Google Scholar]
- 5.Llopis M, Cassard AM, Wrzosek L, Boschat L, Bruneau A, Ferrere G, Puchois V, Martin JC, Lepage P, Le Roy T, Lefevre L, Langelier B, Cailleux F, Gonzalez-Castro AM, Rabot S, Gaudin F, Agostini H, Prevot S, Berrebi D, Ciocan D, Jousse C, Naveau S, Gerard P, Perlemuter G. Intestinal microbiota contributes to individual susceptibility to alcoholic liver disease. Gut. 2016 doi: 10.1136/gutjnl-2015-310585. [DOI] [PubMed] [Google Scholar]
- 6.Leclercq S, Matamoros S, Cani PD, Neyrinck AM, Jamar F, Stärkel P, Windey K, Tremaroli V, Bäckhed F, Verbeke K, De Timary P, Delzenne NM. Intestinal permeability, gut-bacterial dysbiosis, and behavioral markers of alcohol-dependence severity. Proc Natl Acad Sci U S A. 2014;111(42):E4485–E4493. doi: 10.1073/pnas.1415174111. [DOI] [PMC free article] [PubMed] [Google Scholar]
- 7.Koob GF. Theoretical frameworks and mechanistic aspects of alcohol addiction: alcohol addiction as a reward deficit disorder. Curr Top Behav Neurosci. 2013;13:3–30. doi: 10.1007/7854_2011_129. [DOI] [PMC free article] [PubMed] [Google Scholar]
- 8.Lopez MF, Becker HC. Effect of pattern and number of chronic ethanol exposures on subsequent voluntary ethanol intake in C57BL/6J mice. Psychopharmacology. 2005;181(4):688–96. doi: 10.1007/s00213-005-0026-3. [DOI] [PubMed] [Google Scholar]
- 9.Radke AK, Jury NJ, Kocharian A, Marcinkiewcz CA, Lowery-Gionta EG, Pleil KE, McElligott ZA, McKlveen JM, Kash TL, Holmes A. Chronic EtOH effects on putative measures of compulsive behavior in mice. Addict Biol. 2015 doi: 10.1111/adb.12342. [DOI] [PMC free article] [PubMed] [Google Scholar]
- 10.McCool BA, Chappell AM. Chronic intermittent ethanol inhalation increases ethanol self-administration in both C57BL/6J and DBA/2J mice. Alcohol. 2015;49(2):111–20. doi: 10.1016/j.alcohol.2015.01.003. [DOI] [PMC free article] [PubMed] [Google Scholar]
- 11.DePoy L, Daut R, Wright T, Camp M, Crowley N, Noronha B, Lovinger D, Holmes A. Chronic alcohol alters rewarded behaviors and striatal plasticity. Addict Biol. 2015;20(2):345–8. doi: 10.1111/adb.12131. [DOI] [PMC free article] [PubMed] [Google Scholar]
- 12.Peterson VL, McCool BA, Hamilton DA. Effects of ethanol exposure and withdrawal on dendritic morphology and spine density in the nucleus accumbens core and shell. Brain research. 2015;1594:125–35. doi: 10.1016/j.brainres.2014.10.036. [DOI] [PMC free article] [PubMed] [Google Scholar]
- 13.Holmes A, Fitzgerald PJ, MacPherson KP, DeBrouse L, Colacicco G, Flynn SM, Masneuf S, Pleil KE, Li C, Marcinkiewcz CA, Kash TL, Gunduz-Cinar O, Camp M. Chronic alcohol remodels prefrontal neurons and disrupts NMDAR-mediated fear extinction encoding. Nat Neurosci. 2012;15(10):1359–61. doi: 10.1038/nn.3204. [DOI] [PMC free article] [PubMed] [Google Scholar]
- 14.Bruce-Keller AJ, Salbaum JM, Luo M, Blanchard Et, Taylor CM, Welsh DA, Berthoud HR. Obese-type gut microbiota induce neurobehavioral changes in the absence of obesity. Biological psychiatry. 2015;77(7):607–15. doi: 10.1016/j.biopsych.2014.07.012. [DOI] [PMC free article] [PubMed] [Google Scholar]
- 15.Klindworth A, Pruesse E, Schweer T, Peplies J, Quast C, Horn M, Glockner FO. Evaluation of general 16S ribosomal RNA gene PCR primers for classical and nextgeneration sequencing-based diversity studies. Nucleic Acids Res. 2013;41(1):e1. doi: 10.1093/nar/gks808. [DOI] [PMC free article] [PubMed] [Google Scholar]
- 16.Benjamini Y, Hochberg Y. Controlling the false discovery rate: a practical and powerful approach to multiple testing. Journal of the royal statistical society Series B(Methodological) 1995:289–300. [Google Scholar]
- 17.Morgan XC, Huttenhower C. Chapter 12: Human microbiome analysis. PLoS Comput Biol. 2012;8(12):e1002808. doi: 10.1371/journal.pcbi.1002808. [DOI] [PMC free article] [PubMed] [Google Scholar]
- 18.Spanogiannopoulos P, Bess EN, Carmody RN, Turnbaugh PJ. The microbial pharmacists within us: a metagenomic view of xenobiotic metabolism. Nat Rev Microbiol. 2016;14(5):273–87. doi: 10.1038/nrmicro.2016.17. [DOI] [PMC free article] [PubMed] [Google Scholar]
- 19.Bailey MT, Dowd SE, Galley JD, Hufnagle AR, Allen RG, Lyte M. Exposure to a social stressor alters the structure of the intestinal microbiota: implications for stressorinduced immunomodulation. Brain, behavior, and immunity. 2011;25(3):397–407. doi: 10.1016/j.bbi.2010.10.023. [DOI] [PMC free article] [PubMed] [Google Scholar]
- 20.Naseribafrouei A, Hestad K, Avershina E, Sekelja M, Linlokken A, Wilson R, Rudi K. Correlation between the human fecal microbiota and depression. Neurogastroenterology and motility: the official journal of the European Gastrointestinal Motility Society. 2014;26(8):1155–62. doi: 10.1111/nmo.12378. [DOI] [PubMed] [Google Scholar]
- 21.Jiang H, Ling Z, Zhang Y, Mao H, Ma Z, Yin Y, Wang W, Tang W, Tan Z, Shi J, Li L, Ruan B. Altered fecal microbiota composition in patients with major depressive disorder. Brain, behavior, and immunity. 2015;48:186–94. doi: 10.1016/j.bbi.2015.03.016. [DOI] [PubMed] [Google Scholar]
- 22.Kelly JR, Kennedy PJ, Cryan JF, Dinan TG, Clarke G, Hyland NP. Breaking down the barriers: the gut microbiome, intestinal permeability and stress-related psychiatric disorders. Front Cell Neurosci. 2015;9:392. doi: 10.3389/fncel.2015.00392. [DOI] [PMC free article] [PubMed] [Google Scholar]
- 23.Johns AT. The mechanism of propionic acid formation by Clostridium propionicum. Microbiology. 1952;6(1–2):123–127. doi: 10.1099/00221287-6-1-2-123. [DOI] [PubMed] [Google Scholar]
- 24.Kennedy PJ, Murphy AB, Cryan JF, Ross PR, Dinan TG, Stanton C. Microbiome in Brain Function and Mental Health. Trends in Food Science & Technology. 2016 [Google Scholar]
- 25.Wu D, Cederbaum AI. Ethanol and arachidonic acid produce toxicity in hepatocytes from pyrazole-treated rats with high levels of CYP2E1. Molecular and cellular biochemistry. 2000;204(1–2):157–167. doi: 10.1023/a:1007064706101. [DOI] [PubMed] [Google Scholar]
- 26.Damlund DS, Metzdorff SB, Hasselby JP, Wiese M, Lundsager M, Nielsen DS, Buschard KS, Hansen AK, Frokiaer H. Postnatal Hematopoiesis and Gut Microbiota in NOD Mice Deviate from C57BL/6 Mice. J Diabetes Res. 2016;2016:6321980. doi: 10.1155/2016/6321980. [DOI] [PMC free article] [PubMed] [Google Scholar]
- 27.Friswell MK, Gika H, Stratford IJ, Theodoridis G, Telfer B, Wilson ID, McBain AJ. Site and strain-specific variation in gut microbiota profiles and metabolism in experimental mice. PloS one. 2010;5(1):e8584. doi: 10.1371/journal.pone.0008584. [DOI] [PMC free article] [PubMed] [Google Scholar]
- 28.Hilbert T, Steinhagen F, Senzig S, Cramer N, Bekeredjian-Ding I, Parcina M, Baumgarten G, Hoeft A, Frede S, Boehm O, Klaschik S. Vendor effects on murine gut microbiota influence experimental abdominal sepsis. Journal of Surgical Research. 2017;211:126–136. doi: 10.1016/j.jss.2016.12.008. [DOI] [PubMed] [Google Scholar]
- 29.Shafquat A, Joice R, Simmons SL, Huttenhower C. Functional and phylogenetic assembly of microbial communities in the human microbiome. Trends in microbiology. 2014;22(5):261–6. doi: 10.1016/j.tim.2014.01.011. [DOI] [PMC free article] [PubMed] [Google Scholar]