Abstract
Previously we found decreased expression of SOCS3 in neointimal hyperplastic region following balloon angioplasty in atherosclerotic micro swine. In our recent in vitro studies using human coronary artery smooth muscle cells (HCASMC), we observed the inhibition of SOCS3 expression in the presence of both TNF-α and IGF-1, correlating with the in-vivo findings in microswine. We also reported that two independent mechanisms, JAK/STAT3/NFκB and promoter methylation of SOCS3 were responsible for TNF-α– and IGF-1-induced SOCS3 inhibition. In this study, using miRNA array and gene expression approaches, we explored the molecular mechanisms involved in the above SOCS3 repression and identified several miRNAs that are associated with the regulation of SOCS3 expression. Our miRNA expression profiling revealed profound down-regulation of two specific miRNAs, hsa-miR-758 and hsa-miR-1264, whose expression levels decreased by 8–10 folds when HCASMCs were treated with both TNF-α and IGF-1. This was accompanied with a significant up-regulation of three specific miRNAs, hsa-miR-155, hsa-miR-146b-5p and hsa-miR-146a, which showed about 3–7 fold increases in their expression levels. Importantly, we also found that the miRNA hsa-miR-1264 targets DNA methyltransferase-1 (DNMT1) transcripts by binding to its 3’UTR region to affect its expression. Expression of hsa-miR-1264 in HCASMCs not only resulted in decreased DNMT1 mRNA transcripts but it also increased SOCS3 expression. The treatment with TNF-α and IGF-1 resulted in drastic decrease in hsa-miR-1264 levels with no change in the expression of DNMT1. Consequently, the DNMT1 activity caused hypermethylation in the CpG island of the SOCS3 promoter region and inhibited its expression. This could be a causative epigenetic mechanism associated with TNF-α– and IGF-1-induced smooth muscle cell proliferation involved in the pathogenesis of coronary artery hyperplasia and restenosis.
Keywords: Suppressor of cytokines signaling 3, restenosis, hyperplasia, cardiovascular diseases, smooth muscle cell proliferation, epigenetic gene silencing, micro-RNA, DNA methyltransferase-1, cytokine, growth factors
1. Introduction
SOCS3 is a member of eight structurally related SOCS family proteins that affect cell proliferation by regulating the JAK/STAT signaling pathway [1–5]. The inflammatory cytokines, TNF-α and IGF-1, were reported as key factors that regulate cellular hyperplasia and restenosis resulting from intervention procedures in the atherosclerotic coronary arteries [6–8]. Our recent study showed that SOCS3 expression was dramatically decreased in porcine coronary artery smooth muscle cells (PCASMCs) in presence of TNF-α and IGF-1 [9]. We also showed that the SOCS3 promoter region was methylated when human coronary artery smooth muscle cells (HCASMCs) were treated with both TNF-α and IGF-1, which resulted in the inhibition of SOCS3 expression [10].
Three DNA methyltransferases (DNMTs), DNMT1, DNMT3a and DNMT3b were reported to be involved in catalyzing the DNA methylation activity, of which DNMT1 was identified as the major DNA methyltransferase in mammalian cells which methylates genomic DNA during replication [11, 12]. Recent studies identified that promoter methylation activity of DNMTs in the CpG islands was affected by micro RNAs (miRNAs), which target their untranslated regions [13–18]. MiRNAs are small (21–23 nucleotides), non-coding, single-stranded RNA molecules which regulate gene expression. Initially, they were identified for their ability to directly bind to the 3′ untranslated region (UTR) of target mRNA transcripts and inhibit their gene expression either by inducing mRNA degradation or repressing translation [19]. However, there is increasing evidence which suggests that miRNAs also bind to the promoter regions of the gene and also within the coding sequences of the transcript. It was also reported that a single miRNA can regulate multiple genes due to significant variation in their sequence homology. It is estimated that miRNAs control up to 60% of human genes and can inhibit many cellular pathways and affect transcription and translation in the cell [20, 21].
The aim of the present study was to investigate the resulting effect of TNF-α and IGF-1 treatment which leads to epigenetic repression of SOCS3 in smooth muscle cells, and to identify the associated molecular mechanism that enhances cell proliferation, causing intimal hyperplasia and restenosis. Our miRNA expression profiling identified a few specific miRNAs that are up or down-regulated by the combined treatment of TNF-α and IGF-1. Importantly, our studies showed that the miRNA hsa-miR-1264 was drastically down-regulated by the cumulative effect of TNF-α and IGF-1 treatment. Subsequently, transcript binding analysis of hsa-miR-1264 showed that hsa-miR-1264 has a potential binding site within the 3’UTR of DNMT1 transcript. Therefore, down-regulation of hsa-miR-1264 does not affect DNMT1 expression and as a result DNMT1 methylates the promoter region of SOCS3 and represses its gene expression. These results were further confirmed by transfection of hsa-miR-1264 in HCASMCs where DNMT1 activity was inhibited and simultaneously restored the SOCS3 expression. These results support our hypothesis that epigenetic inhibition of SOCS3 is regulated by hsa-miR-1264 which specifically targets DNMT1 transcript.
2. Materials and Methods
2.1. Reagents
Recombinant human TNF-α and IGF-1 were obtained from PeproTech, Inc. (Rocky Hill, NJ). All cell media, growth factors and antibiotics were purchased from Science Cell, (Carlsbad, CA). Antibodies DNMT1, SOCS3 and GAPDH were obtained from Abcam (Cambridge, MA, Cat No: ab152153), Cell Signaling Technology (Danvers, MA, Cat No: 2923) and Novus Biologicals (Littleton, CO, Cat No: NB300-221), respectively. The miRNA isolation kit “mirVana” was purchased from Ambion, Life technologies (Grand Island, NY, Cat No: AM1560). The miRNAs hsa-miR-1264 mimic Cat No: 4464066; inhibitor Cat No: 4464084 and miRNA Negative Control #1 Cat No: 4464058, and the transfection agent SiPORT NeoFX Cat No: AM4511 were purchased from Life technologies (Grand Island, NY). MTT reagent (Cat No: M5655) was obtained from Sigma-Aldrich (St. Louis, MO).
2.2. Cell Culture
HCASMCs were purchased from Cell Applications, Inc. (San Diego, CA) at passage 2. Cells were maintained in smooth muscle cell media (SMCM) containing 10% FBS, smooth muscle cell growth supplement (SMCGS), and 1% penicillin/streptomycin in a humidified 5% CO2 atmosphere at 37°C. Cells from passages 3–5 were used for in vitro experiments. About 2.5 × 10⁵ cells were seeded in 25cm2 flasks and at 70% confluence cells were serum-starved overnight before use. Cells were first transfected and after 24 hours they were stimulated with TNF-α and IGF-1 at 100ng/ml concentration for additional 24 hours. Cells lysates were prepared by adding either RIPA buffer for protein isolation or with the supplied lysis buffer for miRNA and mRNA isolation.
2.3. RNA Isolation
Total RNA, including small non-coding RNAs, was isolated from HCASMC cell culture using the mirVana RNA isolation kit according to the manufacturer’s instructions. The quantity of isolated RNA was determined using ND-1000 spectrophotometer (Thermo Scientific, Rockford, IL) and the quality of RNA was analyzed using the Agilent 2100 Bioanalyzer (Agilent Technologies, Santa Clara, CA). The 260/280 ratio of all RNA samples were between 1.8 and 2.1 and the RNA Integrity Numbers were >8.
2.4. MiRNA Expression Profiling
The miRNA profiling was performed both by Affymetrix GeneChip miRNA 2.0 arrays (Santa Clara, CA) and quantitative reverse transcription-PCR using the TaqMan Open Array miRNA panel with Megaplex primer pools (Applied Biosystems, Foster City, CA). Affymetrix miRNA labeling, array hybridization and data processing, and labeling of total RNA (including low molecular weight RNA) was done using the Flashtag RNA Labeling Kit (Genisphere, Hatfield, PA) in accordance with the manufacturer’s instructions. Tailing reaction for each sample was carried out using 2 μg of total RNA incubated in buffer containing 2.5 mM MnCl2, dATP, and Terminal transferase for 15 minutes at 37°C followed by ligation of the biotinylated signal molecule to the target RNA sample (1× Flash Tag ligation mix biotin, T4 DNA ligase - incubation for 30 minutes at RT) and the reaction was stopped with the addition of stop solution. Hybridization of the samples was done in GeneChip® miRNA Array (Affymetrix, Santa Clara, CA) at 48°C overnight with shaking at 60 rpm. Following this, the samples were washed and stained on Fluidics Station 450 (Fluidics script FS450_0003) and ultimately scanned on a GeneChip® Scanner 3000 7G (Affymetrix). The raw data was processed in the following order: background detection, RMA global background correlation, quantile normalization, median polish and log2-transformation with miRNA QC tool software (Affymetrix). Two independent experiments were performed for each sample. The miRNA profiling was also determined by stem-loop quantitative reverse transcription-PCR (qRT-PCR) for mature miRNAs using the Taqman Open Array human miRNA panel on a Biotrove Open Array NT cycler (Applied Biosystems, Foster City, CA). First, the total mRNA (100 ng) was converted to cDNA using the human megaplex RT primers on Veriti 96 well thermal cycler (Applied Biosystems, Foster City, CA). Megaplex RT primers contain two sets (A and B) of 381 stem-looped reverse-transcription (RT) primers that allow for the simultaneous synthesis of cDNA for mature miRNA. Reaction was carried with 3 μl of total RNA (about 350 ng) and was supplemented with RT primer mix (10 ×), dNTPs with dTTP (100 mM), Multiscribe Reverse Transcriptase (50 U μl−1), RT buffer (10X), MgCl2 (25 mM) and RNase inhibitor (20 U μl−1) in a total reaction volume of 7.5 μl. The reaction mixture was subjected to 40 cycles of 16°C for 2 min, 42°C for 1 min and 50°C for 1 s, followed by reverse transcriptase inactivation at 85°C for 5 min. In the subsequent step, preamplification reaction was carried out with 2.5 μl of Megaplex RT product using megaplex preamp primers for preamplifying specific cDNA targets and to increase the quantity of desired cDNA for gene expression. PCR amplification was carried out as follows: 95°C for 10 min, 55°C for 2 min and 75°C for 2 min, followed by 12 cycles of 95°C for 15 s and 60°C for 4 min. The preamplified target cDNA samples were transferred to a 384-well plate containing universal TaqMan Master Mix (Applied BioSystems, P/N 4324018) for amplification using Open Array system. The cDNA/master mix was loaded on the array by the Open Array Autoloader (Applied Biosystems, Foster City, CA). The TaqMan Open Array for miRNA is a 3072-well microfluidic card containing dried TaqMan primers and probes for gene expressions of 758 miRNA’s, including necessary controls. After loading, the array was transferred to the slide and sealed manually as described in the manual. Biotrove Open Array NT Cycler (BioTrove Inc., Woburn, MA, now Life Technologies, Applied Biosystems) was used to amplify the samples.
2.5. HCASMCs transfection with hsa-miR-1264
HCASMCs were cultured in SMCM medium to about 70% confluence and were serum starved overnight prior to transfection. Although a 20nM concentration of the miRNA hsa-miR-1264 was found effective at the lower range, 100nM concentrations of the mimic, inhibitor or the negative control #1 were used for transfection. OptiMEM medium was used to dilute the miRNAs or the transfection reagent and the cells were transfected for 24 hours. The next day for treatment groups, medium was replaced with fresh SMCM medium containing TNF-α and IGF-1 at 100 ng/ml each and incubated further for additional 24 hours. Cell lysates were prepared for either protein or miRNA and mRNA isolation as described above.
2.6. QPCR
Using the total RNA was isolated as described above, First-strand cDNA synthesis was carried with 1 μg of total RNA mixed with the buffer containing oligo dT (1μg), 5 X reaction buffer, MgCl2, dNTP mix, RNAse inhibitor and Improm II reverse transcriptase, as described in the Improm II reverse transcription kit (Promega, Madison, WI). Following the first strand synthesis, real-time PCR was done using 8μl cDNA, 10 μl SYBR green PCR master mix (BioRad Laboratories, Hercules, CA) and forward and reverse primers (10 picomol/μl) (Integrated DNA Technologies, San Diego, CA) in the real-time PCR system (CFX96, BioRad Laboratories, Hercules, CA). The primer sequences used were: DNMT1-FP 5′-AAGAACGGCATCCTGTACCGAGTT-3′ RP 5′-TGCTGCCTTTGATGTAGTCGGAGT-3′; GAPDH-FP 5′-GGGAAGGTGAAGGTCGGAGT-3′, RP 5′-TTGAGGTCAATGAAGGGGTCA-3′ and SOCS3qPCR-FP 5′-AGCAGCGATGGAATTACCTGGAAC-3′ RP 5′-TCCAGCCCAATACCTGACACAGAA-3′. The PCR cycling conditions used were as follows: 5min at 95 ºC for initial denaturation, 40 cycles of 30s at 95ºC, 30s at 58ºC, and 30s at 72ºC. Each real-time PCR was carried out with at least 3 individual samples. The threshold cycle values were averaged, and the specificity of the primers was analyzed by melting curve. Calculations of relative gene expression was done using BioRad CFX manager software based on the ΔΔCt method by normalizing against the housekeeping gene glyceraldehyde-3-phosphate dehydrogenase (GAPDH).
2.7. Protein Isolation and Western Blot Analysis
Cell lysates were prepared in RIPA buffer and the lysate was sonicated followed by high speed centrifugation at 4°C and the clarified supernatant was collected. Total protein in the supernatant was analyzed by the bicinchoninic acid (Sigma-Aldrich, St. Louis, MO) method using bovine serum albumin as the standard. The protein samples (20 μg) were separated on a 10–20% SDS–PAGE gradient gel (Bio-Rad, Hercules, CA) and then transferred onto nitro cellulose membrane (Bio-Rad, Hercules, CA) for immunoblotting. Blots were blocked with 5% milk in PBS-Tween for 1 hour, and the membranes were washed and incubated for 1 hour with target antibodies which were diluted at 1:1000 in nonfat milk in buffer containing PBS and Tween-20. Subsequently, the blots were washed and incubated for another 1 hour with Horseradish peroxidase conjugated anti-rabbit secondary antibodies (Novus Biologicals, Littleton, CO) diluted at 1:1000. Finally, the immunoblot was developed with ECL Chemiluminescence detection reagents (Amersham Pharmacia Biotech, Piscataway, NJ) and hybridization of proteins specific to each antibody were detected using UVP Bioimaging system or BioRad ChemiDoc. For quantification, the blots were initially probed with the antibody of interest, and then stripped in stripping buffer prior to probing with the housekeeping protein GAPDH.
2.8. DNMT1 Activity Assay
After transfection and stimulation of HCASMCs, nuclear protein extract was prepared using the EpiQuik nuclear extraction kit from ET Epigentek (Brooklyn, NY, USA) following the manufacturer’s protocols and the protein concentration was measured using bicinchoninic acid (Sigma, St Louis) method. The activity of DNMT1 in the nuclear extracts was determined using the Epiquick DNMT1 assay Kit which measures total DNMTI levels (Epigentek). About 20μg of protein was added to a 96-well plate that was pre-coated with substrate specific for DNMT1in a total volume of 100 μl, and the plate was incubated for 90 min at 37 °C, which was followed by another incubation for 30 min at 37 °C in 150 μl of blocking buffer after removing the reaction solution. Primary antibody for DNMT1 was added after blocking and incubated for 1 h at room temperature followed by the addition of secondary antibody after washing and incubated for additional 30 min at room temperature. Finally, after washing the secondary antibody (detection antibody), developing solution was added and the reaction was stopped by adding stop solution. To quantify the enzyme activity, absorbance was measured at 450 nm with an optional reference wavelength of 655nm.
2.9. Cell Proliferation – MTT Assay
About 5000 cells were seeded in each well of a 96 well plate and the cells were allowed to adhere overnight. Next day the medium was replaced with 100 μl of fresh SMCM medium and continued to grow for another 24 hours. The cells were then transfected with either mimic or inhibitor of hsa-miR-1264, or negative control miRNA as described above but scaling the experiment down for 96 well plate volume. After 24 hours, the transfected cells were treated with or without TNF-α and IGF-1 at 100 ng/ml each, and the cells were incubated for additional 24 hours. To assess the cell proliferation, MTT assay was carried out. Briefly, to the cells that were transfected and treated, about 1/10 volume of MTT reagent dissolved at 5 mg/ml concentration in PBS was added and the cells were further incubated for 4 hours. The supernatant was aspirated and equal volume of acidified isopropanol was added and the plate was incubated at room temperature for about 10 min and quantified using spectrophotometer at 570 nm wavelength. Samples were analyzed in six replicates and the average values with standard error are shown.
3.0. Cell wound migration assay
Assay was carried out in 24 well plate. About 50,000 cells were seeded in each well of a 24 well plate. Once the cells reached about 60% confluence, using a 1 ml pipette tip, the cells were scrapped off and transfected and treated with TNF-α and IGF-1 followed by scrapping of the cells using a 1 ml tip. The cells were then transfected and treated as described above but scaling up for 24 well format. After three consecutive medium changes for three days, the cells were observed under the Nikon microscope at 4× magnification and the acquired images are shown. The white solid lines delineate the initial scrapped off zone, and the cells migrated insides the scrapped off zone are considered to estimate the extent of cell proliferation.
3.1. Statistical Analysis
MicroSoft Office Excel 2013 and GraphPad Prism version 2, was used to analyze the data. Data are shown as the mean ± standard error of mean (SEM). Multiple group comparisons were performed with Bonferroni’s multiple comparison test and One-way ANOVA. Probability (P) value < 0.05 was considered as statistically significant.
3. Results
3.1. TNF-α and IGF-1 induces aberrant change in miRNA expression in HCASMCs
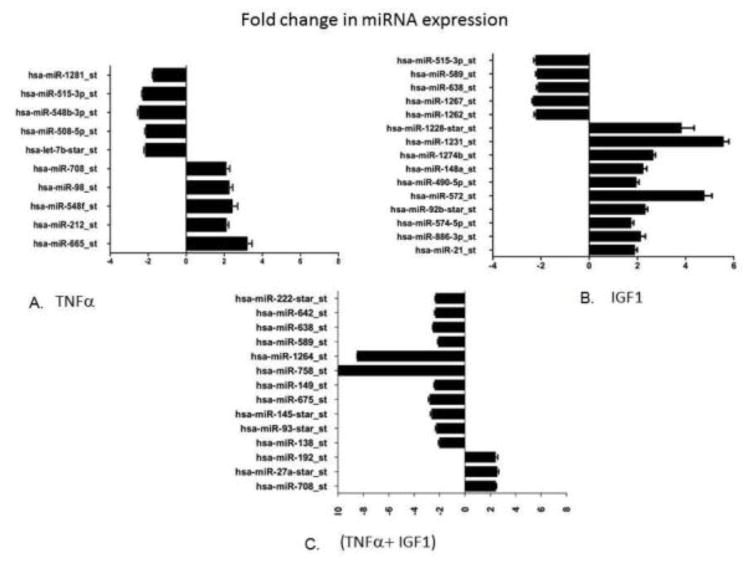
Changes in expression levels of different miRNAs were observed in HCASMCs that were treated with TNF-α (100ng/ml) and IGF-1 (100ng/ml) both individually and in combination. MiRNA expression was initially determined by Affymetrix GeneChip miRNA 2.0 array that contains a comprehensive miRNA coverage for human, mouse and rat models on a single array. This array provides 15,664 probe sets of mature miRNA from miRBase V15 for 132 organisms containing 2,334 snoRNAs and scaRNAs besides 2,202 pre-miRNA probes for humans, mice and rats. In the present study, we focused on variations in human miRNA expressions in conditions that mimic in vivo hyperplasia. Results from the Affymetrix miRNA GeneChip were further confirmed by performing gene expression analysis using TaqMan Open Array system and human miRNA panel with Megaplex primer pools that contains 758 human miRNA probes, along with necessary controls. A significant change in the expression of several miRNAs was observed when HCASMCs were treated with TNF-α and IGF-1 alone and in combination. Figure 1 shows expression profiles of different miRNAs identified from cells that were treated with TNF-α or IGF-1 or with both TNF-α and IGF-1. Only those miRNAs that exhibited significant change in expression levels or are specific for each treatment were shown. Five miRNAs with 2–3 fold increase, and also five miRNAs with about 2-fold decrease in their expression levels, as compared with controls, were identified in HCASMCs that were treated with TNF-α alone (Figure 1). Also ten different miRNAs that were up-regulated with about 2–6 fold increase along with five miRNAs that were down regulated by over 2-folds in HCASMCs stimulated with IGF-1 alone are shown (Figure 1). Three different miRNAs that were up-regulated with over 2-fold increase, and twelve miRNAs that were found down-regulated with about 2–10 fold change in their expression levels in HCASMCs that were treated with both TNF-α and IGF-1 was shown (Figure 1). Most interestingly, these results demonstrate that two miRNAs namely hsa-miR-758 and hsa-miR-1264 were remarkably down-regulated in the TNF-α and IGF-1 treated group with about 8–10 fold decrease in their expression levels. These findings support our earlier reported observations that simultaneous treatment with TNF-α and IGF-1 leads to inhibition of SOCS3 expression indicating that miRNAs have key role in regulating SOCS3 gene expression during neointimal hyperplasia.
Figure 1.
MiRNA expression profiling. Panel A shows the difference in the expression profiles of specific miRNAs in cells that were stimulated with TNF-α (100 ng/ml), compared to non-stimulated control cells. Panel B shows the difference in the expression profiles of specific miRNAs in cells that were stimulated with IGF-1 (100 ng/ml), compared to non-stimulated control cells. Panel C shows the difference in the expression profiles of specific miRNAs in the cells stimulated with both TNF-α and IGF-1 (100 ng/ml each), compared to non-stimulated control cells. Graph shows the observed difference in the observed expression values using ΔΔCT method.
3.2. DNMT1 is a Direct Target of hsa-miR-1264
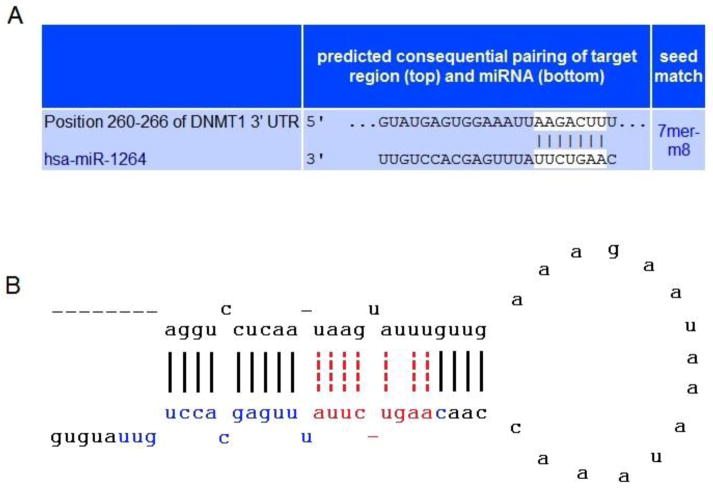
We identified that SOCS3 gene was not a direct target of hsa-miR-1264 when analyzed with MiRanda and TargetScan 4.0 [22, 23]. Interestingly, Target scan analysis showed that DNMT1 has a binding site for miR-1264 within its 3’UTR (Figure 2). Functionally, miRNAs bind to the target mRNA sequences and form heteroduplex, and this binding occurs with about 2 to 8 nucleotides of miRNA (called seed region) and the mRNA transcript. The effective binding between the miRNA seed region and mRNA is the key factor that affects expression of the transcript [24, 25]. In Figure 2A and 2B, we show the TargetScan analysis of the seed region of hsa-miR-1264 which potentially interacts with the 3′ UTR sequence of DNMT1 transcript. Our previous studies demonstrated that HCASMCs when treated with both TNF-α and IGF-1 together results in methylation of SOCS3 promoter, and it is well documented that DNMT1 is a key enzyme that methylates DNA especially in the CpG islands including the promoter region. Further, our recent analysis of the complete human SOCS3 gene using EMBOSS Cpgplot revealed the presence of a major CpG island spanning about 2.4 kb region which encompasses the promoter region and the first exon, indicating a potential site for DNMT1 activity [26, 27]. Thus the miRNA analysis clearly indicates a regulatory role of hsa-miR-1264 whose expression was down-regulated in HCASMCs that were treated with both TNF-α and IGF-1.
Figure 2.
The binding specificity of miRNA hsa-miR-1264 onDNMT1 transcript. The upper panel A shows sequence homology and binding of hsa-miR-1264 within the 3’UTR of DNMT1 transcript, with seed region highlighted, as predicted by TargetScan analysis. Lower panel B shows the Stem-Loop structure of hsa-miR-1264, which is similar to the one identified using miRBase mircroRNA database. The mature sequence of hsa-miR-1264 is highlighted in blue and red. The sequence highlighted in red alone represents the critical seed region of the miRNA hsa-miR-1264.
3.3. hsa-miR-1264 Increases SOCS3 Expression in HCASMCs
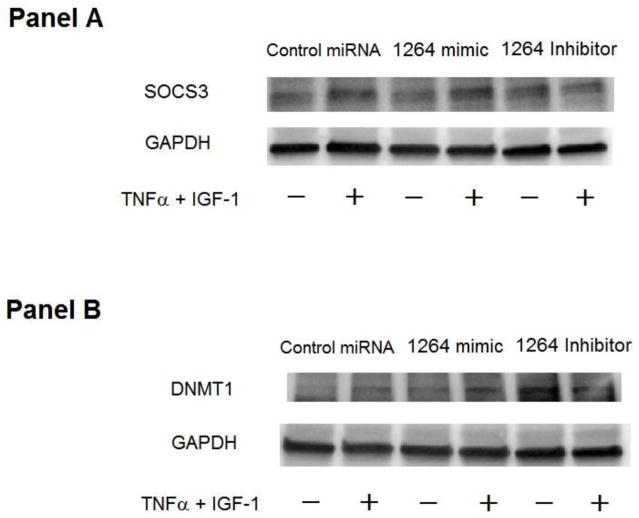
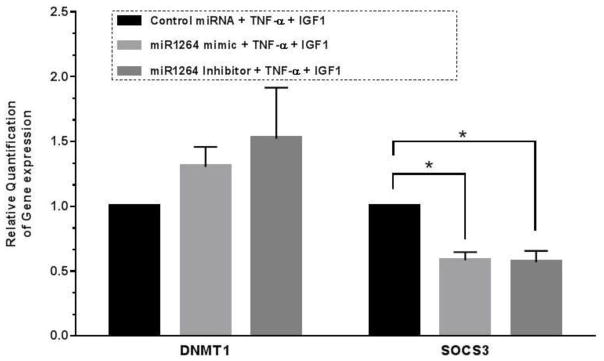
Regulation of SOCS3 expression in HCASMCs was studied by transfecting cells with hsa-miR-1264 precursor, which is a double-stranded, small RNA molecule that mimics endogenous miRNA. Expression of hsa-miR-1264 in HCASMCs through cellular transfection resulted in up-regulation of SOCS3 expression (Figure 3A). Transfection of hsa-miR-1264 into HCASMCs was found to increase SOCS3 expression in presence of TNF-α and IGF-1, Real-Time PCR analysis showed significant down-regulation of SOCS3 expression in presence of TNF-α and IGF-1 in cells that were treated with either hsa-miR-1264 or its inhibitor (Figure 4).
Figure 3.
Effect of hsa-miR-1264 mimic and its inhibitor on DNMT1 and SOCS3 expression. Panel A is a Western blot showing the expression of SOCS3 in cells transfected with hsa-miR-1264 mimic or its inhibitor and treated with or without TNF-α and IGF-1. Panel B is a Western blot showing the expression of DNMT1 in the cells transfected with hsa-miR-1264 mimic or its inhibitor and treated with or without TNF-α and IGF-1.
Figure 4.
Q-PCR quantification showing the fold change in gene expression of SOCS3 and DNMT1 in the cells transfected with hsa-miR-1264 mimic or its inhibitor and treated with TNF-α and IGF-1. Values are shown as mean ± SEM. Data are representative of four individual data sets (N=4, *p<0.05 compared to control group).
3.4. DNMT1 Expression in HCASMCs Transfected with hsa-miR-1264 or its specific inhibitor
Expression of DNMT1 in HCASMCs that were transfected with hsa-miR-1264 precursor or inhibitor, in presence or absence of both TNF-α and IGF-1 was tested. Increased expression of DNMT1 was observed in cells transfected with hsa-miR-1264 inhibitor (Figure 3B). Since hsa-miR-1264 was identified to specifically target DNMT1 transcript, real-time PCR analysis was also carried out which showed a drastic increase in DNMT1 transcripts in cells that were transfected with hsa-miR-1264 inhibitor (Figure 4).
3.5. DNMT1 Enzyme Activity in HCASMCs Transfected with hsa-miR-1264
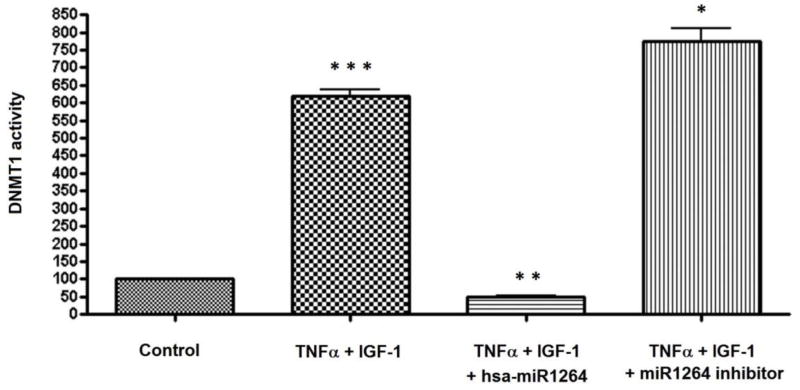
DNMT1 activity was measured in the nuclear extracts of HCASMCs that were transfected with hsa-miR-1264 mimic or inhibitor in presence of both TNF-α and IGF-1. DNMT1 activity was found drastically reduced in cells that were transfected with hsa-miR-1264 mimic, and in cells that were transfected with the hsa-miR-1264 inhibitor, about 6-fold increase in the expression was observed when compared to untreated control (Figure 5). The observed drastic reduction in DNMT1 enzyme activity in cells transfected with hsa-miR-1264 confirms that DNMT1 is a direct target of hsa-miR-1264.
Figure 5.
Enzyme activity of DNMT1 in HCASMCs cells. Cells were transfected with or without hsa-miR-1264 mimic or its inhibitor and treated with or without TNF-α and IGF-1. DNMT1 activity was quantified in the nuclear extracts. There was significant increase in DNMT1 activity in the cells treated with TNF-α and IGF-1 compared to control (*** p <0.001). However, this increased activity of DNMT1 was completely inhibited by transfecting the cells with hsa-miR-1264 followed by treatment with TNF-α and IGF-1 (**p <0.05). Also, the transfection of the cells with has-miR1264 inhibitor followed by treatment with TNF-α and IGF-1 increased the DNMT1 activity compared to the treatment with TNF-α and IGF-1 (* p <0.01).
3.6. Effect of hsa-miR-1264 Mimic or Inhibitor on Cell Proliferation
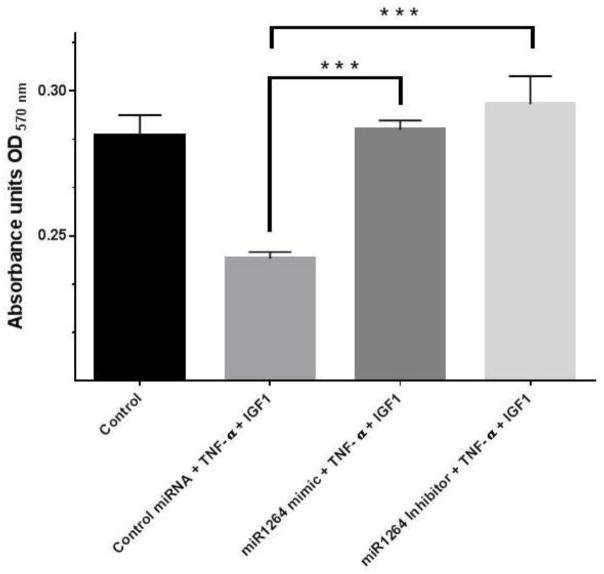
HCASMCs that are transfected with either negative control miRNA, or hsa-miR-1264 mimic or inhibitor and treated with TNF-α and/or IGF-1 showed significant difference in cell proliferation as assessed using MTT reagent. When compared with normal control or transfection control, increased cell proliferation was observed in cells transfected with hsa-miR-1264 inhibitor and treated with both TNF-α and IGF-1 (Figure 6).
Figure 6.
Effect of hsa-miR-1264 mimic or its inhibitor on HCASMCs cell proliferation. Transfected cells were treated with TNF-α and IGF-1, and their proliferation was assessed using MTT reagent. Values are shown as mean ± SEM. Data are representative of six individual data sets (N=6, ***p<0.005 compared to control group cells that were transfected with negative control miRNA).
3.7. Effect of hsa-miR-1264 Mimic or Inhibitor on Cell Migration
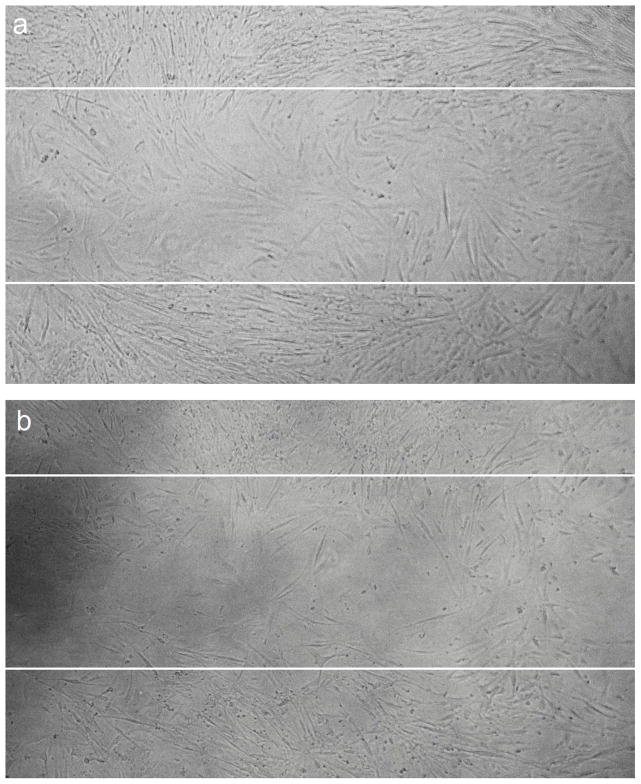
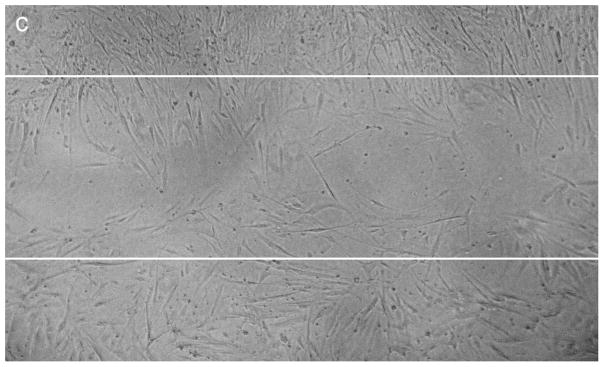
Significant difference in cell migration was observed when HCASMCs were transfected with hsa-miR-1264 mimic or its inhibitor when compared to control miRNA. Cell migration was evaluated with in vitro scratch wound assay, where cells were grown to about 70% confluence and transfected the mimic or inhibitor or the negative control. In the control group, complete migration of cells inside the scrapped zone was observed. Increased proliferation of cells was observed in the cells transfected with the inhibitor and treated with TNF-α and IGF-1 compared to cells that were transfected with the mimic and treated with TNF-α and IGF-1 (Figure 7A–C).
Figure 7.
Effect of hsa-miR-1264 mimic or its inhibitor on HCASMCs cell migration. Cell migration was assessed using scratch wound assay where cells were scrapped off in the culture vessel to create a cell free clear zone. Panel A shows migration of TNF-α and IGF-1 treated control cells inside the scrapped off zone. The initially created cell free clear zone is represented as solid white lines. Panel B shows migration of cells transfected with hsa-miR-1264 mimic and treated with TNF-α and IGF-1. Panel C shows migration of cells transfected with hsa-miR-1264 inhibitor and treated with TNF-α and IGF-1.
4. Discussion
We previously found dramatic decrease in SOCS3 expression in the neointimal lesion following balloon angioplasty in the coronary arteries of atherosclerotic swine and in in vitro culture [9]. In HCASMCs, we reported that only IGF-1 treatment, but not TNF-α, induces activation of STAT3, whereas NF-κB was activated only in response to TNF-α treatment, but not IGF-1, and the co-immunoprecipitation results showed the binding of activated STAT3 to NF-κB in the cells that were treated with both TNF-α and IGF-1 [10]. These results not only suggest that SOCS3 expression was pre-transcriptionally inhibited, but it also essentiates the role of canonical JAK/STAT/NF-κB pathway in regulating SOCS3 expression. Another interesting finding was that the treatment with TNF-α and IGF-1 increased DNMT1 expression, and silencing of DNMT1 using siRNA restored SOCS3, as analyzed by methylation specific PCR. These findings suggested that SOCS3 promoter methylation and STAT3-NF-κB interaction are two independent mechanisms that are responsible for the decrease in SOCS3 expression in HCASMCs in the presence of both TNF-α and IGF-1 [10].
The presence of a major CpG island in the SOCS3 promoter region and our earlier evidence of methylation in the promoter region of SOCS3 indicate that the expression of SOCS3 could also be epigenetically regulated by miRNAs that play a critical role in regulating gene expression by binding to the 3′ UTR of target mRNA to either repress translation or cause degradation. It is estimated that more than 60% of the human genes are regulated by miRNAs, and the clear role of miRNAs in gene regulation suggests that epigenetic alterations in gene expression is the important mechanism in the cell occurring during growth, development, and in pathological conditions. The increasing volume of literature on the role of microRNAs in different human diseases, especially in cancer and other neoplastic diseases, suggests their clinical significance. Several clinical trials are in progress to evaluate the therapeutic potential of microRNAs in human diseases such as the MRX34 which was used as “microRNA replacement therapy” in patients with liver cancer. Therefore, the present study was conducted to identify potential miRNAs and their role in regulating SOCS3 expression in smooth muscle cells that were treated with high concentrations of cytokines and growth factors, such as TNF-α and IGF-1, which would mimic the in vivo pathological conditions resulting in the development of intimal hyperplasia and restenosis in coronary arteries following coronary intervention.
Similar to our previous reports using porcine smooth muscle cells in which TNF-α or IGF-1 treatment independently resulted in the inhibition of SOCS3 expression; in this study their combined treatment also resulted in significant inhibition of SOCS3 in HCASMCs. We further extended this study to identify the possible miRNAs associated with SOCS3 regulation, and carried out a comprehensive expression profiling of miRNAs in HCASMCs that were stimulated with inflammatory cytokine TNF-α and growth factor IGF-1 together and independently. In this study, we identified significant variations in the expression levels of different miRNAs in HCASMCs that were treated with both TNF-α and IGF-1 together or independently. Here, we show a few of the specific miRNAs whose expressions were significantly altered, as analyzed by miRNA expression profiling (Figure 1). Among them, two miRNAs, hsa-miR-758 and hsa-miR-1264, showed a drastic decrease in their expression (8–10 fold) which correlated with the inhibition of SOCS3 expression when treated with TNF-α and IGF-1.
The miRNA, hsa-miR-758 was recently reported to be repressed in cholesterol loaded macrophages in which expression of ABCA1 transporter that is crucial for cholesterol efflux was inhibited. Since depletion of cholesterol from macrophage foam cells is a direct mechanism that aids in the prevention of atherogenesis, targeting hsa-miR-758 was identified as having high therapeutic significance in treating cardiovascular diseases [28]. In our study, we identified that the combined treatment of TNF-α and IGF-1 results in a drastic decrease in the anti-atherogenic miRNA hsa-miR-758 (Figure 1). Although down-regulation of hsa-miR-758 correlates with inhibition of SOCS3 expression, an extensive study is required to understand the precise mechanism involved by considering different physiological pathways that hsa-miR-758 may regulate.
Interestingly, a novel finding that we show in our present study was the down-regulation of hsa-miR-1264 in HCASMCs treated with both TNF-α and IGF-1, contributing to the inhibition of SOCS3 expression. To our knowledge this is the first report that shows clinical significance of this mircroRNA and its role in hyperplasia and restenosis. Since repression of SOCS3 is associated with decreased expression of hsa-miR-1264, we presumed that SOCS3 may not be a direct target for hsa-miR-1264. We then analyzed the complete genetic sequence of SOCS3 gene and as anticipated we could not find any binding site for hsa-miR-1264 within the SOCS3 gene. Interestingly, the 3’UTR of DNMT1 gene showed a potential binding site for hsa-miR-1264 as analyzed using Target scan and miRBase (Figure 2) [29–33]. These findings are in coherence with recent reports on hsa-miR-21 and hsa-miR-148 which induce DNA hypomethylation by directly and indirectly targeting DNMT1 in Lupus CD4+ T cells [13, 17]. As seen in Figure 1, the present findings also identify that IGF-1 treatment alone can result in significant up-regulation of hsa-miR-21 and hsa-miR-148a. Also, it was reported earlier that down-regulation of hsa-miR-149 was involved in hypermethylation of the neighboring CpG islands in colorectal cancer [34]. This specific function involving down-regulation of hsa-miR-149 leading to hypermethylation can also be deciphered from the present study where treatment with both TNF-α and IGF-1 resulted in significant down-regulation of hsa-miR-149 (Figure 1).
Further, we analyzed for the presence of putative CpG islands in the complete sequence of human SOCS3 gene (NCBI Accession # NG_016851) using EMBOSS Cpgplot [26]. The results show the presence of a major CpG island that encompasses the entire promoter region and also all of the coding sequence of the SOCS3 gene[27]. This CpG island between 4.261 kb to 6.673 kb of the genomic region of SOCS3 gene was detected with a high observed to expected ratio of 0.784 (threshold value is 0.65), and spans about 2.413 kb with 71.3% GC content. Presence of such a CpG island indicates it as a hot spot for DNMT1 activity and is potentially an ideal target for promoter methylation. In addition, we evaluated the binding characteristics of hsa-miR-1264 on DNMT1 transcript using TargetScan analysis. As seen in Figure 2, it is evident that the seed region of this miRNA has a strong binding site at 260–266 nt position in the 3’UTR of DNMT1 transcript, which clearly indicates that down-regulation of hsa-miR-1264 leads to continued activity of DNMT1 which then engages in constitutive methylation activity in the cell. As a result of this methylation expression of several genes could be down-regulated.
We previously reported that upon combined treatment with TNF-α and IGF-1, SOCS3 expression was inhibited or greatly reduced. Therefore, we hypothesize that this down-regulation of SOCS3 could be a consequence of DNMT1 activity. DNMT1 is the key enzyme that is responsible for methylation of DNA sequences especially in the promoter region. In the present study we carried out additional studies to unravel the epigenetic mechanism that regulates DNMT1 activity. First we transfected HCASMCs to express hsa-miR-1264 mimic where we found that SOCS3 expression was increased in presence of both TNF-α and IGF-1 (Figure 3, Panel A). Also, we studied the DNMT1 expression in HCASMCs that were transfected with hsa-miR-1264 and treated with both TNF-α and IGF-1. As seen in Figure 3 Panel B, transfection of hsa-miR-1264 inhibitor in HCASMCs resulted in up-regulation of DNMT1. Further, qPCR analysis with primers specific for DNMT1 using total RNA isolated from cells showed increased levels of DNMT1 mRNA (Figure 4). Also, the DNMT1 enzyme activity was significantly decreased in cells that were transfected with hsa-miR-1264 and treated with both TNF-α and IGF-1 (Figure 5). These results clearly demonstrate that DNMT1 is a direct target of hsa-miR-1264, which binds to 3’UTR region of the DNMT1 transcript and inhibits its expression. Therefore, in the absence of DNMT1, SOCS3 expression was restored which then inhibits cellular proliferation. This hypothesis was further confirmed by the inhibition of cell proliferation in the cells transfected with hsa-miR-1264 inhibitor (Figure 6). In addition, we also conducted cell migration through scratch wound assay which further supports our hypothesis that hsa-miR-1264 potentially interacts with DNMT1 and regulates cell migration by inhibiting SOCS3 expression (Figure 7A–C).
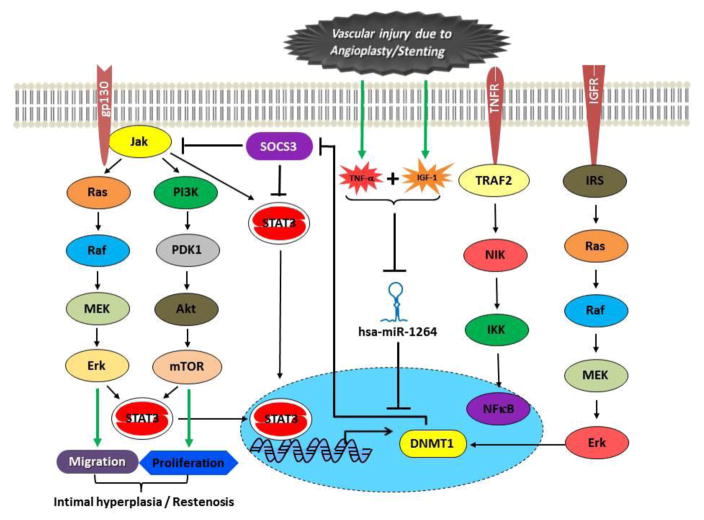
Inhibition of SOCS3 in the presence of both TNF-α and IGF-1 and not by either TNF-α or IGF-1 alone indicates that the mechanism of SOCS3 inhibition is very complex and is mediated through more than one signaling mechanism. This also infers that DNMT1 mediated genome wide methylation is one of the epigenetic mechanisms that contributes to SOCS3 inhibition and the expression of DNMT1 is regulated by its specific microRNA hsa-miR-1264. In addition, we did not observe any measurable change in phospho-STAT3 and phospho-NFκB in cells transfected with hsa-miR-1264 or its inhibitor, which further indicates that SOCS3 inhibition in cells treated with both TNF-α and IGF-1 is mediated through multiple mechanisms., Also, our present findings clearly demonstrate an epigenetic mechanism where DNMT1 mediated global methylation affects SOCS3 expression through promoter methylation. Importantly, our findings identify that the activity of DNMT1 was restored by a specific microRNA hsa-miR-1264, which is down-regulated due to the presence of both TNF-α and IGF-1 causing smooth muscle cell hyperplasia and restenosis. Figure 8 illustrates the mechanism and the effector molecules involved in the microRNA hsa-miR-1264 mediated direct regulation of DNMT1 expression which indirectly regulates SOCS3.
Figure 8.
Schematic illustration of the underlying mechanism of action of hsa-miR-1264. Figure illustrates the potential epigenetic mechanism and the interference of hsa-miR-1264 in regulating DNMT1 and SOCS3 expression during vascular injury induced restenosis.
In consistence with the recent report on miRNA hsa-miR-155 regulating JAK/STAT pathway [35], the present miRNA analysis showed a seven-fold increase in hsa-miR-155 expression when treated with both TNF-α and IGF-1 together. However, since a five-fold increase in its expression was also observed in cells treated with TNF-α, its expression in relevance with SOCS3 regulation could not be deciphered at present which requires further investigation. Similarly, expression of hsa-miR-21 was observed to be increased in all three treatments and since hsa-miR-21 was identified to be up-regulated during vascular injury [36], its precise role in hyperplasia in association with SOCS3 expression is yet to be determined. Also, about 2-fold decrease in the expression of hsa-miR-222 was observed during SOCS3 silencing in HCASMCs stimulated with both TNF-α and IGF-1 (Figure 1). Similar down-regulation of hsa-miR-222 along with hsa-miR-221 was reported to suppress VSMC proliferation in rat carotid arteries in vivo and in neointimal lesions after coronary intervention. It was also shown that the two miRNAs hsa-miR-222 and hsa-miR-212 have potential binding sites in the 3’UTR regions of two cyclin kinase inhibitors, p27 (Kip1) and p57 (Kip2) genes. In rat carotid artery, increased expression of hsa-miR-221 and hsa-miR-222 was reported at the site of angioplasty-induced vascular smooth muscle cell hyperplasia, which indicates that these miRNAs are required for smooth muscle cell proliferation [37]. In the vascular walls with neointimal lesion and in dedifferentiated VSMC cultured cells, down-regulation of hsa-miR-145 was reported [38]. Also, knockdown of hsa-miR-145, which belongs to the cardiovascular specific miRNA cluster, was shown to cause abnormal decrease in blood pressure resulting from thinning of the vessel walls, suggesting the modulation of cytoskeletal organization by hsa-miR-145 [36]. Our present study further strengthens the above findings, as we observed that the treatment with both TNF-α and IGF-1 results in about 3-fold decrease in the expression of hsa-miR-145 (Figure 1), which could be a causative factor associated with the proliferation of smooth muscle cells resulting in neointimal hyperplasia and restenosis.
5. Conclusion
Following interventional procedures at the site of injury in the coronary arteries, high levels of cytokines TNF-α and IGF-1 were previously reported. The results presented here demonstrate for the first time that the presence of both inflammatory cytokines TNF-α and IGF-1 in HCASMCs reduced the expression of hsa-miR-1264. Down-regulation of hsa-miR-1264 contributed to the continued expression and activity of DMNT1, which caused methylation of SOCS3 promoter affecting its gene expression. Therefore, targeting hsa-miR-1264 would have therapeutic benefits in the prevention of neointimal hyperplasia resulting from interventional surgical procedures.
Acknowledgments
The research awards R01HL104516, R01HL112597, and R01HL120659 from the Office of the Director, and National Heart Lung and Blood Institute, National Institutes of Health, USA to DKA supported this work. The content of this research article is solely the responsibility of the authors and does not necessarily represent the official views of the National Institutes of Health, USA.
Glossary
- SOCS3
suppressor of cytokine signaling-3
- HCASMC
human coronary artery smooth muscle cell
- GAPDH
glyceraldehyde 3-phosphate dehydrogenase
- DNMT1
DNA methyl transferase-1
- IGF-1
insulin like growth factor-1
- TNF-α
Tumor necrotic factor-α
- miR
microRNA
References
- 1.Yoshimura A, Ohkubo T, Kiguchi T, Jenkins NA, Gilbert DJ, Copeland NG, Hara T, Miyajima A. A novel cytokine-inducible gene CIS encodes an SH2-containing protein that binds to tyrosine-phosphorylated interleukin 3 and erythropoietin receptors. EMBO J. 1995;14:2816–2826. doi: 10.1002/j.1460-2075.1995.tb07281.x. [DOI] [PMC free article] [PubMed] [Google Scholar]
- 2.Barclay JL, Anderson ST, Waters MJ, Curlewis JD. SOCS3 as a tumor suppressor in breast cancer cells, and its regulation by PRL. Int J Cancer. 2009;124:1756–1766. doi: 10.1002/ijc.24172. [DOI] [PubMed] [Google Scholar]
- 3.Wormald S, Hilton DJ. Inhibitors of cytokine signal transduction. J Biol Chem. 2004;279:821–824. doi: 10.1074/jbc.R300030200. [DOI] [PubMed] [Google Scholar]
- 4.Yasukawa H, Sasaki A, Yoshimura A. Negative regulation of cytokine signaling pathways. Annu Rev Immunol. 2000;18:143–164. doi: 10.1146/annurev.immunol.18.1.143. [DOI] [PubMed] [Google Scholar]
- 5.Krebs DL, Hilton DJ. SOCS: physiological suppressors of cytokine signaling. J Cell Sci. 2000;113( Pt 16):2813–2819. doi: 10.1242/jcs.113.16.2813. [DOI] [PubMed] [Google Scholar]
- 6.Monraats PS, Pires NM, Schepers A, Agema WR, Boesten LS, de Vries MR, Zwinderman AH, de Maat MP, Doevendans PA, de Winter RJ, Tio RA, Waltenberger J, ‘t Hart LM, Frants RR, Quax PH, van Vlijmen BJ, Havekes LM, van der Laarse A, van der Wall EE, Jukema JW. Tumor necrosis factor-alpha plays an important role in restenosis development. FASEB J. 2005;19:1998–2004. doi: 10.1096/fj.05-4634com. [DOI] [PubMed] [Google Scholar]
- 7.Allen TR, Krueger KD, Hunter WJ, 3rd, Agrawal DK. Evidence that insulin-like growth factor-1 requires protein kinase C-epsilon, PI3-kinase and mitogen-activated protein kinase pathways to protect human vascular smooth muscle cells from apoptosis. Immunol Cell Biol. 2005;83:651–667. doi: 10.1111/j.1440-1711.2005.01387.x. [DOI] [PubMed] [Google Scholar]
- 8.Grant MB, Wargovich TJ, Bush DM, Player DW, Caballero S, Foegh M, Spoerri PE. Expression of IGF-1, IGF-1 receptor and TGF-beta following balloon angioplasty in atherosclerotic and normal rabbit iliac arteries: an immunocytochemical study. Regul Pept. 1999;79:47–53. doi: 10.1016/s0167-0115(98)00027-5. [DOI] [PubMed] [Google Scholar]
- 9.Gupta GK, Dhar K, Del Core MG, Hunter WJ, 3rd, Hatzoudis GI, Agrawal DK. Suppressor of cytokine signaling-3 and intimal hyperplasia in porcine coronary arteries following coronary intervention. Exp Mol Pathol. 2011;91:346–352. doi: 10.1016/j.yexmp.2011.04.004. [DOI] [PMC free article] [PubMed] [Google Scholar]
- 10.Dhar K, Rakesh K, Pankajakshan D, Agrawal DK. SOCS3 promotor hypermethylation and STAT3-NF-kappaB interaction downregulate SOCS3 expression in human coronary artery smooth muscle cells. Am J Physiol Heart Circ Physiol. 2013;304:H776–85. doi: 10.1152/ajpheart.00570.2012. [DOI] [PMC free article] [PubMed] [Google Scholar]
- 11.Robertson KD. DNA methylation, methyltransferases, and cancer. Oncogene. 2001;20:3139–3155. doi: 10.1038/sj.onc.1204341. [DOI] [PubMed] [Google Scholar]
- 12.Bestor TH. The DNA methyltransferases of mammals. Hum Mol Genet. 2000;9:2395–2402. doi: 10.1093/hmg/9.16.2395. [DOI] [PubMed] [Google Scholar]
- 13.Braconi C, Huang N, Patel T. MicroRNA-dependent regulation of DNA methyltransferase-1 and tumor suppressor gene expression by interleukin-6 in human malignant cholangiocytes. Hepatology. 2010;51:881–890. doi: 10.1002/hep.23381. [DOI] [PMC free article] [PubMed] [Google Scholar]
- 14.Fabbri M, Garzon R, Cimmino A, Liu Z, Zanesi N, Callegari E, Liu S, Alder H, Costinean S, Fernandez-Cymering C, Volinia S, Guler G, Morrison CD, Chan KK, Marcucci G, Calin GA, Huebner K, Croce CM. MicroRNA-29 family reverts aberrant methylation in lung cancer by targeting DNA methyltransferases 3A and 3B. Proc Natl Acad Sci U S A. 2007;104:15805–15810. doi: 10.1073/pnas.0707628104. [DOI] [PMC free article] [PubMed] [Google Scholar]
- 15.Garzon R, Liu S, Fabbri M, Liu Z, Heaphy CE, Callegari E, Schwind S, Pang J, Yu J, Muthusamy N, Havelange V, Volinia S, Blum W, Rush LJ, Perrotti D, Andreeff M, Bloomfield CD, Byrd JC, Chan K, Wu LC, Croce CM, Marcucci G. MicroRNA-29b induces global DNA hypomethylation and tumor suppressor gene reexpression in acute myeloid leukemia by targeting directly DNMT3A and 3B and indirectly DNMT1. Blood. 2009;113:6411–6418. doi: 10.1182/blood-2008-07-170589. [DOI] [PMC free article] [PubMed] [Google Scholar]
- 16.Huang J, Wang Y, Guo Y, Sun S. Down-regulated microRNA-152 induces aberrant DNA methylation in hepatitis B virus-related hepatocellular carcinoma by targeting DNA methyltransferase 1. Hepatology. 2010;52:60–70. doi: 10.1002/hep.23660. [DOI] [PubMed] [Google Scholar]
- 17.Pan W, Zhu S, Yuan M, Cui H, Wang L, Luo X, Li J, Zhou H, Tang Y, Shen N. MicroRNA-21 and microRNA-148a contribute to DNA hypomethylation in lupus CD4+ T cells by directly and indirectly targeting DNA methyltransferase 1. J Immunol. 2010;184:6773–6781. doi: 10.4049/jimmunol.0904060. [DOI] [PubMed] [Google Scholar]
- 18.Wang YS, Chou WW, Chen KC, Cheng HY, Lin RT, Juo SH. MicroRNA-152 mediates DNMT1-regulated DNA methylation in the estrogen receptor alpha gene. PLoS One. 2012;7:e30635. doi: 10.1371/journal.pone.0030635. [DOI] [PMC free article] [PubMed] [Google Scholar]
- 19.Xie C, Zhang J, Chen YE. MicroRNA and vascular smooth muscle cells. Vitam Horm. 2011;87:321–339. doi: 10.1016/B978-0-12-386015-6.00034-2. [DOI] [PubMed] [Google Scholar]
- 20.Rajewsky N. microRNA target predictions in animals. Nat Genet. 2006;38(Suppl):S8–13. doi: 10.1038/ng1798. [DOI] [PubMed] [Google Scholar]
- 21.Friedman RC, Farh KK, Burge CB, Bartel DP. Most mammalian mRNAs are conserved targets of microRNAs. Genome Res. 2009;19:92–105. doi: 10.1101/gr.082701.108. [DOI] [PMC free article] [PubMed] [Google Scholar]
- 22.John B, Enright AJ, Aravin A, Tuschl T, Sander C, Marks DS. Human MicroRNA targets. PLoS Biol. 2004;2:e363. doi: 10.1371/journal.pbio.0020363. [DOI] [PMC free article] [PubMed] [Google Scholar]
- 23.Krek A, Grun D, Poy MN, Wolf R, Rosenberg L, Epstein EJ, MacMenamin P, da Piedade I, Gunsalus KC, Stoffel M, Rajewsky N. Combinatorial microRNA target predictions. Nat Genet. 2005;37:495–500. doi: 10.1038/ng1536. [DOI] [PubMed] [Google Scholar]
- 24.van Rooij E. The art of microRNA research. Circ Res. 2011;108:219–234. doi: 10.1161/CIRCRESAHA.110.227496. [DOI] [PubMed] [Google Scholar]
- 25.Thomson DW, Bracken CP, Goodall GJ. Experimental strategies for microRNA target identification. Nucleic Acids Res. 2011;39:6845–6853. doi: 10.1093/nar/gkr330. [DOI] [PMC free article] [PubMed] [Google Scholar]
- 26.Rice P, Longden I, Bleasby A. EMBOSS: the European Molecular Biology Open Software Suite. Trends Genet. 2000;16:276–277. doi: 10.1016/s0168-9525(00)02024-2. [DOI] [PubMed] [Google Scholar]
- 27.Boosani CS, Agrawal DK. Methylation and microRNA-mediated epigenetic regulation of SOCS3. Mol Biol Rep. 2015;42:853–872. doi: 10.1007/s11033-015-3860-3. [DOI] [PMC free article] [PubMed] [Google Scholar]
- 28.Ramirez CM, Davalos A, Goedeke L, Salerno AG, Warrier N, Cirera-Salinas D, Suarez Y, Fernandez-Hernando C. MicroRNA-758 regulates cholesterol efflux through posttranscriptional repression of ATP-binding cassette transporter A1. Arterioscler Thromb Vasc Biol. 2011;31:2707–2714. doi: 10.1161/ATVBAHA.111.232066. [DOI] [PMC free article] [PubMed] [Google Scholar]
- 29.Lewis BP, Burge CB, Bartel DP. Conserved seed pairing, often flanked by adenosines, indicates that thousands of human genes are microRNA targets. Cell. 2005;120:15–20. doi: 10.1016/j.cell.2004.12.035. [DOI] [PubMed] [Google Scholar]
- 30.Kozomara A, Griffiths-Jones S. miRBase: integrating microRNA annotation and deep-sequencing data. Nucleic Acids Res. 2011;39:D152–7. doi: 10.1093/nar/gkq1027. [DOI] [PMC free article] [PubMed] [Google Scholar]
- 31.Griffiths-Jones S. The microRNA Registry. Nucleic Acids Res. 2004;32:D109–11. doi: 10.1093/nar/gkh023. [DOI] [PMC free article] [PubMed] [Google Scholar]
- 32.Griffiths-Jones S. miRBase: the microRNA sequence database. Methods Mol Biol. 2006;342:129–138. doi: 10.1385/1-59745-123-1:129. [DOI] [PubMed] [Google Scholar]
- 33.Griffiths-Jones S, Saini HK, van Dongen S, Enright AJ. miRBase: tools for microRNA genomics. Nucleic Acids Res. 2008;36:D154–8. doi: 10.1093/nar/gkm952. [DOI] [PMC free article] [PubMed] [Google Scholar]
- 34.Zhou H, Park S, Housman J, Elia L, Lim B, Yajima T. MicroRNA-19a (miR-19a) Regulates gp130 Signaling by Inhibiting Suppressor of Cytokine Signaling-3 (SOCS3) Protein Translation. Circulation. 2009:S835. [Google Scholar]
- 35.Persson JL. miR-155 meets the JAK/STAT pathway. Cell Cycle. 2013;12:2170. doi: 10.4161/cc.25548. [DOI] [PMC free article] [PubMed] [Google Scholar]
- 36.Xin M, Small EM, Sutherland LB, Qi X, McAnally J, Plato CF, Richardson JA, Bassel-Duby R, Olson EN. MicroRNAs miR-143 and miR-145 modulate cytoskeletal dynamics and responsiveness of smooth muscle cells to injury. Genes Dev. 2009;23:2166–2178. doi: 10.1101/gad.1842409. [DOI] [PMC free article] [PubMed] [Google Scholar]
- 37.Liu X, Cheng Y, Zhang S, Lin Y, Yang J, Zhang C. A necessary role of miR-221 and miR-222 in vascular smooth muscle cell proliferation and neointimal hyperplasia. Circ Res. 2009;104:476–487. doi: 10.1161/CIRCRESAHA.108.185363. [DOI] [PMC free article] [PubMed] [Google Scholar]
- 38.Cheng Y, Liu X, Yang J, Lin Y, Xu DZ, Lu Q, Deitch EA, Huo Y, Delphin ES, Zhang C. MicroRNA-145, a novel smooth muscle cell phenotypic marker and modulator, controls vascular neointimal lesion formation. Circ Res. 2009;105:158–166. doi: 10.1161/CIRCRESAHA.109.197517. [DOI] [PMC free article] [PubMed] [Google Scholar]


