Abstract
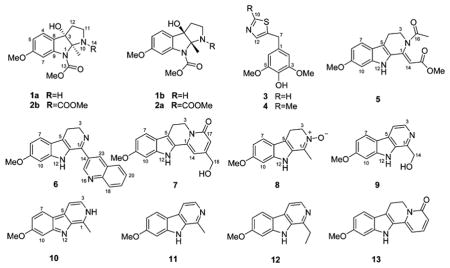
Investigation of the alkaloids from Peganum harmala seeds yielded two pairs of unique racemic pyrroloindole alkaloids, (±)-peganines A–B (1–2); two rare thiazole derivatives, peganumals A–B (3–4); six new β-carboline alkaloids, pegaharmines F–K (5–10); and 12 known analogues. Their structures, including stereochemistry, were elucidated through spectroscopic analyses, quantum chemistry calculations, and single-crystal X-ray diffraction. Notably, the incorporation of pyrrole and indole moieties in peganines A–B, thiazole fragments in peganumals A–B, and a C-1 α,β-unsaturated ester motif in pegaharmine F (5) are all rare, and their presence in the genus Peganum were demonstrated for the first time. All isolates were tested for antiproliferative activities against the HL-60, PC-3, and SGC-7901 cancer cell lines, and compounds 9, 11, 12, and 13 exhibited moderate cytotoxicity against HL-60 cancer cell lines with IC50 values in the range of 4.36–9.25 μM.
Graphical Abstract

Cancer is a persistent global concern and leading cause of mortality. Therefore, the fight against cancer presents a significant challenge for modern science and technology.1 With ongoing and valuable contributions, natural products are a consistent source of potential antitumor agents and lead compounds that have provided the inspiration for the semi or total synthesis of new effective drugs, such as vinca alkaloids, taxol, and etoposide.2 Over the past few years, the β-carboline alkaloids have attracted the interest of both synthesis and natural product chemists because of their unique and fascinating structures, biosynthesis, and wide-ranging biological activities, most notably their antitumor activity.3
Peganum harmala L. (Zygophyllaceae) is an herb rich in β-carboline alkaloids that has been used traditionally for hundreds of years in northwestern China for the treatment of alimentary tract cancer and malaria.4 We previously reported 12 new β-carboline alkaloids from P. harmala seeds with significant anticancer activities.5 These exciting discoveries prompted us to pursue the minor anticancer alkaloids of this plant. The isolation of the crude alkaloids subsequently led to the identification of 12 known alkaloids and 12 structurally diverse new alkaloids: (±)-peganines A–B (1–2, in the optically pure form), peganumals A–B (3–4), and pegaharmines F–K (5–10). Their structures, including stereochemistry, were elucidated on the basis of extensive spectroscopic evidence, quantum chemistry calculations, and single-crystal X-ray diffraction. Herein, the isolation, structure identification, and biological evaluation of these alkaloids are discussed.
RESULTS AND DISCUSSION
Investigation of the alkaloids from Peganum harmala seeds afforded two pairs of unique racemic pyrroloindole alkaloids (1–2), two rare thiazole derivatives (3–4), six new β-carboline alkaloids (5–10), and the following known alkaloids: harmine (11),6 1-ethyl-7-methoxy-9H-pyrido[3,4-b]indole (12),7 harmalanine (13),8 harmaline (14),9 arenarine C (15),10 methyl harmate (16),11 harmic amide (17),12 harman (18),13 7-methoxy-1-oxo-1,2,3,4-tetrahydro-β-carboline (19),14 harmine N-oxide (20),11 11-methoxyrutaecarprine (21),15 and luotonin C (22).16
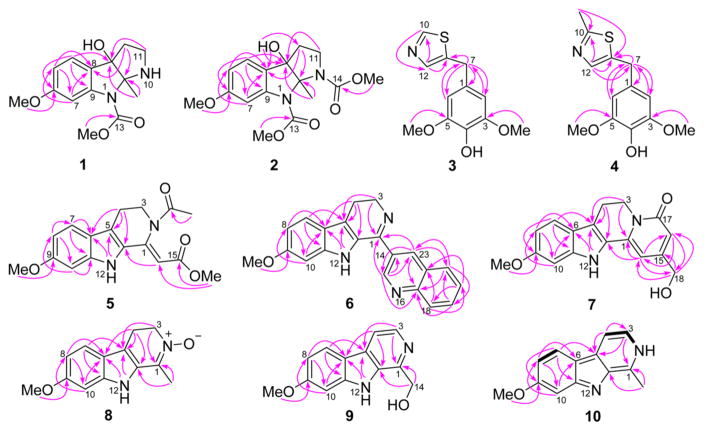
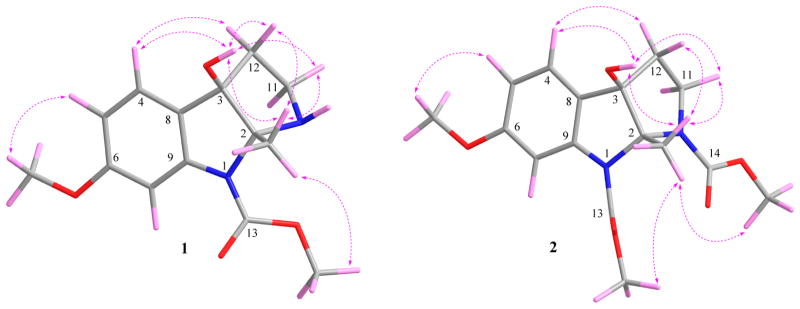
Peganine A (1) was isolated as a yellow, amorphous powder, and its molecular formula was determined to be C14H18N2O4 with seven indices of hydrogen deficiency via a positive HRESIMS ion at m/z 279.1325 [M + H]+ (calcd for 279.1339). In the IR spectrum, bands from NH/OH (3429 cm−1) and carbonyl (1715 cm−1) functionalities were observed, and in the UV absorption spectrum, dihydroindole maxima at 216, 244, and 289 nm were detected.5,17 The 1H NMR data (Table 1) showed the presence of an aromatic ABX spin system (δH 7.22, 1H, d, J = 8.4 Hz; 6.61, 1H, dd, J = 8.4, 2.3 Hz; 7.34, 1H, broadening), two O-methyls (δH 3.77, 3H, s and 3.72, 3H, s), one methyl (δH 1.47, 3H, s), one broad OH singlet (δH 5.50, 1H, br.s), and two methylenes. The 13C NMR data (Table 3) showed the presence of 14 carbon resonances that were classified by HSQC data as one carbamate carbonyl (δC 152.7), six aromatic carbons, two O-methyls, one methyl, two methylenes, one dinitrogenated secondary carbon, and one oxygenated tertiary carbon, which was consistent with the 1H NMR data. Analysis of the 1D and 2D NMR data, especially the HMBC data (Figure 1), indicated the presence of a pyrroloindole motif. The key HMBC cross-peaks of H-4 (δH 7.22) with C-3 (δC 85.7), C-6 (δC 160.0), and C-9 (δC 142.3) and of 6-OCH3 (δH 3.72) with C-6, revealed the presence of a 6-methoxydihydroindole substructure in 1. Additionally, the deshielded carbon resonance at δC 85.7 indicated the oxygen substitution at this position, while the resonance at δC 91.2 was assigned to C-2, which was linked to N-1 and N-10.17 The HSQC and 1H NMR spectra defined the presence of an –NCH2CH2– moiety that was connected to the dihydroindole at C-3 from the three-bond HMBC cross-peaks from H-12 to both C-2 and C-8 (δC 127.0). Therefore, the unique pyrroloindole skeleton was defined. The HMBC cross-peaks of 13-OCH3 (δH 3.77) with C-13 (δC 152.7) and 2-CH3 (δH 1.47) with C-2 and C-3 and the NOESY correlation of 13-OCH3 with 2-CH3 (δH 1.47) unambiguously assigned the methoxycarbonyl and the methyl groups at N-1 and C-2, respectively. The structure of 1 was thus determined (Figure 1). The broadening of the NMR signals of C(H)-7 and 9 presumably resulted from the “N-1 chirality inversion”. The NOESY (Figure 2) correlations of 2-CH3 with 3-OH (δH 5.50), H-11β (δH 2.83), and H-12β (δH 2.04) and of 3-OH with 2-CH3, H-11β, and H-12β indicated that 2-CH3 and 3-OH were cofacial.
Table 1.
1H NMR Data of Compounds 1 and 2
| Position | 1a δH (J in Hz) | 2a δH (J in Hz) |
|---|---|---|
| 4 | 7.22 d (8.4) | 7.33 d (8.4) |
| 5 | 6.61 dd (8.4, 2.3) | 6.65 dd (8.4, 2.4) |
| 7 | 7.34 (broadening) | 7.35 d (2.4) |
| 11α | 2.45 ddd (12.0, 9.2, 5.2) | 2.69 dt (6.5, 12.0) |
| 11β | 2.83 dd (9.2, 7.2) | 3.42 dd (12.0, 8.9) |
| 12α | 1.92 dd (12.0, 5.2) | 2.31 dd (12.0, 6.5) |
| 12β | 2.04 dt (7.2, 12.0) | 2.13 dt (8.9, 12.0) |
| 2-CH3 | 1.47 s | 1.75 s |
| 3-OH | 5.50, br.s | 5.81, br.s |
| 6-OCH3 | 3.72 s | 3.74 s |
| 13-OCH3 | 3.77 s | 3.75 s |
| 14-OCH3 | 3.53 s |
Run at 400 MHz, DMSO-d6.
Table 3.
13C NMR Data of Compounds 1–10
| position | 1a | 2b | 3b | 4a | 5a | 6b | 7b | 8a | 9a | 10b |
|---|---|---|---|---|---|---|---|---|---|---|
| 1 | 130.0 | 130.1 | –c | 156.4 | 137.4 | 134.5 | 144.2 | 127.8 | ||
| 2 | 91.2 | 87.6 | 105.9 | 105.8 | ||||||
| 3 | 85.7 | 84.5 | 148.0 | 148.0 | –c | 48.5 | 40.0 | 59.4 | 137.1 | 127.3 |
| 4 | 124.8 | 124.5 | 134.2 | 134.1 | 21.4 | 19.1 | 19.2 | 19.5 | 113.0 | 100.4 |
| 5 | 108.4 | 108.8 | 148.0 | 148.0 | 120.4 | 117.3 | 113.5 | 106.5 | 128.3 | 127.0 |
| 6 | 160.0 | 160.5 | 105.9 | 105.8 | 117.9 | 119.3 | 119.7 | 120.0 | 114.3 | 117.0 |
| 7 | 100.2 | 102.6 | 31.9 | 32.3 | 120.4 | 120.6 | 120.1 | 119.5 | 122.4 | 124.0 |
| 8 | 127.0 | 124.9 | 139.4 | 138.8 | 110.4 | 110.9 | 110.2 | 110.2 | 109.0 | 115.7 |
| 9 | 142.3 | 143.7 | 158.0 | 157.5 | 157.4 | 156.3 | 160.1 | 157.2 | ||
| 10 | 153.1 | 164.1 | 94.1 | 94.7 | 94.4 | 94.6 | 94.9 | 108.5 | ||
| 11 | 42.1 | 44.3 | 139.0 | 138.1 | 139.3 | 138.7 | 142.2 | 143.4 | ||
| 12 | 42.8 | 31.8 | 140.5 | 139.1 | ||||||
| 13 | 152.7 | 154.0 | 127.9 | 126.6 | 126.6 | 129.0 | 133.6 | 146.2 | ||
| 14 | 153.5 | 102.2 | 130.0 | 97.5 | 63.6 | |||||
| 15 | 165.2 | 149.7 | 154.1 | |||||||
| 16 | 170.0 | 111.8 | ||||||||
| 17 | 21.9 | 147.8 | 161.6 | |||||||
| 18 | 128.7 | 61.5 | ||||||||
| 19 | 130.4 | |||||||||
| 20 | 127.1 | |||||||||
| 21 | 129.2 | |||||||||
| 22 | 127.0 | |||||||||
| 23 | 135.5 | |||||||||
| –CH3 | 21.1 | 20.0 | 18.8 | 12.3 | 20.9 | |||||
| 3,5-OCH3 | 56.0 | 56.0 | ||||||||
| 9-OCH3 | 55.2 | 55.1 | 55.2 | 55.2 | 55.3 | 55.1 | ||||
| 6/13-OCH3 | 55.2/52.2 | 55.2/52.2 | ||||||||
| 14/15-OCH3 | 51.8 | 51.0 |
Run at 100 MHz, DMSO-d6.
Run at 150 MHz, DMSO-d6.
Not detected.
Figure 1.
Key HMBC and COSY correlations for 1–10.
Figure 2.
Selected NOESY correlations for 1 and 2 (with hydrogens shown).
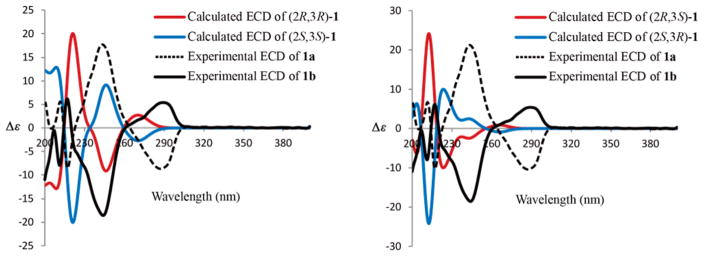
Peganine A (1) showed a specific rotation of [α]20D + 2 (c 0.1, MeOH), implying that it may be a racemic mixture. Subsequent chiral HPLC separation of 1 gave the corresponding enantiomers (−)-1 (1a) and (+)-1 (1b) in a 48:52 ratio (Figure S4, Supporting Information). The absolute configurations of (−)- and (+)-1 were determined as (2S, 3S) (1a) and (2R, 3R) (1b), respectively, by the experimental and calculated ECD spectra using the Gaussian09 program (Figure 3).18 The ECD spectra of the (2R, 3S) and (2S, 3R) stereoisomers were also calculated and did not correlate with the experimental data (Figure 3), thus further supporting the determined absolute configurations.
Figure 3.
Experimental ECD spectra of 1a and 1b, and the calculated ECD spectra of four stereoisomers of 1.
Peganine B (2) was obtained as a yellow, amorphous powder, and its molecular formula was determined as C16H20N2O6 with eight indices of hydrogen deficiency via a sodium adduct HRESIMS ion at m/z 359.1219 [M + Na]+ (calcd for 359.1214). In the IR spectrum, bands due to hydroxyl (3429 cm−1) and carbonyl (1710 cm−1) groups were observed, and in the UV absorption spectrum, dihydroindole maxima at 216, 245, and 290 nm were detected.5,17 The 1H and 13C NMR data (Tables 1 and 3) were similar to those of 1, indicating that compound 2 had the same scaffold as 1, but that 2 had two methoxycarbonyl motifs (δC 154.0, 153.5, 52.2, and 51.9). The HMBC cross-peaks of 13-OCH3 (δH 3.75) with C-13 (δC 154.0), 14-OCH3 (δH 3.53) with C-14 (δC 153.5), 2-CH3 (δH 1.75) with C-2 and C-3 (δC 84.5), and 3-OH (δH 5.81) with C-12 (δC 31.8), C-3, and C-8 (δC 124.9), and the NOESY correlations of 2-CH3 with both 13-OCH3 and 14-OCH3 indicated that the methoxycarbonyl, methyl, and hydroxy groups were located at N-1, N-3, C-2, and C-6, respectively. Interpretation of the 2D NMR spectra confirmed the proposed structure of 2. Moreover, 13C NMR chemical shift calculation data further supported this structure, with all differences between experimental and calculated chemical shifts below 8.0 ppm (Table 4).19 Similar to compound 1, the broadening of the C-14 NMR signal is presumably attributable to the “N-10 chirality inversion”. The NOESY (Figure 2) correlations of 2-CH3 with 3-OH (δH 5.81), H-11β (δH 3.42), and H-12β (δH 2.13) and of 3-OH with 2-CH3, H-11β, and H-12β implied that 2-CH3 and 3-OH were cofacial.
Table 4.
Experimental and Calculated 13C NMR Data for Compounds 2, 3a, and 3b
| no. | 2
|
3
|
3a
|
3b
|
||||
|---|---|---|---|---|---|---|---|---|
| exptl | calcd | error | exptl | calcd | error | calcd | error | |
| 1 | 130.0 | 131.0 | 1.0 | 131.7 | 1.7 | |||
| 2 | 87.6 | 90.2 | 2.6 | 105.9 | 112.4 | 6.5 | 106.6 | 0.7 |
| 3 | 148.0 | 148.6 | 0.6 | 148.5 | 0.5 | |||
| 4 | 44.3 | 45.9 | 1.6 | 134.2 | 139.3 | 5.1 | 137.3 | 3.1 |
| 5 | 31.8 | 32.4 | 0.6 | 148.0 | 148.5 | 0.5 | 147.8 | −0.2 |
| 6 | 84.5 | 88.6 | 4.1 | 105.9 | 102.9 | −3.0 | 101.8 | −4.1 |
| 7 | 124.9 | 121.9 | −3.0 | 31.9 | 36.4 | 4.5 | 40.4 | 8.5 |
| 8 | 124.5 | 122.2 | −2.3 | 139.4 | 145.2 | 5.8 | 159.8 | 20.4 |
| 9 | 108.8 | 109.7 | 0.9 | |||||
| 10 | 160.5 | 161.8 | 1.3 | 153.1 | 155.3 | 2.2 | 155.2 | 2.1 |
| 11 | 102.6 | 100.5 | −2.1 | |||||
| 12 | 143.7 | 146.0 | 2.3 | 140.5 | 140.8 | 0.3 | 117.2 | −23.3 |
| 13 | 154.0 | 154.0 | 0 | |||||
| 14 | 153.5 | 152.5 | −1.0 | |||||
| 2-CH3 | 20.0 | 21.9 | 1.9 | |||||
| 3-OCH3/10-OCH3 | 55.2 | 53.0 | −2.2 | 56.0 | 53.7 | −2.3 | 53.8 | −2.2 |
| 5-OCH3/13-OCH3 | 52.2 | 51.0 | −1.2 | 56.0 | 56.2 | 0.2 | 54.3 | −1.7 |
| 15-OCH3 | 51.9 | 51.3 | −0.6 | |||||
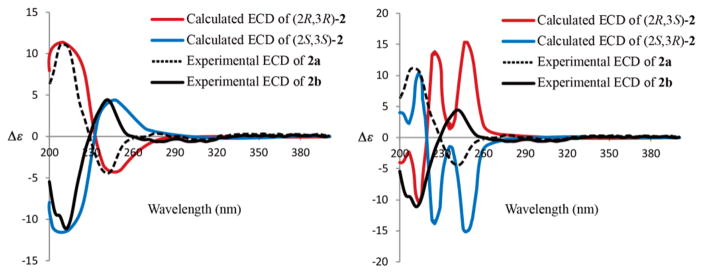
Again, the small specific rotation of [α]20D − 3 (c 0.1, MeOH) indicated that compound 2 should also be a racemic mixture, which was subsequently separated by chiral HPLC into the enantiomers (+)-2 (2a) and (−) -2 (2b) in a 48:52 ratio (Figure S5), possessing the opposite ECD curves and specific rotations. The simulated ECD spectra of (2R, 3R)-2 and (2S, 3S) -2 matched those of the enantiomers (+)-2 and (−) -2, respectively, thus, unambiguously assigning the absolute configurations of 2a and 2b (Figure 4). The calculated ECD spectra of enantiomers (2R, 3S)-2 and (2S, 3R)-2 did not correlate with the experimental data (Figure 4).
Figure 4.
Experimental ECD spectra of 2a and 2b, and the calculated ECD spectra of four stereoisomers of 2.
Peganumal A (3) was isolated as a white, amorphous powder. Its molecular formula was assigned as C12H13NO3S by a sodium adduct HRESIMS ion at m/z 274.0518 [M + Na]+ (calcd for 274.0508). In the 13C and 1H NMR data (Table 3 and Experimental Section), a two-proton aromatic singlet at δH 6.52 (2H, s) and two magnetically equivalent O-methyls at δH 3.71 (6H, s), together with six aromatic carbon signals at δC 105.9 (× 2), 130.0, 134.2, and 148.0 (× 2) as well as two O-methyls at δC 56.0 (× 2) indicated that compound 3 has a 4-hydroxy-3,5-dimethoxyphenyl moiety. Considering the three remaining aromatic carbon signals at δC 139.4, 140.5, and 153.1 and a molecular formula of C12H13NO3S, the presence of a thiazole fragment was readily deduced. The two moieties are connected by a methylene, which is supported by the HMBC cross-peaks of H2-7 (2H, s) to C-1 (δC 130.0), C-2,6 (δC 105.9), and C-8 (δC 139.4). However, the substitution position of the methylene group on the thiazole fragment was not clear, and two possible structures 3a and 3b were proposed (Figure 5). Therefore, 13C NMR chemical shift calculations were carried out by quantum chemical methods.19 For structure 3a, all differences between experimental and calculated chemical shifts were below 8.0 ppm (Table 4). However, structure 3b shows chemical shift differences of 8.5, 20.4, and 23.3 ppm for C-7, C-8, and C-12, respectively (Table 4). Thus, the structure of compound 3 was defined as shown.
Figure 5.
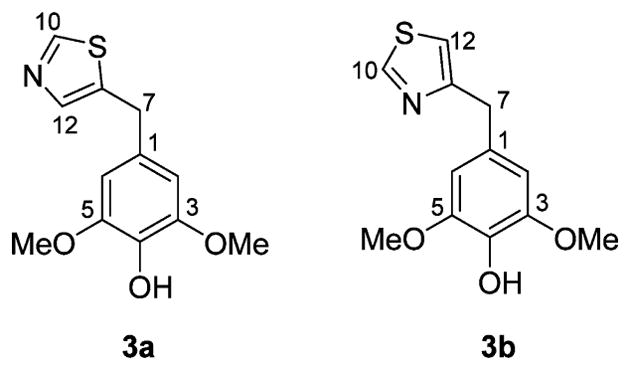
Two possible structures of 3 (3a and 3b).
Peganumal B (4) was isolated as a white, amorphous powder. Its molecular formula was determined to be C13H15NO3S by a positive HRESIMS ion at m/z 266.0855 [M + H]+ (calcd for 266.0845). The 13C and 1H NMR data (Table 3 and Experimental Section) were similar to those of 3, but the replacement of H-10 by a methyl group. Analyses of the NMR data defined the structure of compound 4 as shown (Figure 1). Compounds bearing thiazole motifs, such as 3 and 4, are rare in natural products and are now reported in the genus Peganum for the first time.
Pegaharmine F (5) was isolated as orange-red, block crystals. Its molecular formula was established as C17H18N2O4 based on a sodium adduct HRESIMS ion at m/z 337.1174 [M + Na]+ (calcd for 337.1159). Its UV spectrum had absorption maxima at 209 and 374 nm, suggesting that an extended conjugation system was present. The IR spectrum showed absorption bands at 3357 and 1678 cm−1, suggesting that NH and carbonyl functionalities were present. The 1H, 13C NMR (Tables 2 and 3), and HSQC data showed the presence of a 3,4-dihydro-β-carboline skeleton from the observation of an indole NH (δH 11.43, 1H, br.s), an O-methyl (δH 3.79, 3H, s), an aromatic ABX spin system (δH 7.40, 1H, d, J = 8.8 Hz; 6.69, 1H, dd, J = 8.8, 1.4 Hz; 6.81, 1H, d, J = 1.4 Hz), and a –CH2CH2N- moiety (the resonance of one methylene was not detected). The signals at δC 102.2, 165.2, and 51.0 were assigned to C-14, C-15, and 15-OCH3, respectively, and corresponded to an acrylate moiety (though the resonance of C-1 was not detected), which is connected to C-13 based on the HMBC cross-peak of H-14 (δH 6.24) to C-13 (δC 127.9). Additionally, complete assembly required linking an acetyl group (δH 2.06, δC 21.9, 170.0) to N-2 to assign the full structure 5. However, the undetected resonances of H2-3, C-1, and C-3 in the 1H and 13C NMR spectra, which are necessary to reasonably elucidate the structure of compound 5, prompted recourse to a crystallographic study. X-ray quality crystals were grown by the slow evaporation of a methanol solution and the X-ray crystallography analysis (Figure 6) unambiguously confirmed the proposed structure. The undetected NMR signals of C(H)-1, -3, -15, and -16 could be attributed to the “N-2 chirality inversion” (an unusual acetyl located at N-2), presumably initiated by the p-π conjugation between the N-2 electron pair and the 16-CO group (Scheme 1). A similar phenomenon was also observed in the case of chaetominine, a cytotoxic alkaloid possessing a quinazolinone moiety.20
Table 2.
1H NMR Data of Compounds 5–10
| Position | 5b δH (J in Hz) | 6b δH (J in Hz) | 7b δH (J in Hz) | 8a δH (J in Hz) | 9a δH (J in Hz) | 10b δH (J in Hz) |
|---|---|---|---|---|---|---|
| 3 | –c | 3.98 t (8.6) | 4.22 t (6.9) | 4.07 t (8.4) | 8.19 d (5.0) | 7.56 t (2.4) |
| 4 | 2.80 m | 2.89 t (8.6) | 2.99 t (6.9) | 3.05 t (8.4) | 7.89 d (5.0) | 7.00 dd (2.4, 1.0) |
| 7 | 7.40 d (8.8) | 7.54 d (8.8) | 7.46 d (8.7) | 7.37 d (8.8) | 8.06 d (8.6) | 8.11 d (8.8) |
| 8 | 6.69 dd (8.8, 1.4) | 6.78 dd (8.8, 2.3) | 6.72 dd (8.7, 2.2) | 6.70 dd (8.8, 2.2) | 6.84 dd (8.6, 2.1) | 7.14 dd (8.8, 2.6) |
| 10 | 6.81 d (1.4) | 6.92 d (2.3) | 6.85 d (2.2) | 6.83 d (2.2) | 7.12 d (2.1) | 7.38 d (2.6) |
| 14 | 6.24 s | 6.57 d (1.5) | 4.92 d (5.2) | |||
| 15 | 9.25 d (2.2) | |||||
| 16 | 6.22 d (1.5) | |||||
| 18 | 8.11 br.d (8.3) | 4.38 s | ||||
| 19 | 7.85 ddd (8.3, 8.3, 1.4) | |||||
| 20 | 7.69 ddd (8.3, 8.3, 1.4) | |||||
| 21 | 8.12 dd (8.3, 1.4) | |||||
| 23 | 8.67 d (2.2) | |||||
| –CH3 | 2.06 s | 2.25 s | 2.77 | |||
| –OCH3 | 3.79, 3.63 s | 3.80 s | 3.80 s | 3.77 s | 3.86 s | 3.87 s |
| –OH | 5.42 br.s | 5.51 t (5.2) | ||||
| –NH | 11.43 br.s | 11.09 br.s | 11.56 br.s | 11.17 br.s | 11.22 br.s | 11.93 br.s |
Run at 400 MHz, DMSO-d6.
Run at 600 MHz, DMSO-d6.
Not detected.
Figure 6.
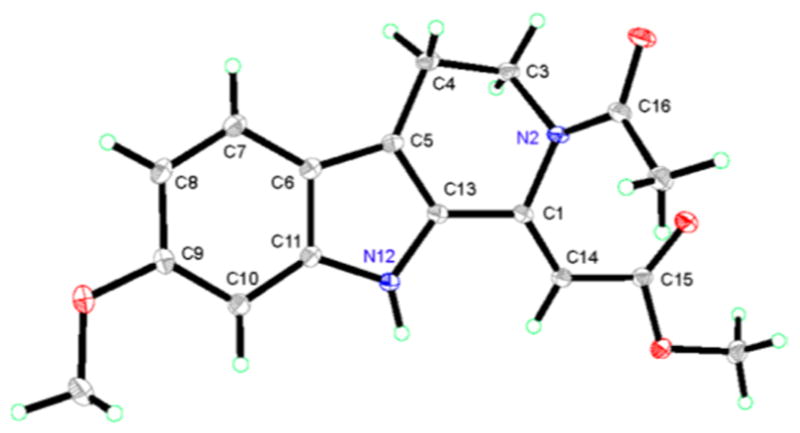
Oak Ridge thermal ellipsoid plot (ORTEP) drawings of pegaharmine F (5) based on single X-ray crystallographic analysis.
Scheme 1.
Proposed “N-2 Chirality Inversion” of 5 due to p–π Conjugation
Pegaharmine G (6) was isolated as a yellow, amorphous powder, and its molecular formula was determined as C21H17N3O based on a positive HRESIMS ion at m/z 328.1440 [M + H]+ (calcd for 328.1444). The spectroscopic data of compound 6 were similar to trigonostemonine E.21 Comparison of the 1H and 13C NMR data (Tables 2 and 3) with those of trigonostemonine E revealed that compound 6 had a similar 1-(quinolinyl)-3,4-dihydro-β-carboline skeleton. Unlike trigonostemonine E, the O-methyl group was located at C-9. Additionally, the key HMBC cross-peaks of H-15 (δH 9.25, 1H, d, J = 2.2 Hz) with C-1 (δC 156.4), C-14 (δC 130.0), C-23(δC 135.5), and C-17 (δC 147.8) and of H-23 (δH 8.67, 1H, d, J = 2.2 Hz) with C-1, C-15 (δC 149.7), C-21 (δC 129.2), and C-17 linked the 3,4-dihydro-β-carboline and quinoline moieties via C-1 and C-14. Thus, the structure of compound 6 was determined as shown.
Pegaharmine H (7) was isolated as a yellow, amorphous powder, and its molecular formula was determined as C17H16N2O3 based on a positive HRESIMS ion at m/z 297.1236 [M + H]+ (calcd for 297.1234). Comparison of the 1H and 13C NMR data (Tables 2 and 3) of 7 with those of harmalanine8 indicated that these two compounds had similar skeletons, but that compound 7 had an aromatic proton been replaced by a hydroxymethyl group. The HMBC cross-peaks of H-14 (δH 6.57) with both C-16 (δC 111.8) and C-18 (δC 61.5), of H-16 (δH 6.22) with both C-14 (δC 97.5) and C-18, and of H-18 (δH 4.38) with C-15 (δC 154.1), C-14, and C-16 revealed that the hydroxymethyl group was located at C-15. Therefore, the structure of compound 7 was elucidated as shown.
Pegaharmine I (8) was isolated as a yellow, amorphous powder, and its molecular formula was determined to be C13H14N2O2 via a positive HRESIMS ion at m/z 231.1133 [M + H]+ (calcd for 231.1128). Comparison of 1H and 13C NMR data (Tables 2 and 3) of 8 with those of harmaline9 indicated that they contained the identical 3,4-dihydro-β-carboline skeleton. However, the deshielded methylene carbon resonance at δC 59.4 (C-3) and the shielded imino carbon resonance at δC 134.5 (C-1) implied the presence of an N-oxide group in 8, which was confirmed by the observation of an [M-16]+ ion at m/z 214.1122. The structure of compound 8 was thus defined, and the key HMBC cross-peaks are displayed in Figure 1.
Pegaharmine J (9) was isolated as a yellow, amorphous powder, and its molecular formula was assigned as C13H12N2O2 based on a positive HRESIMS ion at m/z 229.0975 [M + H]+ (calcd for 229.0972). Its UV spectrum had absorption maxima at 242 and 301 nm, indicating that a β-carboline chromophore was present.5,21 Analysis of the NMR data of 9 (Tables 2 and 3) revealed the presence of a β-carboline skeleton, which was in accord with an aromatic ABX spin system (δH 8.06, 1H, d, J = 8.6 Hz; 6.84, 1H, dd, J = 8.6, 2.1 Hz; 7.12, 1H, d, J = 2.1 Hz) and a pair of ortho-coupled protons (δH 8.19, 1H, d, J = 5.0 Hz; 7.89, 1H, d, J = 5.0 Hz). In addition, the key HMBC cross-peaks of H-14 (δH 4.92, 2H, d, J = 5.2 Hz) to C-13 (δC 133.6) and C-1 (δC 144.2) indicated that a hydroxymethyl group was located at C-1. Therefore, the structure of compound 9 was determined as shown.
Pegaharmine K (10) was isolated as a yellow, amorphous powder, and its molecular formula was assigned as C13H12N2O based on a positive HRESIMS ion at m/z 213.1018 [M + H]+ (calcd for 213.1022). Analysis of NMR data of 10 (Tables 2 and 3), especially the HMBC cross-peaks (Figure 1), indicated that compound 10 was an isomer of harmine.6 The most conspicuous characteristic of 10 was the deshielded chemical shift of the NH group at δH 11.93 (δH 11.42 in harmine). This deshielded chemical shift suggested that the NH group was located at N-2, which was confirmed by the COSY correlation of NH (δH 11.93) with H-3 (δH 7.56, 1H, t, J = 2.4 Hz) and the NOESY correlations of NH with both H-3 and 1-CH3 (δH 2.77, 3H, s). Therefore, the structure of compound 10 was defined as shown.
The antiproliferative activities of the 12 new and 12 known alkaloids from P. harmala seeds were evaluated against HL-60, PC-3, and SGC-7901 cancer cell lines using the MTT and the trypan blue methods.5,22 Compounds 9, 11, 12, and 13 exhibited moderate cytotoxicity against HL-60 cancer cell lines with IC50 values of 4.36, 7.55, 9.05, and 9.25 μM, respectively. The other alkaloids showed weak or no activity (IC50 > 10 μM) against these three cell lines. These results indicated that the β-carboline skeleton is crucial for antitumor activity and a more in-depth biological evaluation of these alkaloids is ongoing.
EXPERIMENTAL SECTION
General Experimental Procedures
Optical rotations were recorded on an Anton Paar MCP 200 polarimeter. UV spectra were measured on a Shimadzu UV-2201 spectrometer. ECD spectra were obtained on a Bio-Logic MOS 450 spectrometer. IR spectra were measured on a Bruker IFS-55 spectrometer. 1D and 2D NMR spectra were acquired on Bruker AV-400 or AV-600 NMR spectrometers. Mass spectra were measured on Bruker micrOTOFQ-Q mass spectrometer. Single-crystal X-ray diffraction data was collected on a Rigaku Saturn 724 CCD diffractometer. Column chromatography (CC) were performed with D101 macroporous adsorption resin (D101 MAR), silica gel, ODS, and Sephadex LH-20. Semipreparative HPLC was performed with YMC ODS column, and the HPLC system was equipped with a Shimadzu SPD-20A UV–vis detector and LC-6AD pump.
Plant Material
The seeds were purchased from Anguo Medicine Co., Ltd. (Hebei, People’s Republic of China) in 2012, and were identified as P. harmala L. seeds by Dr. Jincai Lu. The voucher sample (PH-20120705) has been deposited in Shenyang Pharmaceutical University.
Extraction and Isolation
P. harmala L. seeds (15.4 kg) were extracted under reflux with 95% ethanol (2 × 2 h × 100 L) and 75% ethanol (1 × 2 h × 100 L), respectively. The combined EtOH extract was concentrated to afford a residue (1.9 kg). The residue was suspended in acidic solution (13 L, pH 3, using 5% HCl). The acidic mixture was partitioned with CH2Cl2 (6 × 13 L) to give a CH2Cl2-soluble fraction, and the aqueous layer was alkalinized to pH 10 with 3 N NaOH, followed by exhaustive extraction with CH2Cl2 (6 × 13 L) to obtain crude alkaloids (420.2 g). The crude alkaloids were subjected to silica gel CC, eluting with CH2Cl2/MeOH (1:0 → 0:1) to yield nine fractions (Fr. A-Fr. I). Harmine (11, 600 mg) and harmaline (14, 400 mg) were obtained from fraction C (100:2) and F (100:7) via recrystallization in MeOH, respectively. Fraction B, eluted with CH2Cl2/MeOH (100:1), was subjected to silica gel CC (CH2Cl2/acetone 1:0 → 0:1) and afforded six subfractions (Fr. B1–Fr. B6). Fr. B1, B2, B3, and B4 were separated by ODS CC, semipreparative HPLC to yield 13 (54.6 mg), 18 (10.4 mg), 16 (3.2 mg), 6 (5.8 mg), 10 (2.2 mg), 12 (6.5 mg), 22 (29.6 mg), 17 (2.7 mg), 21 (6.5 mg),15 (9.0 mg), 5 (5.0 mg), 3 (2.2 mg), and 4 (5.2 mg), respectively. Fraction C, eluted with CH2Cl2/MeOH (100:2), was chromatographed on silica gel CC (CH2Cl2/acetone 1:0 → 0:1) to afford six subfractions (Fr. C1–Fr. C7). Fr. C5 was separated by ODS CC, semipreparative HPLC to afford 19 (14.2 mg). Fraction D, eluted with CH2Cl2/MeOH (100:5–100:7), was chromatographed on D101 MAR CC (MeOH–H2O 30, 60, 90%) to afford three subfractions (Fr. D1-Fr. D3). Fr. D1 was purified by ODS CC and semipreparative HPLC to obtain 8 (20.2 mg) and 20 (6.4 mg). Fr. D2 was subjected to ODS CC and semipreparative HPLC to afford 9 (6.0 mg) and 7 (2.0 mg). Fr. D3 was separated by silica gel CC (EtOAc/MeOH 1:0 → 0:1) to afford six subfractions (Fr. D3–1–Fr. D3–6). Fr. D3–1 was purified by ODS CC and semipreparative HPLC to yield 1 (4.1 mg) and 2 (8.2 mg). Racemic modifications of 1 and 2 were subjected to chiral HPLC (Lux Amylose-2, 250 × 4.6 mm, 5 μm, Phenomenex, U.S.A.) to yield the pure enantiomers, respectively. The mobile phase, n-hexane/2-propanol (90:10 and 40:60, respectively), was used.
Peganine A (1)
Yellow, amorphous powder; [α]D20 + 2 (c 0.1, MeOH); UV (MeOH) λmax (log ε) 216 (4.12), 244 (1.06), 289 (0.76) nm; IR (KBr) νmax 3429, 2948, 2843, 1715, 1619, 1503, 1448, 1373, 1314, 1054, 1031, 1018, 764 cm−1; 1H and 13C NMR, see Tables 1 and 3; HRESIMS m/z 279.1325 [M + H]+ (calcd for C14H19N2O4, 279.1339).
(−)-Peganine A (1a)
[α]D20 − 65 (c 0.2, MeOH); ECD (MeOH) λmax (Δε) 212 (+5.5), 217 (−8.5), 243 (+19.7), 287 (−9.6) nm.
(+)-Peganine A (1b)
[α]D20 + 59 (c 0.2, MeOH); ECD (MeOH) λmax (Δε) 212 (−7.3), 217 (+6.2), 243 (−18.4), 287 (+5.3) nm.
Peganine B (2)
Yellow, amorphous powder; [α]D20 −3 (c 0.1, MeOH); UV (MeOH) λmax (log ε) 216 (4.11), 245 (1.04), 290 (0.73) nm; IR (KBr) νmax 3429, 3305, 2932, 2852, 1710, 1614, 1502, 1445, 1368, 1312, 1076, 1030, 763 cm−1; 1H and 13C NMR, see Tables 1 and 3; HRESIMS m/z 359.1219 [M + Na]+ (calcd for C16H20N2O6Na, 359.1214).
(+)-Peganine B (2a)
[α]D20 + 52 (c 0.2, MeOH); ECD (MeOH) λmax (Δε) 210 (+11.1), 242 (−4.4) nm.
(−)-Peganine B (2b)
[α]D20 − 60 (c 0.2, MeOH); ECD (MeOH) λmax (Δε) 210 (−12.3), 242 (+4.8) nm.
Peganumal A (3)
White, amorphous powder; UV (MeOH) λmax (log ε) 207 (3.84), 216 (4.14), 242 (2.01), 283 (0.82) nm; IR (KBr) νmax 3386, 2937, 2839, 1612, 1516, 1460, 1428, 1335, 1244, 1216, 1115, 1026, 970, 828 cm−1; 1H NMR (DMSO-d6, 600 MHz) δ: 3.71 (6H, s, 3,5-OCH3), 4.08 (2H, s, H2-7), 6.52 (2H, s, H-2,6), 7.70 (1H, d, 0.5 Hz, H-12), 8.22 (1H, br.s, 4-OH), 8.91 (1H, d, 0.5 Hz H-10); 13C NMR data, see Table 3; HRESIMS m/z 274.0518 [M + Na]+ (calcd for C12H13NNaO3S, 274.0508).
Peganumal B (4)
White, amorphous powder; UV (MeOH) λmax (log ε) 207 (3.81), 216 (4.06), 241 (1.93), 282 (0.74) nm; IR (KBr) νmax 3424, 2938, 2840, 1614, 1517, 1461, 1428, 1336, 1244, 1217, 1115, 1025, 971, 827 cm−1; 1H NMR (DMSO-d6, 400 MHz) δ: 2.55 (3H, s, 10-CH3), 3.71 (6H, s, 3,5-OCH3), 3.98 (2H, s, H2-7), 6.50 (2H, s, H-2,6), 7.38 (1H, s, H-12), 8.21 (1H, br.s, 4-OH); 13C NMR data, see Table 3; HRESIMS m/z 266.0855 [M + H]+ (calcd for C13H16NO3S, 266.0845).
Pegaharmine F (5)
Orange-red, block crystals; UV (MeOH) λmax (log ε) 209 (3.82), 374 (2.13) nm; IR (KBr) νmax 3425, 2928, 2854, 1626, 1456, 1382, 1208, 1159, 1026, 756 Cm−1; 1H and 13C NMR, see Tables 2 and 3; HRESIMS m/z 337.1174 [M + Na]+ (calcd for C17H18N2NaO4, 337.1159).
Pegaharmine G (6)
Yellow, amorphous powder; UV (MeOH) λmax (log ε) 222 (4.02), 341 (1.73), 312 (0.92) nm; IR (KBr) νmax 3427, 2930, 2853, 1650, 1569, 1456, 1383, 1270, 1202, 1143, 1029, 799 cm−1; 1H and 13C NMR, see Tables 2 and 3; HRESIMS m/z 328.1440 [M + H]+ (calcd for C21H18N3O, 328.1444).
Pegaharmine H (7)
Yellow, amorphous powder; UV (MeOH) λmax (log ε) 205 (4.12), 220 (3.83), 271 (1.42), 376 (2.43), 394 (2.02) nm; IR (KBr) νmax 3431, 2925, 2852, 1669, 1632, 1385, 1259, 1157, 1029, 818 cm−1; 1H and 13C NMR, see Tables 2 and 3; HRESIMS m/z 297.1236 [M + H]+ (calcd for C17H17N2O3, 297.1234).
Pegaharmine I (8)
Yellow, amorphous powder; UV (MeOH) λmax (log ε) 207 (3.82), 217 (3.79), 264 (1.26), 388 (3.72) nm; IR (KBr) νmax 3427, 2932, 2840,1630, 1588, 1508, 1445, 1384, 1262, 1203, 1150, 1076, 1026, 812, 511 cm−1; 1H and 13C NMR, see Tables 2 and 3; HRESIMS m/z 231.1133 [M + H]+ (calcd for C13H15N2O2, 231.1128).
Pegaharmine J (9)
Yellow, amorphous powder; UV (MeOH) λmax (log ε) 242 (4.02), 301 (1.23) nm; IR (KBr) νmax 3419, 2928, 1630, 1572, 1451, 1429, 1383, 1277, 1200, 1161, 1130, 1026, 802, 551 cm−1; 1H and 13C NMR, see Tables 2 and 3; HRESIMS m/z 229.0975 [M + H]+ (calcd for C13H13N2O2, 229.0972).
Pegaharmine K (10)
Yellow, amorphous powder; UV (MeOH) λmax (log ε) 234 (4.02), 320 (1.12), 363 (1.08) nm; 1H and 13C NMR, see Tables 2 and 3; HRESIMS m/z 213.1018 [M + H]+ (calcd for C13H13N2O, 213.1022).
X-ray Crystallographic Analysis of Pegaharmine F (5)
Orange-red block crystals of 5 were obtained from a MeOH solution subjected to slow evaporation in a refrigerator for ca. 3 weeks. Single-crystal X-ray diffraction data were collected by a Rigaku Saturn 724 CCD diffractometer equipped with a multilayer-monochromator and a Mo Kα radiation (λ = 0.71073 Å) (Rigaku Co. Ltd., Japan). The structure was processed by direct methods, followed by Fourier techniques, and refined by SHELXL-97.23 The block crystals of 5 are monoclinic, space group p2(1)/c with cell dimensions a = 7.6992(15) Å, b = 7.9904(16) Å, c = 24.276(5) Å, V = 1489.3(5) Å3, Z = 4, F (000) = 664, and goodness of fit on F2 = 1.051. The R1 and wR2 values were 0.0644 [I > 2σ(I)] and 0.1361 (all data), respectively. Crystallographic data for compound 5 has been deposited with the Cambridge Crystallographic Data Centre as supplementary publication no. CCDC 1497011. Copies of the data can be obtained, free of charge, on application to the CCDC, 12 Union Road, Cambridge CB2 1EZ, U.K. (fax, + 44 (0)-1223-336033; e-mail, deposit@ccdc.cam.ac.uk).
Computational Methods
Conformational searches using the MMFF94S force field were performed for 1 and 2 by CONFLEX software.24 Subsequently, the selected stable conformers were subjected to geometry optimization by DFT theory at the B3LYP/6-31G* level. TDDFT ECD calculations for these optimized conformers were carried out at the B3LYP/6-31+G** level with a CPCM model in MeOH solvent. Finally, the overall ECD spectra were obtained by Boltzman weighting using SpecDis 1.5.25 The optimized stable conformations of 2 were further used for 13C NMR chemical shift calculations.26 For the structures of 3a and 3b, four stable conformations (Figures S2 and S3, Supporting Information) were obtained after geometry optimizations and were used for 13C NMR computations at the B3LYP/6-311++G** level, respectively. The chemical shifts were converted from magnetic shielding values with corrections.27
Cytotoxic Assays
Cytotoxicity of these isolates were evaluated by the MTT assay against the PC-3 (human prostate cancer) and the SGC-7901 (human gastric cancer) cell lines, and by the trypan blue method against the HL-60 (human leukemia) cell lines as described previously.5,22
Supplementary Material
Acknowledgments
The work was financially supported by the National Natural Science Foundation of China (Grant No. 81172958), the Basic Research Subject of Key Laboratory Supported by Educational Commission of Liaoning Province of China (No. LZ2014044), and the China Scholarships Council.
Footnotes
Notes
The authors declare no competing financial interest.
The Supporting Information is available free of charge on the ACS Publications website at DOI: 10.1021/acs.jnat-prod.6b01146.
Experimental detail and characterization data (PDF)
X-ray data of compound 5 (CIF)
References
- 1.Huang P, Wang D, Su Y, Huang W, Zhou Y, Cui D, Zhu X, Yan D. J Am Chem Soc. 2014;136:11748–11756. doi: 10.1021/ja505212y. [DOI] [PubMed] [Google Scholar]
- 2.(a) Butler MS, Robertson AA, Cooper MA. Nat Prod Rep. 2014;31:1612–1661. doi: 10.1039/c4np00064a. [DOI] [PubMed] [Google Scholar]; (b) Camp D, Garavelas A, Campitelli M. J Nat Prod. 2015;78:1370–1382. doi: 10.1021/acs.jnatprod.5b00255. [DOI] [PubMed] [Google Scholar]; (c) Cragg GM, Grothaus PG, Newman DJ. Chem Rev. 2009;109:3012–3043. doi: 10.1021/cr900019j. [DOI] [PubMed] [Google Scholar]; (d) Luo Y, Cobb RE, Zhao H. Curr Opin Biotechnol. 2014;30:230–237. doi: 10.1016/j.copbio.2014.09.002. [DOI] [PMC free article] [PubMed] [Google Scholar]; (e) Molinski TF. Org Lett. 2014;16:3849–3855. doi: 10.1021/ol501917g. [DOI] [PubMed] [Google Scholar]; (f) Newman DJ, Cragg GM. J Nat Prod. 2016;79:629–661. doi: 10.1021/acs.jnatprod.5b01055. [DOI] [PubMed] [Google Scholar]
- 3.(a) Ashok P, Ganguly S, Murugesan S. Drug Discovery Today. 2014;19:1781–1791. doi: 10.1016/j.drudis.2014.06.010. [DOI] [PubMed] [Google Scholar]; (b) Chen Q, Ji C, Song Y, Huang H, Ma J, Tian X, Ju J. Angew Chem, Int Ed. 2013;52:9980–9984. doi: 10.1002/anie.201303449. [DOI] [PubMed] [Google Scholar]; (c) Dighe SU, Mahar R, Shukla SK, Kant R, Srivastava K, Batra S. J Org Chem. 2016;81:4751–4761. doi: 10.1021/acs.joc.6b00613. [DOI] [PubMed] [Google Scholar]; (d) Domonkos C, Zsila F, Fitos I, Visy J, Kassai R, Bálint B, Kotschy A. RSC Adv. 2015;5:53809–53818. [Google Scholar]; (e) Naveen B, Mudiraj A, Khamushavalli G, Babu PP, Nagarajan R. Eur J Med Chem. 2016;113:167–178. doi: 10.1016/j.ejmech.2016.02.033. [DOI] [PubMed] [Google Scholar]; (f) Khan FA, Maalik A, Iqbal Z, Malik I. Eur J Pharmacol. 2013;721:391–394. doi: 10.1016/j.ejphar.2013.05.003. [DOI] [PubMed] [Google Scholar]
- 4.Cao R, Peng W, Wang Z, Xu A. Curr Med Chem. 2007;14:479–500. doi: 10.2174/092986707779940998. [DOI] [PubMed] [Google Scholar]
- 5.(a) Wang KB, Li DH, Hu P, Wang WJ, Lin C, Wang J, Lin B, Bai J, Pei YH, Jing YK, Li ZL, Yang D, Hua HM. Org Lett. 2016;18:3398–3401. doi: 10.1021/acs.orglett.6b01560. [DOI] [PMC free article] [PubMed] [Google Scholar]; (b) Wang KB, Di YT, Bao Y, Yuan CM, Chen G, Li DH, Bai J, He HP, Hao XJ, Pei YH, Jing YK, Li ZL, Hua HM. Org Lett. 2014;16:4028–4031. doi: 10.1021/ol501856v. [DOI] [PubMed] [Google Scholar]; (c) Wang KB, Yuan CM, Xue CM, Li DH, Jing YK, He HP, Hao XJ, Di YT, Li ZL, Hua HM. RSC Adv. 2014;4:53725–53729. [Google Scholar]
- 6.Berrougui H, Martin-Cordero C, Khalil A, Hmamouchi M, Ettaib A, Marhuenda E, Herrera MD. Pharmacol Res. 2006;54:150–157. doi: 10.1016/j.phrs.2006.04.001. [DOI] [PubMed] [Google Scholar]
- 7.Eagon S, Anderson MO. Eur J Org Chem. 2014;8:1653–1665. [Google Scholar]
- 8.Siddiqui S, Khan OY, Faizi S, Siddiqui BS. Heterocycles. 1988;27:1401–1410. [Google Scholar]
- 9.Wang X, Geng Y, Wang D, Shi X, Liu J. J Sep Sci. 2008;31:3543–3547. doi: 10.1002/jssc.200800322. [DOI] [PubMed] [Google Scholar]
- 10.Wu F, Koike K, Nikaido T, Sakamoto Y, Ohmoto T, Ikeda K. Chem Pharm Bull. 1989;37:1808–1809. [Google Scholar]
- 11.Hashimoto Y, Kawanishi K. Phytochemistry. 1975;14:1633–1635. [Google Scholar]
- 12.Hashimoto Y, Kawanishi K. Phytochemistry. 1976;15:1559–1560. [Google Scholar]
- 13.Seki H, Hashimoto A, Hino T. Chem Pharm Bull. 1993;41:1169–1172. [Google Scholar]
- 14.Narayanan K, Schindler L, Cook JM. J Org Chem. 1991;56:359–365. [Google Scholar]
- 15.Yang LM, Chen CF, Lee KH. Bioorg Med Chem Lett. 1995;5:465–468. [Google Scholar]
- 16.Ma ZZ, Hano Y, Nomura T, Chen YJ. Phytochemistry. 2000;53:1075–1078. doi: 10.1016/s0031-9422(99)00440-9. [DOI] [PubMed] [Google Scholar]
- 17.Nge CE, Gan CY, Low YY, Thomas NF, Kam TS. Org Lett. 2013;15:4774–4777. doi: 10.1021/ol4021404. [DOI] [PubMed] [Google Scholar]
- 18.Frisch MJ, Trucks GW, Schlegel HB, Scuseria GE, Robb MA, Cheeseman JR, Scalmani G, Barone V, Mennucci B, Petersson GA, Nakatsuji H, Caricato M, Li X, Hratchian HP, Izmaylov AF, Bloino J, Zheng G, Sonnenberg JL, Hada M, Ehara M, Toyota K, Fukuda R, Hasegawa J, Ishida M, Nakajima T, Honda Y, Kitao O, Nakai H, Vreven T, Montgomery JA, Peralta JE, Jr, Ogliaro F, Bearpark M, Heyd JJ, Brothers E, Kudin KN, Staroverov VN, Keith T, Kobayashi R, Normand J, Raghavachari K, Rendell A, Burant JC, Iyengar SS, Tomasi J, Cossi M, Rega N, Millam JM, Klene M, Knox JE, Cross JB, Bakken V, Adamo C, Jaramillo J, Gomperts R, Stratmann RE, Yazyev O, Austin AJ, Cammi R, Pomelli C, Ochterski JW, Martin RL, Morokuma K, Zakrzewski VG, Voth GA, Salvador P, Dannenberg JJ, Dapprich S, Daniels AD, Farkas O, Foresman JB, Ortiz JV, Cioslowski J, Fox DJ. Gaussian 09, Revision D.01. Gaussian, Inc; Wallingford CT: 2013. [Google Scholar]
- 19.(a) Zhu HJ. Organic Stereochemsitry–Experimental and Computational Methods. Wiley-VCH, Verlag GmbH & Co. KGaA; Weinheim: 2015. [Google Scholar]; (b) Zhu HJ. Current Organic Stereochemistry. Science China Press; Beijing: 2009. [Google Scholar]; (c) Cao F, Yang Q, Shao CL, Kong CJ, Zheng JJ, Liu YF, Wang CY. Mar Drugs. 2015;13:4171–4178. doi: 10.3390/md13074171. [DOI] [PMC free article] [PubMed] [Google Scholar]
- 20.Jiao RH, Xu S, Liu JY, Ge HM, Ding H, Xu C, Zhu HL, Tan RX. Org Lett. 2006;8:5709–5712. doi: 10.1021/ol062257t. [DOI] [PubMed] [Google Scholar]
- 21.Hu XJ, Di YT, Wang YH, Kong LY, Gao S, Li CS, Liu HY, He HP, Ding J, Xie H, Hao XJ. Planta Med. 2009;75:1157–1161. doi: 10.1055/s-0029-1185505. [DOI] [PubMed] [Google Scholar]
- 22.(a) Sai CM, Li DH, Xue CM, Wang KB, Hu P, Pei YH, Bai J, Jing YK, Li ZL, Hua HM. Org Lett. 2015;17:4102–4105. doi: 10.1021/acs.orglett.5b02044. [DOI] [PubMed] [Google Scholar]; (b) Sai CM, Li DH, Li SG, Han T, Guo YZ, Pei YH, Bai J, Jing YK, Li ZL, Hua HM. RSC Adv. 2016;6:41173–41180. [Google Scholar]
- 23.Sheldrick GM. Acta Crystallogr, Sect A: Found Crystallogr. 2008;64:112–122. doi: 10.1107/S0108767307043930. [DOI] [PubMed] [Google Scholar]
- 24.(a) Goto H, Osawa E. J Am Chem Soc. 1989;111:8950–8951. [Google Scholar]; (b) Goto H, Osawa E. J Chem Soc, Perkin Trans 2. 1993;187–198 [Google Scholar]
- 25.Bruhn T, Schaumlöffel A, Hemberger Y, Bringmann G. Chirality. 2013;25:243–249. doi: 10.1002/chir.22138. [DOI] [PubMed] [Google Scholar]
- 26.Wolinski K, Hinton JF, Pulay P. J Am Chem Soc. 1990;112:8251–8260. [Google Scholar]
- 27.Liu DZ, Wang F, Liao TG, Tang JG, Steglich W, Zhu HJ, Liu JK. Org Lett. 2006;8:5749–5752. doi: 10.1021/ol062307u. [DOI] [PubMed] [Google Scholar]
Associated Data
This section collects any data citations, data availability statements, or supplementary materials included in this article.


