

Abstract
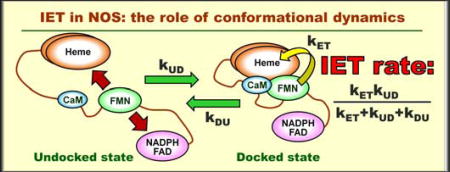
The production of nitric oxide by the nitric oxide synthase (NOS) enzyme depends on the interdomain electron transfer (IET) between the flavin mononucleotide (FMN) and heme domains. Although the rate of this IET has been measured by laser flash photolysis (LFP) for various NOS proteins, no rigorous analysis of the relevant kinetic equations was performed so far. In this work, we provide an analytical solution of the kinetic equations underlying the LFP approach. The derived expressions reveal that the bulk IET rate is significantly affected by the conformational dynamics that determines the formation and dissociation rates of the docking complex between the FMN and heme domains. We show that in order to informatively study the electron transfer across the NOS enzyme, LFP should be used in combination with other spectroscopic methods that could directly probe the conformational rate constants. The implications of the obtained analytical expressions for the interpretation of the LFP results from various native and modified NOS proteins are discussed. The mathematical formulae derived in this work should also be applicable for interpreting the IET kinetics in other modular redox enzymes.
Introduction
Mammalian nitric oxide synthase (NOS) enzyme catalyzes the 5-electron oxidation of l-arginine (l-Arg) to NO and citrulline, utilizing NADPH and O2 as co-substrates.1–2 Structurally, NOS is a homodimeric protein, each monomer of which consists of a C-terminal electron-supplying reductase domain and an N-terminal catalytic heme-containing oxygenase domain (the terms ‘oxygenase domain’ and ‘heme domain’ are interchangeable). The reductase domain consists of a ferredoxin-NADP reductase (FNR) (sub)domain, which contains binding sites for NADPH (the electron source) and flavin adenine dinucleotide (FAD), and a flavin mononucleotide (FMN) (sub)domain. The FMN domain is connected to the FNR and heme domains by flexible linkers, which allow it to shuttle between these terminal domains to deliver the NADPH-derived electrons to the heme active site3 where the NO production takes place.4
The interdomain electron transfer (IET) processes represent key steps in NOS catalysis.1, 5–6 They are regulated by calmodulin (CaM), which binds to the CaM-binding region of the linker joining the FMN and heme domains. Although the CaM binding to NOS has little to no effect on the thermodynamics of redox processes,7–9 it facilitates the IET from the FAD hydroquinone to FMN semiquinone (FMNH•) within the reductase domain10 and enables the IET from the FMN hydroquinone (FMNhq) to the catalytic heme iron in the heme domain.3 This indicates that the NOS regulation by CaM is accomplished dynamically through controlling conformational changes required for effective IET.11–13
As a direct way to measure the bulk FMN–heme IET rate in NOS, a laser flash photolysis (LFP) approach was applied to wild type (wt) and mutant NOS enzymes of different isoforms and domain composition (constructs).14–22 So far, rigorous analysis of the LFP data using the relevant kinetic equations has not been carried out. In particular, it was not mathematically clear, how the contributions of the intrinsic IET rate constants and those describing the conformational dynamics determine the observed (bulk) IET rate. In this work, we put the analysis of LFP experimental results on a solid mathematical ground by providing an analytical solution of the kinetic equations in terms of the IET rate constants and presenting approximate practical expressions that reveal the important relationship between the bulk IET rate and the conformational dynamics in NOS. In comparison with an earlier broadly related work on the IET in tethered proteins by Kawatsu and Beratan,23 our treatment is focused on the NOS system and the LFP approach and includes the reversible IET and the gradual return of the system to the pre-IET state. The use of the obtained expressions for the interpretation of the LFP results is discussed.
Results and discussion
1. Structural interconversions in NOS
The IET process in the CaM-bound full-length NOS is a composite result of the enzyme cycling through several conformational states (see Figure 1):6, 24
The input state, where the FMN domain is docked to the FNR domain containing the binding sites for FAD and NADPH. In this state, the NADPH-derived electron is transferred into FMN through FAD.
The intermediate (free) state, where the FMN domain is undocked from both the FNR and heme domains. This is the state of a large-scale motion between the two docking positions and is characterized by a broad dynamic conformational distribution.
The output state, where the FMN domain is docked to the heme domain. This is the state where the FMN – heme IET takes place and the electron is transferred out of the FMN domain.
Figure 1.

Conformational states of CaM-bound NOS. In the input state, the FMN domain is docked to the FAD- and NADPH-binding FNR domain, where it receives an electron to be transported to the heme domain. In the intermediate state, the FMN domain is not docked to other domains and is either transporting an electron toward the heme domain or returns to the FNR domain for a new electron. In the output state, the FMN domain is docked to the heme domain. In this state, the FMN-heme IET event takes place. In this work, the input and intermediate states are combined into the undocked (with respect to the FMN-heme docking) state, U, while the output state is referred to as the docked state, D.
Since the FMN–heme IET event takes place in the FMN – heme docked state (the output state in Figure 1), for the purposes of this work, we can single this state out and refer to it simply as the docked state (denoted by D, see Figure 1). The input and intermediate states will be combined into a single undocked (with respect to the FMN-heme domain docking) state and denoted by U.
2. IET kinetics in a laser flash photolysis experiment
We will specifically formulate the FMN–heme IET kinetics problem in the context of the LFP experiment. In this experiment, NOS is initially in the IET-inactive [Fe(III)][FMN] state (I in Figure 2). The IET-ready state, R, is prepared by an appropriate period (seconds) of illumination of the sample with white light. At the R state, the heme center is ferrous, with the CO ligand bound to the Fe(II) ion, while the FMN center is partially reduced to FMN semiquinone, FMNH•. The IET is not possible, however, because of the presence of CO ligand at the heme center. The IET-active state, A, is achieved by a short (2–3 ns) laser pulse at 446 nm, which releases the CO ligand from the heme center. The laser-induced CO dissociation results in a drop of the midpoint potential of the heme and converts a good electron acceptor (the Fe(II)–CO complex) into an electron donor (the CO-free Fe(II) species) favoring the electron transfer (ET) from Fe(II) to FMNH•. As a result of the heme-FMN IET, the active state is converted to the final [Fe(III)][FMNhq] state, F. A competing process of CO rebinding also converts the active state back to the ready state. Thus, the I, R, A, and F states differ mainly in the redox states of the heme iron and FMN centers, although the difference between A and R is in the CO-binding state of the ferrous heme center.
Figure 2.

NOS redox states and relevant IET and conformational change kinetics in the context of the LFP experiment.
In Figure 2, U and D represent the FMN-heme undocked and docked states, respectively; kDU and kUD are, respectively, the D → U and U → D conformational interconversion constants; kETf and kETb are, respectively, the forward and backward intrinsic ET rates. In addition, the sum of kETf and kETb will be denoted as kET. The A → R conversion caused by the CO rebinding to the heme is shown by a dashed arrow. The corresponding rate constant is denoted by kAR. In addition to the formal kinetic description, the following important physical details about the conformational and intrinsic ET rate constants and the docked state should be noted:
kUD represents the diffusion-controlled frequency of productive collisions between the FMN and heme domains, where “productive” means the collisions that lead to the formation of the docked state. As such, it depends on viscosity, the presence or absence of the FNR domain in the studied NOS protein (full-length enzyme vs. bi-domain oxygenase-FMN construct, i.e., the oxyFMN construct), CaM-dependent conformational flexibility limitations, as well as other factors, including the ionic interactions between the charged surface residues of the FMN and heme domains.
kDU represents the inverse lifetime of the docking complex. This lifetime is mostly determined by the FMN-heme domain specific interactions, but it can also be affected by the presence or absence of the FNR domain in the studied NOS enzyme. In addition, the docking interaction between CaM and the heme domain facilitates the formation of the FMN - heme domain docking complex25 and is expected to decrease kDU.
Most likely, the docking conformation itself exhibits a certain structural disorder (extremely minor compared to the broad structural distribution of the undocked state), with constant interconversions between the docked sub-states23. The position changes in this process of “conformational sampling” are relatively small and may not be clearly distinguishable in an experiment (i.e., the experiment will only detect that the domains are in close contact, with the interdomain distance and relative orientation being distributed in narrow limits of just a few Å and degrees). The efficient interdomain electron tunneling only happens within a narrow range of possible docking conformations, and thus the time spent on conformational sampling contributes to the intrinsic IET rate constants, kETf and kETb, and can make them orders of magnitude smaller than the ideal IET rate constants estimated using the protein ET theory (see, e.g., ref.26–27).
Like any diffusion process, the conformational sampling in the docked state is mass-dependent. The FNR domain represents an additional mass connected to the FMN domain by a linker, and therefore, it may hinder the conformational sampling and result in slower intrinsic IET rates in a full-length NOS as compared with the bi-domain oxyFMN construct. Because of the linker, the effect should be smaller than for a rigid connection, but it cannot be excluded entirely.
The IET in the LFP experiment is monitored by following the change in the optical absorption at specific wavelengths where Fe(II) or FMNH• dominates the spectrum.6 In nNOS and iNOS, the Fe(II) oxidation was observed at 460 and 465 nm, respectively.19–20 The consumption of FMNH• was monitored at 580 – 600 nm.21, 28 As both the ready and active states contain the FMN and heme species, the total absorbance at the selected wavelength λ, Aλ, can in general be expressed as:
| (1) |
where εA and εR are the molar extinction coefficients in the active and ready states, respectively.
A typical Aλ(t) trace detected in an LFP experiment is shown in Figure 3. During the initial stage (the IET phase) of the processes, [R] is close to zero and practically does not change, and the observed absorbance decrease is solely due to the depopulation of the active state caused by the A → F forward ET. As [A] decreases and [F] increases, the F → A backward ET starts competing with the forward ET, which eventually leads to an equilibration of the active and final state populations. The observed absorbance change in the IET phase is usually monoexponential, and the bulk IET rate constant is denoted kIET. The total absorbance change in this process is referred to as the IET amplitude.
Figure 3.

The LFP trace obtained for the S562 mutant of human iNOS oxyFMN. This trace is shown as an example to explain the typical features of the kinetic data obtained in an LFP experiment. The experimental details are described in the original work.15
At a longer time scale, the slow CO rebinding process starts gradually converting the A state back to the R state. The decreasing A state population is replenished from the F state “while supplies last”. At the end, the system completely converts back to the ready state. This increase of [R] is evidenced by the increase of Aλ to the pre-IET state (see Figure 3). The rate constant describing the CO rebinding process determined from this part of the kinetics is denoted kCO. The main goal of this work is to establish the relationship between the observed rate constants (kIET and kCO) and the intrinsic rate constants indicated in Figure 2.
When the IET is initiated by a laser pulse, the system is in a conformational equilibrium, with populations of the docked and undocked states being:
| (2) |
where [NOS] is the total NOS concentration. The initial populations of the ready and final states are [R]o = 0 (the system in the laser excited region is fully converted to the active state by the laser pulse) and [F]o = 0. These initial populations, along with all necessary starting time derivatives that are readily calculated from the kinetic equations (see below), are used to calculate the pre-exponential factors in the solutions of the kinetic equations.
The kinetic equations describing the processes indicated by arrows in Figure 2 are:
| (3) |
In these equations, the docked and undocked conformations in the final state are denoted by DF and UF, respectively, to distinguish them from the corresponding conformations in the active state (see Figure 2). Note that the CO rebinding is described as pseudo-first-order, although actually it is a bimolecular process with the rate determined by kbm[NOS][CO], where kbm is a bimolecular rate constant. This simplification is valid because the CO concentration (mM level) is much larger than that of NOS (10–20 µM), and thus kAR in Eqs. 3 represents the product: kAR = kbm[CO].
Given the large number of kinetic equations, the simplicity of the experimental LFP trace (Figure 3) appears striking. For example, the IET phase of the kinetics is expected to be described by up to four exponential functions, but only one is generally observed. As shown below, the reason for this simplicity is the fact that only one exponential function is slow enough to be resolved and/or has large enough amplitude to be reliably detected against the noise level. In this situation, the LFP experiment can only yield a certain combination of the intrinsic rate constants, which corresponds to the observed bulk IET rate. As a result, although the experimental LFP traces can be simulated by solving Eqs. 3 numerically, the kinetic parameters obtained will not be unique. The analytical solution of Eqs. 3 will provide a practical expression that can be used for good initial estimates of the intrinsic rate constants, including the range of their variation, which would potentially fit the experimental LFP kinetics. It will also help better understand the kinetic information obtainable in a typical LFP experiment.
The analytical solution of the full set of the equations involves finding roots of the fourth order polynomial (actually a fifth order polynomial, one of the roots of which is zero). While this is possible (e.g., through a combination of resolvent cubic and Cardano methods), such a solution will not be useful for simple practical estimates because of its bulkiness and either the use of trigonometric functions or multiple cubic and square roots. We will therefore provide an approximate solution employing the fact that in practice the CO rebinding rate is usually much slower than the IET rate (see, e.g., Figure 3). We will approach the problem in two stages, first considering the interconversion between the A and F states without the CO rebinding (kAR = 0), and then accounting for the slow CO rebinding, while maintaining an approximate equilibrium between the U and D conformations within the active and final states.
3. IET without CO rebinding: kAR = 0
We will first consider the kinetics without the CO rebinding. Solving Eqs. 3 with kAR = 0 gives three non-zero rate constants:
| (4) |
where ks = kUD + kDU + kET, kp = kETkUD, and kET = kETf + kETb. The subscripts “s” and “p” in ks and kp stand for “sum” and “product”, respectively. The subscript “c” in kc stands for “conformational” and refers to the fact that kc is the rate constant responsible for establishing the U ↔ D conformational equilibrium.
The active and final state populations are:
| (5) |
where:
| (6) |
There is no exponent with kc in Eq. 5 (i.e., its amplitude equals zero) because this rate constant is responsible for maintaining the U ↔ D conformational equilibrium, which exists at the start and is conserved in the IET reactions: [U] + [UF] and [D] + [DF] are expressed only through each other using the kUD and kDU conformational rate constants.
Let us consider the rates and amplitudes of the contributing exponential functions in more detail. One can readily estimate:
| (7) |
where rUD = [U]o/[D]o = kDU/kUD. The final inequality in Eq. 7 is obtained by considering the sum in parentheses, which attains its minimum at kET/kUD = 1+rUD. The pulsed EPR29 and fluorescence lifetime30–33 measurements show that in the CaM-bound NOS, rUD ≥ 2 (i.e., [D]o ~ 35% or less, depending on the NOS isoform, mutation, and presence or absence of the FNR domain; see Table 1), which immediately results in . The square root in Eq. 4 can therefore be expanded with the accuracy to the terms linear in to give:
| (8) |
which shows that .
Table 1.
The bulk IET rate constants and the ratios of undocked/docked state populations (rUD) in NOS proteins. The IET rate constants shown are the averages over the ranges given in the references.
| NOS protein | kIET (s−1) | Ref. | rUD | Ref. |
|---|---|---|---|---|
| wt murine iNOS oxyFMN | 850 | 22 | 2.6 | 32 |
| wt full-length murine iNOS | 35 | 19 | ≫ 1a | 32 |
| wt human iNOS oxyFMN | 343 | 16, 19 | -b | |
| wt full-length human iNOS | 35 | 19 | - | |
| E546N human iNOS oxyFMN | 139 | 14 | - | |
| S562K human iNOS oxyFMN | 192 | 15 | - | |
| C563R human iNOS oxyFMN | 340 | 15 | - | |
| R536E human iNOS oxyFMN | 13.6 | 15 | - | |
| Human iNOS oxyFMN + NCaM | 93 | 18 | - | |
| wt rat nNOS oxyFMN; no CaM | 22 | 21 | ≫ 1a | 29 |
| wt rat nNOS oxyFMN with bound CaM | 262 | 21 | 5.5 | 29 |
| wt full-length rat nNOS | 43 | 20, 28 | 2.9 | 31 |
| AR-deletion mutant of full-length rat nNOS | 44 | 20 | 4.7 | 33 |
| wt full-length bovine eNOS | 4.3 | 17 | - |
“≫ 1” indicates that no equilibrium docked state population was reliably detected ([D]o ~ 0).
“-” indicates that the value is not determined/reported.
The exponential term corresponding to k+ describes the fast IET from (mostly) the docked state existing at the time of the laser pulse. This term has a small amplitude: since k+ ≫ k− and kUD < (≪) kDU, it follows that for the general case, kETf/(k+ − k−) ≤ 1, and kUD/kc ≈ kUD/kDU > k−/kET ~ kUD/(kc+kET), which results in A+ ~ (kUD/kDU)·[NOS] < (≪) A−. The k+ term may also be exceedingly fast to be detectable in a routine LFP experiment.
The largest pre-exponent corresponds to the k− term, which describes the IET from (mostly) the state A population that is in the undocked conformation at the time of the laser pulse. Obviously, to engage in the ET process, these molecules should first achieve the docked conformation. The active state population kinetics is thus approximately monoexponential, and k− corresponds to the effective IET rate constant, kIET, obtained in LFP measurements (see Figure 3). Equating kIET with k− one can write:
| (9) |
where kIET = k−:
| (10) |
Equation 10 represents a compilation of the expressions for k− in Eqs. 4 and 8 and is given for convenience of future reference.
As an example, Figure 4 shows the calculated active state population for kDU = 10 ms−1, kUD = 3.33 ms−1 (rUD = 3), and three different intrinsic IET rates corresponding to kET ≫ kDU, kET = kDU, and kET ≪ kDU (panels a, b, and c, respectively). To maximize the change in [A], the calculations were performed for kETb = 0. Assuming kETb > 0 while keeping kET the same would only result in a decreased amplitude of the overall time-dependent part of [A](t) because k+, k−, and A+/A− only depend on kET (see Eqs. 4 and 5).
Figure 4.

Calculated kinetics of the active state population in an LFP experiment for kAR = 0 (no CO rebinding). Calculation parameters: kDU = 10 ms−1; kUD = 3.33 ms−1; kETf = 100, 10, and 1 ms−1 in panels a, b, and c, respectively; kETb = 0. Black trace in each panel is calculated using the exact expressions given by Eqs. 5 and 6. Green trace is a monoexponential kinetic given by Eq. 9, calculated using the exact expression for kIET in Eq. 10. Red trace is a monoexponential kinetic given by Eq. 9, calculated using the approximate expression for kIET in Eq. 10.
The black trace in each panel of Figure 4 represents an exact solution of Eqs. 3 calculated using Eqs. 5 and 6. The green trace represents a monoexponential approximation given by Eq. 9, with kIET calculated using the exact expression in Eq. 10. The red trace again represents a monoexponential approximation given by Eq. 9, but with kIET calculated using the approximate expression in Eq. 10. Thus, the comparison between the black and green traces shows the accuracy of a monoexponential approximation. The comparison between the green and red traces tests the accuracy of the approximate formula for kIET in Eq. 10.
One can see that after the initial fast decay (with the relative amplitude of ~ kUD/kDU in panel a and progressively smaller in panels b and c), the monoexponential model provides a good description of the IET kinetic. The exact and approximate kIET values obtained from Eq. 10 are very close to each other. The largest difference between them is observed for Figure 4b, and it only amounts to about 7%.
The calculations shown in Figure 4 were performed for rUD = 3. The increase in rUD improves both the monoexponential character of the overall kinetics and the agreement between the exact and approximate estimates of kIET. The decrease in rUD obviously has the opposite effect, but even for rUD = 1 the largest difference between the exact and approximate kIET estimates is only 15%, and although the contribution of the fast exponent to the exact kinetics calculated using Eq. 5 increases (~40% for kET ≫ kUD), the trace is still monoexponential for over 90% of the observable timebase. The examples of the calculations for rUD = 10 and rUD = 1 are given in Supporting Information.
4. Accounting for the CO rebinding: kAR ≠ 0
In the presence of CO rebinding, the analytical solution of the full kinetic problem becomes problematic even in terms of obtaining the approximate expressions. The situation is dramatically simplified, however, by the fact that the rate of CO rebinding process is usually much slower than the observed IET rate (see, e.g., Figure 3).14–22 Since kIET ≤ kUD < (≪) kUD+kDU (see Eq. 10), the A and F states during the CO rebinding process approximately maintain their U ↔ D conformational equilibria. One can thus formulate the problem in terms of the interconversions between the active, ready, and final states, without breaking them down into the docked and undocked conformations:
| (11) |
where kAF and kFA are the rate constants for the A → F and F → A transitions (accomplished by IET), respectively. Since the A and F states are close to their internal conformational equilibria, these rate constants are obviously equal to:
| (12) |
(as obtained from, e.g., kAF[A] = kETf[D]). The solution of Eqs. 11 gives two non-zero rate constants:
| (13) |
where kCOs = kAF + kFA + kAR and kCOp = kARkFA (“s” and “p” in the subscripts stand for “sum” and “product”). Since kAR ≪ (kAF, kFA), and thus (kCOs)2 ≫ kCop, one obtains:
| (14) |
The larger rate constant, kCO+, is responsible for maintaining the equilibrium between the A and F states, which the slow A → R process described by kCO− tries to disbalance. The amplitude of the exponent corresponding to kCO+ in the solutions for [A], [R], and [F] is proportional to kAR/kET (≪ 1).
The larger pre-exponent corresponds to the kCO− term, which describes the slow repopulation of the R state and the corresponding depopulation of the A and F states due to the CO rebinding process. The CO rebinding kinetics is thus approximately monoexponential, and kCO− corresponds to the apparent CO rebinding rate constant, kCO, obtained in the LFP measurements (see Figure 3). Equating kCO with kCO−, one can write:
| (15) |
and [F] = [NOS] − [A] − [R]. In these expressions, kCO = kCO−:
| (16) |
Equation 16 represents a compilation of the expressions for kCO− in Eqs. 13 and 14 and is given for convenience of future reference.
It follows from Eqs. 15 and 16 that the slow conversion of the NOS population to the ready state is only possible with kETb > 0. If kETb = 0, then also kCO = 0, and [R] ≈ 0, as obtained from Eq. 15. In this case, however, Eq. 15 becomes insufficient, and one has to explicitly consider the rapid term described by kCO+. Since for the rapid term the internal conformational equilibrium condition becomes invalid (because then kCO+ = kCOs > kUD + kDU), the problem has to be solved with the explicit account of the conformational interconversions in the active state (for kETb = 0, the internal conformational dynamics of the final state is not important). The rigorous analysis of the situation with kETb = 0 (see Supporting Information) shows that in this case the population transferred to the ready state is very small (~ kAR/kIET) because the slow CO rebinding competes with a much faster IET process. This small population transfer from the active to the ready state occurs with the characteristic rate constant kAR + kIET ≈ kIET (where kIET is given by Eq. 10), i.e., with the same rate as the observed IET process. The slow component, kCO, is obviously not observed in this case.
As an example, Figure 5 shows a comparison between the total population of A and R states obtained by a numerical solution of Eqs. 3 with the approximate [A]+[R] values estimated using Eqs. 15 (see Supporting Information for the numerical solution details). The calculations correspond to kDU = 10 ms−1; kUD = 3 ms−1; kETf = kETb = 5 ms−1; kAR = 0.03, 0.3, and 1 ms−1 in panels a, b, and c, respectively. The black trace in each panel represents a numerical solution of Eqs. 3. The green trace represents a monoexponential approximation given by Eqs. 15, with kCO calculated using the exact (for the internal equilibrium model) expression in Eq. 16. The red trace again represents a monoexponential approximation given by Eqs. 15, but with kCO calculated using the approximate expression in Eq. 16. Thus, the comparison between the black and green traces shows the accuracy of the internal equilibrium model described by Eqs. 11. The comparison with the red trace tests the accuracy of the approximate formula for kCO given by the second part of Eq. 16.
Figure 5.

Calculated kinetics of the total population of the active and ready states in an LFP experiment for kAR > 0 (with CO rebinding). Calculation parameters: kDU = 10 ms−1; kUD = 3 ms−1; kETf = kETb = 5 ms−1; kAR = 0.03, 0.3, and 1 ms−1 in panels a, b, and c, respectively. Black trace in each panel represents a numerical solution of Eqs. 3 for [A] + [R]. Green trace is a monoexponential kinetics for [A] + [R] given by Eqs. 15, calculated using the exact (for the equilibrium model) expression for kCO in Eq. 16. Red trace is a monoexponential kinetics for [A] + [R] given by Eqs. 15, calculated using the approximate expression for kCO in Eq. 16.
With increasing kAR, as expected, the exact analytical solution using the equilibrium model becomes progressively further from the numerical solution of Eqs. 3: in panels a, b, and c, the slope of the green trace overestimates the asymptotic slope of the black trace by 0.4%, 4%, and 15%, respectively. As explained below, this overestimation of kCO is mostly caused by the assumption of the internal conformational equilibrium in the F state. Interestingly, since the linear expansion of the square root in Eq. 16 underestimates the resulting rate constant, the approximate expression for kCO is actually closer to the numerical solution than the exact one, the errors for panels a, b, and c being 0.3%, 1.4%, and 1.1%, respectively.
Since the active state converts back to the ready state with the rate constant kAR from both conformations, U and D, the conformational equilibrium in the active state is not very important for the validity of the equilibrium model (i.e., the first equation in Eqs. 11 is valid regardless of the internal equilibrium in the A state). On the other hand, the final state connects to the ready state through the ET from the docked conformation, DF, to the active state. This one-ended connection makes maintaining the conformational equilibrium in the final state especially important for the validity of the equilibrium model. In practical terms, this means that the decrease in [DF] caused by the CO rebinding process should be timely compensated for by the net population transfer from the undocked state, UF. Therefore, one can expect the equilibrium approximation to overestimate kCO (by assuming instant conformational equilibration in the F state) and to become progressively poorer for kUD comparable with or smaller than kAR. Indeed, the calculation similar to that in Figure 5c, but with kUD = 1 ms−1 results in the relative errors of the “exact” and “approximate” expressions of 45% and 24%, respectively. The condition kUD = kAR thus represents an approximate applicability limit for the equilibrium model. In our discussion of the experimental data below we will show that this limit is practically never reached, and the equilibrium model in most cases is adequate for describing the CO rebinding process.
5. Using kIET and kCO for practical estimates
There are essentially three parameters that are measured in an LFP experiment: kIET (Eq. 10), ΔAλ, which is the change in Aλ due to the IET, and kCO (Eq. 16). The intrinsic CO rebinding rate, kAR, can be measured separately for the NOS heme domain (NOSoxy construct) using the same CO concentration as the actual IET measurements. One can compare this rate with kIET to establish if the equilibrium approximation (Eqs. 11) is adequate for describing the CO rebinding process in the actual experiments. For all of the NOS proteins listed in Table 1, with the exception of wt rat nNOS oxyFMN without CaM21 and bovine eNOS,17 kIET is over 30 s−1, while the measured kAR values are about 10 s−1.21–22 Since kIET < kUD (see Eq. 10), kUD/kAR > 3. For such kUD/kAR ratios, the approximate formula in Eq. 16 predicts the CO rebinding kinetics with the accuracy of ~ 1% or better (see, e.g., the calculation in Figure 5c, which corresponds to kUD/kAR = 3), and thus the equilibrium model in the overwhelming majority of cases is appropriate for the description of the CO rebinding process. Should the validity of the equilibrium model for some sample become questionable, the LFP experiment can be repeated at a lower CO concentration. Since kAR ∝ [CO], the decrease in [CO] can establish the conditions appropriate for the equilibrium model applicability.
Using the approximate expression in Eq. 16 and the experimental values of kAR and kCO, one can estimate the ratio of kETb and kET (and from there, kETb/kETf):
| (17) |
The relative accuracy of the approximate equality in Eq. 17 is obviously equal to kAR(1+rUD)/kET. We will show below, when we discuss kIET, that this approximation is sufficiently accurate for all practical purposes.
As an example, a comparison between kAR and kCO constants obtained in the same sets of experiments under identical conditions shows that kAR/kCO is close to 2 (10 s−1/5.6 s−1 for NOSoxy/oxyFMN constructs of murine iNOS22 or 10.6 s−1/3.8 s−1 for rat nNOS21). It thus follows from Eq. 17 that kETb ≈ kETf, which is in agreement with the expectations based on the fact that Fe(III)/Fe(II) and FMNH•/FMNhq are nearly isopotential.34 One has to note, however, that caution should be exercised when correlating the intrinsic ET rates, kETf and kETb, with the redox potentials because these rates are also probably affected to a large degree by the conformational sampling (the adjustment of the domain alignment in the docking complex). Unfortunately, at this point, it is not possible to fully address this problem because the exact information about the absolute ET rates is not available (see below).
The “IET kinetic amplitude”, ΔAλ, can also give information about the ratio of the forward and backward ET constants:
| (18) |
where [A]o and [A]∞ are the active state concentrations at t = 0 and t → ∞ (or more practically, the time when [A] and [F] approximately equilibrate before the onset of the CO rebinding process), respectively. The accuracy of such estimates using ΔAλ, however, would be significantly lower because they require accurate knowledge of [NOS] and εA.
Let us now consider the observed IET rate constant, kIET. If the intrinsic ET rate is much faster than the rates of conformational interconversions (kET ≫ kUD, kDU) then Eq. 10 simplifies to kIET ≈ kUD. In this case, the observed IET rate constant is obviously determined by the rate of formation of the docked state, kUD. If kET is comparable with the docked state dissociation rate (kET ~ kDU > (≫) kUD), then kIET becomes sensitive to kDU: kIET ≈ kETkUD/(kET+kDU). For still smaller kET (kET ≤ kUD < (≪) kDU), this trend continues, and the observed IET rate becomes highly sensitive to kDU: kIET ≈ kETkUD/kDU. Similar approximate expressions were obtained for a bimolecular ET in the pseudo first order limit, when the acceptor concentration was considered much greater than that of the donor.23
To determine the intrinsic ET rate(s), one can rewrite the approximate equality in Eq. 11 as:
| (19) |
The conformational rate constants, kDU and kUD, are not known separately, and only their ratio, rUD, has been measured (in the form of [U]o/[D]o population ratio, see Eq. 2) for some of the NOS preparations by pulsed EPR and fluorescence lifetime measurements; see Table 1. Therefore, at this stage, one can only estimate the range of possible kET values corresponding to the value of kIET measured in an experiment.
As follows from Eq. 10, kIET < kUD, but kIET → kUD for kET → ∞. Conversely, assuming kIET = kUD results in kET = ∞, which represents the upper limit of possible kET values. The lower limit is obtained by assuming kIET ≪ kUD, in which case the minimal kET is given by the last expression in Eq. 19. To estimate the specific value of kET, an absolute measurement of the conformational rate constants is necessary.
Equation 19 and the experimental data in Table 1 can be used for validating the approximate expression in Eq. 17. As mentioned above, the relative error of this expression is kAR(1+rUD)/kET ≤ kAR/kIET, where the inequality follows from Eq. 19. For many full-length NOS enzymes in Table 1 (with the exception of bovine eNOS) kIET is within the range of 35 – 45 s−1. Using kAR ~ 10 s−1,21–22 one can estimate the potential error of the approximate expression in Eq. 17 to be about 25% or smaller. Similar analysis can be performed for the bi-domain oxyFMN constructs, where the kIET rate constants range between 262 s−1 (wt rat nNOS oxyFMN21) and 850 s−1 (wt murine iNOS oxyFMN22). The potential error of the approximate Eq. 17 in this case is smaller than 5%.
Some examples of using Eq. 10 for preliminary interpretation of experimental kIET values summarized in Table 1 are discussed below.
The bulk IET rates can be used to estimate the minimal intrinsic kET rate constants using Eq. 19 and the experimental rUD values. The inspection of Table 1 shows, however, that while there is a substantial number of kIET entries, the rUD values have only been measured for a limited number of samples. Moreover, even the available rUD values most likely contain significant inaccuracies (partly resulting from difficulties in the interpretation/assignment of the fluorescence components with different lifetimes), as can be deduced from the fact that some of them are mutually contradictory. For example, for nNOS oxyFMN without bound CaM, [D]o ~ 0 was measured by pulsed EPR,29 but at the same time, the [D]o values of ~ 12%33 and 19%31 were estimated by FMN fluorescence lifetime measurements for the full-length nNOS without CaM (where the [D]o values should be smaller than for the oxyFMN construct). As another example, different rUD values for the full-length rat nNOS with bound CaM resulted from two fluorescence lifetime measurements31, 33 (see Table 1).
It is thus obvious that the conformational equilibrium measurements lag significantly behind the IET rate measurements both in number and, potentially, in accuracy, and at present can only be considered with great caution. For comparative considerations, we will therefore only use the rUD values obtained by the same technique in the same set of measurements (there is currently only one example of such, given by the full-length murine iNOS and the corresponding oxyFMN construct32).
For the minimal kET estimates, we can use the overall minimal rUD = 2.6 listed in Table 1. Although this value is for the oxyFMN construct, the minimal available rUD for a full-length enzyme is not much greater (rUD = 2.9 for the full-length rat nNOS31). Thus, from kIET = 850 s−1 in murine iNOS oxyFMN, the minimal kET = 3060 s−1 can be estimated. Similarly, the minimal kET of about 940 s−1 can be estimated from kIET = 262 s−1 for the oxyFMN construct of rat nNOS. If, however, rUD ≈ 5.5 determined for this enzyme by pulsed EPR29 is used, then the minimal intrinsic ET rate becomes kET ≈ 1700 s−1, significantly closer to that estimated for iNOS oxyFMN.
For the full-length enzymes (excluding bovine eNOS), the bulk IET rates are within the range of 35 – 45 s−1, which results in minimal kET ~ 135 – 175 s−1 (for rUD = 2.931) or about twice greater using rUD = 4.7.33 These estimated minimal kET values are much smaller than those for the oxyFMN constructs, but it is not clear if such a cross-experiment comparison of minimal kET values would be meaningful at present, given the potential rUD accuracy problems discussed above.
For the wt full-length bovine eNOS, the bulk IET rate is low (only 4.3 ± 1 s−1). Based on the fluorescence lifetime data for the wt eNOS,35 rUD is estimated to be 4.0. The minimal kET value for the wt bovine eNOS is thus 22 ± 5 s−1. For comparison, rUD = 8.6 ± 2.9 and 6 ± 2 can be obtained from the fluorescence decay and single-molecule fluorescence trajectory data for the S1179D mutant of bovine eNOS.30 The larger rUD found for the mutant eNOS contradicts the expectation that rUD should be significantly smaller than in the wt because the phosphomimetic mutation doubles the synthase activity and has a stabilizing effect on the FMN-heme docking complex.36–37 This again suggests that the available rUD values are rather qualitative and might contain significant inaccuracies. Therefore, it is not clear if the slow bulk IET rate in eNOS is due to the decrease in kET or an increase in rUD and kDU, or both. Nonetheless, the minimal kET value for eNOS is obviously much smaller than those of nNOS and iNOS.
-
(ii)
As mentioned above, the kIET values for the full-length enzymes are significantly smaller than that observed for the oxyFMN construct: 35 s−1 vs. 850 s−1 in murine iNOS, 35 s−1 vs. 343 s−1 in human iNOS, and 43 s−1 vs. 262 s−1 in CaM-bound rat nNOS. Since in a full-length enzyme the FMN domain spends part of the time docked to the FNR domain (see Figure 1), the rate of formation of the FMN-heme docked state in a full-length protein is slower than in the corresponding oxyFMN construct. This results in decrease of kIET, which is proportional to kUD. The rUD data for murine iNOS (full-length vs. oxyFMN) that were obtained in the same set of fluorescence lifetime experiments32 support these considerations. In addition, it is plausible that either kDU or kET, or both, are also affected by the presence or absence of the FNR domain in the studied protein. The complete understanding of the changes will only be possible when the direct experimental data on the conformational rate constants become available.
-
(iii)
The IET rate in the oxyFMN construct of rat nNOS without CaM is an order of magnitude slower than in the enzyme with CaM (see Table 1). This can qualitatively be rationalized by considering the fact that the bound CaM facilitates the FMN-heme domain docking (through its own docking to the heme domain),25 and without CaM either kUD becomes very small or kDU becomes very large, or both.
-
(iv)
The experiments with human iNOS oxyFMN mutated at the FMN - heme domain linker (S562K, C563, and R536E mutations, see Table 1) have resulted in a decrease of kIET for two of the mutants, S562K and R536E, with the effect for R536E being especially dramatic (~ 25-fold decrease of kIET). The most likely reason for the observed IET rate changes is the decrease of kUD. Such a strong effect of the R536E mutation is conceivable because the CaM-binding region of the FMN - heme domain linker together with CaM forms a hinge and pivots on the R536(NOS)/E47(CaM) pair.38
-
(v)
The diffusion controlled kUD depends on the solvent viscosity. Unless kUD ≫ (kDU, kET), kIET ∝ kUD, and it is expected that kIET should become smaller as viscosity increases. Indeed, an approximately linear correlation between the viscosity and 1/kIET was observed.16
-
(vi)
The E546N mutation of human iNOS oxyFMN has resulted in a 2.5-fold decrease of kIET, and a comparable (~ two-fold) increase in rUD was observed.14 The conserved E546 residue is located on the FMN domain surface and is involved in the FMN - heme domain docking interface. The observed decrease in kIET in this case is most likely related to the increase in kDU.
Conclusions
In this work, we have provided an analytical solution of kinetic equations describing the NOS LFP experiments. The exact and approximate formulae expressing the observed bulk IET and CO rebinding rates through the intrinsic rate constants will be useful for interpreting the LFP data from various native and modified NOS enzymes. The analysis of these expressions has revealed that in order to fully interpret the LFP results in terms of the intrinsic ET rates, direct experimental data on the docking equilibrium and conformational change rate constants are necessary. The equilibrium data can be obtained by pulsed EPR29 and/or fluorescence lifetime31 measurements, while the absolute conformational rate constants may be measurable using single-molecule fluorescence resonance energy transfer.30, 39–40 A combined approach consisting of all these measurements and numerical simulations of the IET kinetics using either a numerical solution of the kinetic equations or their exact solution without the CO rebinding obtained in this work will allow one to achieve a detailed understanding of the role of various structural and dynamic factors in determining the NOS IET and NO production efficiency. In particular, it would be interesting to conduct this kind of studies in parallel for the three NOS isoforms and correlate the intrinsic rate constants with the FMN⋯heme distances in the FMN/heme docking complexes.41 Such a work will significantly advance our understanding of the structural determinants underlying the significantly different IET rates.
The mathematical expressions derived in this work will also be applicable, with minor modifications, for interpreting the IET kinetics in other modular enzymes whose function depends on conformational mobility, e.g., sulfite oxidase42 or the Rieske protein of the cytochrome bc1 complex.22 This work should inspire further systematic measurements of the conformational change rates and conformational equilibria, and investigations of their effect on the electron transfer efficiency in modular enzymes.
Acknowledgments
This work was supported by NIH GM081811, NSF CHE-1150644, and AHA Grant-in-Aid 12GRNT11780019. We thank Prof. John Enemark (University of Arizona) for stimulating discussions.
Abbreviations
- NO
nitric oxide
- NOS
nitric oxide synthase
- eNOS
endothelial NOS
- iNOS
inducible NOS
- nNOS
neuronal NOS
- CaM
calmodulin
- FAD
flavin adenine dinucleotide
- FMN
flavin mononucleotide
- FNR
ferredoxin-NADP reductase
- ET
electron transfer
- IET
interdomain electron transfer
- EPR
electron paramagnetic resonance
- LFP
laser flash photolysis
- oxyFMN
bi-domain NOS construct in which only oxygenase and FMN domains along with CaM-binding region are present
Footnotes
Supporting Information. Calculated active state population for kAR = 0 and various rUD values; exact solution of kinetic equations without the back IET (kETb = 0), but accounting for the CO rebinding (kAR > 0); details of numerical solution of the kinetic equations. This information is available free of charge via the Internet at http://pubs.acs.org.
References
- 1.Alderton WK, Cooper CE, Knowles RG. Nitric Oxide Synthases: Structure, Function and Inhibition. Biochem. J. 2001;357:593–615. doi: 10.1042/0264-6021:3570593. [DOI] [PMC free article] [PubMed] [Google Scholar]
- 2.Poulos TL. Heme Enzyme Structure and Function. Chem. Rev. 2014;114:3919–3962. doi: 10.1021/cr400415k. [DOI] [PMC free article] [PubMed] [Google Scholar]
- 3.Panda K, Ghosh S, Stuehr DJ. Calmodulin Activates Intersubunit Electron Transfer in the Neuronal Nitric-Oxide Synthase Dimer. J. Biol. Chem. 2001;276:23349–23356. doi: 10.1074/jbc.M100687200. [DOI] [PubMed] [Google Scholar]
- 4.Roman LJ, Martasek P, Masters BSS. Intrinsic and Extrinsic Modulation of Nitric Oxide Synthase Activity. Chem. Rev. 2002;102:1179–1189. doi: 10.1021/cr000661e. [DOI] [PubMed] [Google Scholar]
- 5.Stuehr DJ, Santolini J, Wang ZQ, Wei CC, Adak S. Update on Mechanism and Catalytic Regulation in the No Synthases. J. Biol. Chem. 2004;279:36167–36170. doi: 10.1074/jbc.R400017200. [DOI] [PubMed] [Google Scholar]
- 6.Feng C. Mechanism of Nitric Oxide Synthase Regulation: Electron Transfer and Interdomain Interactions. Coord. Chem. Rev. 2012;256:393–411. doi: 10.1016/j.ccr.2011.10.011. [DOI] [PMC free article] [PubMed] [Google Scholar]
- 7.Noble MA, Munro AW, Rivers SL, Robledo L, Daff SN, Yellowlees LJ, Shimizu T, Sagami I, Guillemette JG, Chapman SK. Potentiometric Analysis of the Flavin Cofactors of Neuronal Nitric Oxide Synthase. Biochemistry. 1999;38:16413–16418. doi: 10.1021/bi992150w. [DOI] [PubMed] [Google Scholar]
- 8.Gao YT, Smith SME, Weinberg JB, Montgomery HJ, Newman E, Guillemette JG, Ghosh DK, Roman LJ, Martasek P, Salerno JC. Thermodynamics of Oxidation-Reduction Reactions in Mammalian Nitric-Oxide Synthase Isoforms. J. Biol. Chem. 2004;279:18759–18766. doi: 10.1074/jbc.M308936200. [DOI] [PubMed] [Google Scholar]
- 9.Daff S, Noble MA, Craig DH, Rivers SL, Chapman SK, Munro AW, Fujiwara S, Rozhkova E, Sagami I, Shimizu T. Control of Electron Transfer in Neuronal No Synthase. Biochem. Soc. Trans. 2001;29:147–152. doi: 10.1042/0300-5127:0290147. [DOI] [PubMed] [Google Scholar]
- 10.Panda K, Adak S, Konas D, Sharma M, Stuehr DJ. A Conserved Aspartate (Asp-1393) Regulates Nadph Reduction of Neuronal Nitric-Oxide Synthase - Implications for Catalysis. J. Biol. Chem. 2004;279:18323–18333. doi: 10.1074/jbc.M310391200. [DOI] [PubMed] [Google Scholar]
- 11.Sheng Y, Zhong L, Guo D, Lau G, Feng C. Insight into Structural Rearrangements and Interdomain Interactions Related to Electron Transfer between Flavin Mononucleotide and Heme in Nitric Oxide Synthase: A Molecular Dynamics Study. J. Inorg. Biochem. 2015 doi: 10.1016/j.jinorgbio.2015.08.006. in press. [DOI] [PMC free article] [PubMed] [Google Scholar]
- 12.Hollingsworth SA, Holden JK, Li H, Poulos TL. Elucidating Nitric Oxide Synthase Domain Interactions by Molecular Dynamics. Protein Sci. 2015 doi: 10.1002/pro.2824. in press. [DOI] [PMC free article] [PubMed] [Google Scholar]
- 13.Leferink NGH, Hay S, Rigby SEJ, Scrutton NS. Towards the Free Energy Landscape for Catalysis in Mammalian Nitric Oxide Synthases. FEBS J. 2015;282:3016–3029. doi: 10.1111/febs.13171. [DOI] [PubMed] [Google Scholar]
- 14.Li W, Chen L, Lu C, Elmore BO, Astashkin AV, Rousseau DL, Yeh S-R, Feng C. Regulatory Role of Glu546 in Flavin Mononucleotide — Heme Electron Transfer in Human Inducible Nitric Oxide Synthase. Inorg. Chem. 2013;52:4795–4801. doi: 10.1021/ic3020892. [DOI] [PMC free article] [PubMed] [Google Scholar]
- 15.Li W, Fan W, Chen L, Elmore B, Piazza M, Guillemette J, Feng C. Role of an Isoform-Specific Serine Residue in Fmn–Heme Electron Transfer in Inducible Nitric Oxide Synthase. J. Biol. Inorg. Chem. 2012;17:675–685. doi: 10.1007/s00775-012-0887-y. [DOI] [PMC free article] [PubMed] [Google Scholar]
- 16.Li W, Fan W, Elmore BO, Feng C. Effect of Solution Viscosity on Intraprotein Electron Transfer between the Fmn and Heme Domains in Inducible Nitric Oxide Synthase. FEBS Lett. 2011;585:2622–2626. doi: 10.1016/j.febslet.2011.07.022. [DOI] [PMC free article] [PubMed] [Google Scholar]
- 17.Feng C, Taiakina V, Ghosh DK, Guillemette JG, Tollin G. Intraprotein Electron Transfer between the Fmn and Heme Domains in Endothelial Nitric Oxide Synthase Holoenzyme. Biochimica et Biophysica Acta (BBA) - Proteins & Proteomics. 2011;1814:1997–2002. doi: 10.1016/j.bbapap.2011.08.004. [DOI] [PMC free article] [PubMed] [Google Scholar]
- 18.Feng C, Fan W, Dupont A, Guy Guillemette J, Ghosh DK, Tollin G. Electron Transfer in a Human Inducible Nitric Oxide Synthase Oxygenase/Fmn Construct Co-Expressed with the N-Terminal Globular Domain of Calmodulin. FEBS Lett. 2010;584:4335–4338. doi: 10.1016/j.febslet.2010.09.028. [DOI] [PMC free article] [PubMed] [Google Scholar]
- 19.Feng CJ, Dupont A, Nahm N, Spratt D, Hazzard JT, Weinberg J, Guillemette J, Tollin G, Ghosh DK. Intraprotein Electron Transfer in Inducible Nitric Oxide Synthase Holoenzyme. J. Biol. Inorg. Chem. 2009;14:133–142. doi: 10.1007/s00775-008-0431-2. [DOI] [PMC free article] [PubMed] [Google Scholar]
- 20.Feng CJ, Roman LJ, Hazzard JT, Ghosh DK, Tollin G, Masters BSS. Deletion of the Autoregulatory Insert Modulates Intraprotein Electron Transfer in Rat Neuronal Nitric Oxide Synthase. FEBS Lett. 2008;582:2768–2772. doi: 10.1016/j.febslet.2008.07.005. [DOI] [PMC free article] [PubMed] [Google Scholar]
- 21.Feng CJ, Tollin G, Holliday MA, Thomas C, Salerno JC, Enemark JH, Ghosh DK. Intraprotein Electron Transfer in a Two-Domain Construct of Neuronal Nitric Oxide Synthase: The Output State in Nitric Oxide Formation. Biochemistry. 2006;45:6354–6362. doi: 10.1021/bi060223n. [DOI] [PubMed] [Google Scholar]
- 22.Feng CJ, Thomas C, Holliday MA, Tollin G, Salerno JC, Ghosh DK, Enemark JH. Direct Measurement by Laser Flash Photolysis of Intramolecular Electron Transfer in a Two-Domain Construct of Murine Inducible Nitric Oxide Synthase. J. Am. Chem. Soc. 2006;128:3808–3811. doi: 10.1021/ja0578606. [DOI] [PubMed] [Google Scholar]
- 23.Kawatsu T, Beratan DN. Electron Transfer between Cofactors in Protein Domains Linked by a Flexible Tether. Chem. Phys. 2006;326:259–269. [Google Scholar]
- 24.Feng C, Chen L, Li W, Elmore BO, Fan W, Sun X. Dissecting Regulation Mechanism of the Fmn to Heme Interdomain Electron Transfer in Nitric Oxide Synthases. J. Inorg. Biochem. 2014;130:130–140. doi: 10.1016/j.jinorgbio.2013.09.005. [DOI] [PMC free article] [PubMed] [Google Scholar]
- 25.Smith BC, Underbakke ES, Kulp DW, Schief WR, Marletta MA. Nitric Oxide Synthase Domain Interfaces Regulate Electron Transfer and Calmodulin Activation. Proc Natl Acad Sci U S A. 2013;110:E3577–E3586. doi: 10.1073/pnas.1313331110. [DOI] [PMC free article] [PubMed] [Google Scholar]
- 26.Moser CC, Keske JM, Warncke K, Farid RS, Dutton PL. Nature of Biological Electron Transfer. Nature. 1992;355:796–802. doi: 10.1038/355796a0. [DOI] [PubMed] [Google Scholar]
- 27.Page CC, Moser CC, Chen XX, Dutton PL. Natural Engineering Principles of Electron Tunnelling in Biological Oxidation-Reduction. Nature. 1999;402:47–52. doi: 10.1038/46972. [DOI] [PubMed] [Google Scholar]
- 28.Feng CJ, Tollin G, Hazzard JT, Nahm NJ, Guillemette JG, Salerno JC, Ghosh DK. Direct Measurement by Laser Flash Photolysis of Intraprotein Electron Transfer in a Rat Neuronal Nitric Oxide Synthase. J. Am. Chem. Soc. 2007;129:5621–5629. doi: 10.1021/ja068685b. [DOI] [PubMed] [Google Scholar]
- 29.Astashkin AV, Chen L, Zhou X, Li H, Poulos TL, Liu KJ, Guillemette JG, Feng C. Pulsed Electron Paramagnetic Resonance Study of Domain Docking in Neuronal Nitric Oxide Synthase: The Calmodulin and Output State Perspective. J. Phys. Chem. A. 2014;118:6864–6872. doi: 10.1021/jp503547w. [DOI] [PMC free article] [PubMed] [Google Scholar]
- 30.Arnett DC, Persechini A, Tran Q-K, Black DJ, Johnson CK. Fluorescence Quenching Studies of Structure and Dynamics in Calmodulin–Enos Complexes. FEBS Lett. 2015;589:1173–1178. doi: 10.1016/j.febslet.2015.03.035. [DOI] [PMC free article] [PubMed] [Google Scholar]
- 31.Salerno JC, Ray K, Poulos T, Li H, Ghosh DK. Calmodulin Activates Neuronal Nitric Oxide Synthase by Enabling Transitions between Conformational States. FEBS Lett. 2013;587:44–47. doi: 10.1016/j.febslet.2012.10.039. [DOI] [PubMed] [Google Scholar]
- 32.Ghosh DK, Ray K, Rogers AJ, Nahm NJ, Salerno JC. Fmn Fluorescence in Inducible Nos Constructs Reveals a Series of Conformational States Involved in the Reductase Catalytic Cycle. FEBS J. 2012;279:1306–1317. doi: 10.1111/j.1742-4658.2012.08525.x. [DOI] [PubMed] [Google Scholar]
- 33.Brunner K, Tortschanoff A, Hemmens B, Andrew PJ, Mayer B, Kungl AJ. Sensitivity of Flavin Fluorescence Dynamics in Neuronal Nitric Oxide Synthase to Cofactor-Induced Conformational Changes and Dimerization. Biochemistry. 1998;37:17545–17553. doi: 10.1021/bi981138l. [DOI] [PubMed] [Google Scholar]
- 34.Ghosh DK, Holliday MA, Thomas C, Weinberg JB, Smith SME, Salerno JC. Nitric-Oxide Synthase Output State - Design and Properties of Nitric-Oxide Synthase Oxygenase/Fmn Domain Constructs. J. Biol. Chem. 2006;281:14173–14183. doi: 10.1074/jbc.M509937200. [DOI] [PubMed] [Google Scholar]
- 35.Salerno JC, Ghosh DK, Razdan R, Helms KA, Brown CC, McMurry JL, Rye EA, Chrestensen CA. Endothelial Nitric Oxide Synthase Is Regulated by Erk Phosphorylation at Ser602. Biosci Rep. 2014;34 doi: 10.1042/BSR20140015. [DOI] [PMC free article] [PubMed] [Google Scholar]
- 36.Persechini A, Tran QK, Black DJ, Gogol EP. Calmodulin-Induced Structural Changes in Endothelial Nitric Oxide Synthase. FEBS Lett. 2013;587:297–301. doi: 10.1016/j.febslet.2012.12.012. [DOI] [PMC free article] [PubMed] [Google Scholar]
- 37.Tran QK, Leonard J, Black DJ, Nadeau OW, Boulatnikov IG, Persechini A. Effects of Combined Phosphorylation at Ser-617 and Ser-1179 in Endothelial Nitric-Oxide Synthase on Ec50(Ca2+) Values for Calmodulin Binding and Enzyme Activation. J. Biol. Chem. 2009;284:11892–11899. doi: 10.1074/jbc.M806205200. [DOI] [PMC free article] [PubMed] [Google Scholar]
- 38.Xia C, Misra I, Iyanagi T, Kim J-JP. Regulation of Interdomain Interactions by Calmodulin in Inducible Nitric Oxide Synthase. J. Biol. Chem. 2009;284:30708–30717. doi: 10.1074/jbc.M109.031682. [DOI] [PMC free article] [PubMed] [Google Scholar]
- 39.He Y, Haque MM, Stuehr DJ, Lu HP. Single-Molecule Spectroscopy Reveals How Calmodulin Activates No Synthase by Controlling Its Conformational Fluctuation Dynamics. Proc Natl Acad Sci U S A. 2015;112:11835–11840. doi: 10.1073/pnas.1508829112. [DOI] [PMC free article] [PubMed] [Google Scholar]
- 40.Weiss S. Fluorescence Spectroscopy of Single Biomolecules. Science. 1999;283:1676–1683. doi: 10.1126/science.283.5408.1676. [DOI] [PubMed] [Google Scholar]
- 41.Astashkin AV, Elmore BO, Fan W, Guillemette JG, Feng C. Pulsed Epr Determination of the Distance between Heme Iron and Fmn Centers in a Human Inducible Nitric Oxide Synthase. J. Am. Chem. Soc. 2010;132:12059–12067. doi: 10.1021/ja104461p. [DOI] [PMC free article] [PubMed] [Google Scholar]
- 42.Feng C, Tollin G, Enemark JH. Sulfite Oxidizing Enzymes. Biochim. Biophys. Acta. 2007;1774:527–39. doi: 10.1016/j.bbapap.2007.03.006. [DOI] [PMC free article] [PubMed] [Google Scholar]