

Abstract
Small diffusible redox proteins facilitate electron transfer in respiration and photosynthesis by alternately binding to their redox partners, integral membrane proteins, and exchanging electrons. Diffusive search, recognition, binding and unbinding of these proteins amount often to kinetic bottlenecks in cellular energy conversion, but despite the availability of structures and intense study, the physical mechanisms controlling redox partner interactions remain largely unknown. The present molecular dynamics study provides an all-atom description of the cytochrome c2 - docked bc1 complex in Rhodobacter sphaeroides in terms of an ensemble of favorable docking conformations, and reveals an intricate series of conformational changes that allow cytochrome c2 to recognize the bc1 complex and bind or unbind in a redox state-dependent manner. In particular, the role of electron transfer in triggering a molecular switch, and in altering water-mediated interface mobility, thereby strengthening and weakening complex formation, is described. The results resolve long-standing discrepancies between structural and functional data.
Introduction
Cellular respiratory and photosynthetic pathways employ small diffusible redox proteins for the transport of single electrons between neighboring, as well as widely separated, membrane-integrated enzymatic complexes. The proteins are required as single electrons must be moved between different parts of the bioenergetic apparatus which can be achieved only by special redox proteins, not by small molecules as the latter are converted through transfer of single electrons to chemical radicals that cannot be turned loose in the cell. Cytochrome c (cyt. c) is one such single electron transport protein capable of safeguarding a single electron. Cyt. c belongs to an exemplary family of redox proteins that participate in the mitochondrial electron transport chain, shuttling electrons, usually only over a short distance, between the cytochrome bc1 complex and cytochrome c oxidase.1–3 Similarly, cytochrome c2 (cyt. c2), a homologue of mitochondrial cyt. c, mediates membrane-wide electron transport between bc1 complex and reaction center proteins within the chromatophore,4,5 a vesicle-shaped photosynthetic apparatus found in purple bacteria.
To carry out their function single electron transport proteins need to find and dock to the electron donor, transfer the electron and unbind as a result of it, and afterwards find the electron acceptor, dock to it to deliver the electron and unbind to repeat the sequence. In the present computational study we seek to determine, for the case of cyt. c2 docking to the cyt. c1 subunit of the bc1 complex, the recognition, docking and undocking steps. In particular, we seek to determine the dependence of docking and undocking on the redox states of the associated cyt. c2 and cyt. c1 heme groups. Given that cyt. c family of electron transfer proteins from human, horse, pig, rabbit, chicken, tuna, yeast, and bacteria are highly identical in terms of structure and sequence,1,2 our study of the Rhodobacter (Rba.) sphaeroides photosynthetic system applies to electron transfer mediated by cyt. c in respiratory processes and cyt. c2 in photosynthetic processes.
To illustrate the specific role of cyt. c2 in the photosynthesis of purple bacteria, energy conversion processes within the bacterial chromatophore are depicted in three stages4 (see Fig. S1). In the first stage, light energy is absorbed and transferred to the photosynthetic reaction center (RC), where each excitation induces a charge separation process. Two such processes, along with concomitant proton transfers, doubly reduce a quinone molecule to a quinol. In the second stage, the quinol is released from RC and joins a quinol/quinone pool; this pool delivers a quinol to a bc1 complex. At the bc1 complex, an iron-sulfur protein (ISP) extracts the first electron from the bound quinol (the second electron enters a separate reaction, the Q-cycle4,5), moves it to the heme of cyt. c1 and, subsequently, to the heme of cyt. c2 (Fig. 1a). The reduced cyt. c2 unbinds from the bc1 complex, diffuses to an electron-deficient RC, and adds back the electron. Removal of electrons from the bc1 complex-bound quinol through cyt. c2 and through a second electron transfer towards the Q-cycle components4,5 yields a quinone as well as releases two protons into the periplasmic space (into the inside) of the chromatophore vesicle, thereby generating a proton gradient across the membrane. The quinone joins the quinol/quinone pool which contributes a fresh quinone to a RC, thus closing the loop. In the third stage, the proton gradient generated at the bc1 complex is harnessed by ATP synthase to produce ATP.
Figure 1. Structure of Rba. sphaeroides bc1 complex embedded in lipid bilayer with bound cyt. c2.

(a) The cyt. b and cyt. c1 subunits, one in each of the two monomers of the bc1 complex, are shown in purple, cyt. c2 in green, and the iron-sulfur protein subunit in pink. The putative electron transport pathway is indicated by red arrows. (b) Scatter diagram superimposing 10,000 structures (saved every 10 ps from the final 100 ns of the MD simulation of the DOT-docked model in the state) reveal a conformational ensemble of cyt. c2 bound to the cyt. c1 subunit. The ensemble exhibits a distribution of heme-heme geometries, all with short edge-to-edge distances of 8.5 Å (Fig. 3a and Table S4). The distribution is representative of the thermal disorder at the binding interface. Purple: cyt. c1 subunit of left bc1 monomer; green: docked cyt. c2; cyan: carbon atoms of cyt. c1 and cyt. c2 heme groups; red: oxygen atoms of the heme groups.
An enzymatic activity of a bc1 complex of 40 cyt. c2 per second is essential for continuous flow of electrons during the second stage of the bacterial photosynthetic pathway described here.6–8 Thus, the average cyt. c2 turnover time is expected to be of the order of 25 ms. Rate measurements8 infer that, within this 25 ms, cyt. c2 spends 11.5 ms at the bc1 complex surface for binding, accepting an electron and unbinding, and 1.25 ms at the RC surface for binding, donating an electron and unbinding; the remaining 12 ms are spent on traversing between bc1 and RC while also avoiding redox-incompatible binding sites.8 Accomplishment of such precise functions every 25 ms necessitates cyt. c2 binding to the bc1 complex to be both specific and transient.9,10 Based on salinity-profiling11,12 and mutational studies,13 the two characteristics of cyt. c2 binding were hypothesized to originate from electrostatic association with the binding partners, such as cyt. c1,13,14 cyt. c - oxidase,15 and RC complexes.16 Consequently, the electrostatic interactions between cyt. c/c2 and its binding partners have been studied in regard to their role in molecular recognition.17 More recent crystallographic studies pointed also to a key role of hydrophobic interactions in stabilizing the cyt. c2 interface.10 In particular, hydrophobic interactions were found to control inter-heme distance and orientation and, thereby, electron transfer between the binding partners9,18.
Taken together, the correct balance between, on the one hand, adhesive interactions that maintain a tight cyt. c2 - bc1 complex interface permiting direct inter-heme electron transfer and, on the other hand, interactions that allow separation after electron transfer, has been a subject of active debate.10,14,19–22 For example, if the interface-stabilizing interactions were solely based on electrostatic interactions (e.g. salt bridges), unbinding of cyt. c2 would be energetically uphill, slowing down the overall photosynthetic cycle and, thereby, the rate of ATP synthesis.8 Cation-π interactions, on the other hand, are suggested to be present and mediate electron transfer.9,10 However, the extent of stabilization that such interactions provide to the interface remains questionable given conflicting experimental estimates of associated energetics.20 Thus, the cation-π interactions seem to also not be adequate for sculpting interface conformations to allow electron transfer, even though they enable a fairly transient interface as compared to an electrostatic-only binding scenario.14 Altogether, resolution of such conceptually intriguing questions on interface recognition, binding, and unbinding, raised across a diverse range of experimental observations,9,10,20 calls for an atomic-scale investigation of the cyt. c2 - bc1 binding interface.
In the present study, rigid-body docking computations are combined with molecular dynamics (MD) simulations to investigate the redox dependent binding interface between cyt. c2 and bc1 complex of Rba. sphaeroides (Fig. 1). Since the respective mitochondrial electron transfer process has been well-studied, e.g., in yeast,9,10,23 the current Rba. sphaeroides results can be benchmarked against those in yeast. Notions such as half-ring guided interface recognition and docking,14 minimal core mediated electron transfer,10 and mobility-mismatch induced undocking,9,14 that were hypothesized based on stationary structures for the yeast cyt. c2 - bound bc1 complex, are found to establish indeed a mechanism of cyt. c/c2 binding. However, a surprising finding of the present molecular dynamics study is that a well defined cyt. c2 - cyt. c1 complex is not formed; rather an ensemble of nearly identical, yet conformationally slightly disordered complexes is formed that all exhibit a short heme edge-heme edge distance of 8.5 Å (Fig. 1b). This distance and the hydrophobic characteristics of the near-heme contact area is optimal for fast electron transfer. Accordingly, formation of a specific complex is neither needed nor desirable as a broad range of docking conformations are equally functional and the availability of many good states (see Fig. 1b) speeds up the recognition and binding reaction. This finding is in stark contrast to expectations from crystallographically observed structures that are interpreted to suggest the existence of single, structurally well defined docking complexes.
Another key finding is the realization of a trade-off between electrostatic, van der Waals, and cation-π interactions that modifies the binding interface as a result of cyt. c1 → cyt. c2 electron transfer. In particular, changes in side-chain conformation of interface residues in response to the electron transfer alter strong cyt. c2 binding (before electron transfer) to unbinding (after electron transfer).
Clearly, critical to the answer to questions on cyt. c2 docking dynamics is a knowledge of the bacterial cyt. c2 - bound bc1 complex, for which no crystallographic structure is currently available. Even the best resolved crystal structure of Rba. sphaeroides bc1 complex does not include a bound cyt. c2.24 This gap in structural information has motivated docking studies of the Rba. capsulatus cyt. c2 - bc1 complex,25 co-crystallization of cyt. c2 - RC complex,16 and simulations of electrostatic properties26 and the dynamics of water molecules therein.27 In the absence of experimental data our computational model provides a valuable means to achieve a comprehensive description of cyt. c2 - bc1 complex recognition, binding and unbinding. The study inspires similar investigations for functionally similar, yet structurally disparate, single electron transport complexes such as cytochrome c - RC, cytochrome c - cytochrome c oxidase and plastocyanin-cytochrome f complexes.
Methods
Computational protocols for modeling and simulation of the cyt. c2 - bound bc1 complex are outlined in this section. First, we outline the rigid-body conformational search protocols for docking cyt. c2 onto the cyt. c1 subunit of the bc1 complex. We then outline the MD simulation procedures that were used to refine the docked model further and to characterize the dynamical structure of the cyt. c2 - cyt. c1 interface via calculations of its contact area, surface fluctuation, water content, interaction energy, and dissociation constant. Finally, we outline how steered MD simulations were employed to capture the millisecond-scale processes of cyt. c2 binding/unbinding. More detailed descriptions of the simulation protocols adopted for the present study are provided in Section S1 of Supplementary Information (SI).
Protein-protein docking
The docking program DOT 2.028 was employed to construct models of the cyt. c2 - bound bc1 complex. DOT performs a systematic translational and rotational search of a rigid body about another one. Within our conformational search, the bc1 complex (PDBID: 2QJY24) was held stationary while cyt. c2 (PDBID: 1L9B16) was allowed to move. Altogether, 382 billion configurations were tested to obtain an initial set of the 2000 most optimally docked cyt. c2 conformations. Subsequently, following a cycle of re-scoring, based on electrostatic and solvation potentials, the docked cyt. c2 - bc1 complex model with the closest inter-heme proximity and most favorable interaction energy was chosen for further optimization and characterization through MD simulations.
Modeling and molecular dynamics simulation
The Membrane Builder29–31 tool of CHARMM-GUI (http://www.charmm-gui.org)32,33 was employed to embed the optimally docked cyt. c2 - bc1 complex within a POPC membrane, to build a water box around the membrane, and to add ions for neutralizing the system. The fully solvated and ionized system contained 0.5 million atoms. An identical modeling protocol was followed to prepare four systems with all possible redox states of the cyt. c2 and cyt. c1 hemes, referred to as (pre-electron transfer, pre-ET), and (post-electron transfer, post-ET); superindices O and R imply oxidized and reduced states of the respective heme groups. Also, two isolated cyt. c2 in the oxidized and reduced state, denoted as and , were solvated and ionized. Each of the six systems were simulated for 150 ns with NAMD 2.1134 following protocols detailed in SI. All simulations carried out for this study are listed in Table S1.
Standard CHARMM2735 and CHARMM3636 parameters were employed for proteins and lipids, respectively. Fe2S2 cluster and hemes topologies and parameters were taken from Autenrieth et al.37 The topology and parameters of lysine and tetramethylammonium, available in CHARMM27, were employed to represent trimethylated lysine of cyt. c (M3Lys). All structural analysis of the MD simulations were performed with VMD,38 as detailed in the SI Methods.
Steered MD simulations
To induce undocking of cyt. c2 from the bc1 complex we performed a set of ten 50-ns steered MD (SMD) simulations39–41 for the pre- and post-ET states employing distance-based collective variables between center of masses of cyt. c1 of bc1 complex and cyt. c2. SMD simulations were necessary, as the timescale of spontaneous cyt. c2 unbinding is beyond the reach of atomistic MD simulations. The entire study involved a simulation time of 150 ns × 6 for MD calculations and of 50 ns × 10 for SMD calculations, altogether 1.4 µs.
Results
In the following, first, structural details of the docked cyt. c2 - bc1 complex model are reported. Next, the model is refined using MD simulations for four different heme redox states that are encountered during the membrane-wide cyt. c2 transport. Side-chain conformations and solvent dynamics at the cyt. c2 - cyt. c1 interface are monitored in response to variations of the heme redox states. Finally, SMD simulations were performed to investigate the energetically favorable docking and undocking pathways of cyt. c2.
Rigid-body docking of the cyt. c2 to bc1 complex reveals first details of the pre-ET binding interface
First, some salient features of the cyt. c2 - cyt. c1 complex are reported (summarized in Table S2). The binding interface is characterized by electrostatic interactions, of magnitude −21.7 kcal/mol, between positively charged residues of cyt. c2 and negatively charged residues of cyt. c1 (Fig. 2a). The contact area of the optimal cyt. c2 - cyt. c1 interface is found to be 956 Å2. This area is smaller than a typical protein-protein interface area (~1600 ± 400 Å2),42 but similar to the areas seen in homologous electron-transfer complexes in yeast such as 880 Å2 and 932 Å2 for the cyt. c - cyt. c1 complex in Saccharomyces cerevisiae in different redox states.9,10 Also, the contact area of the optimal cyt. c2 - cyt. c1 complex remains in the range of those from functionally related, yet structurally dissimilar, electron-transfer complexes with areas of 1270 Å2 for the cyt. c2 - RC complex in Rba. sphaeroides,43 or 1200 Å2 for the plastocyanin-cytochrome f complex in Phormidium laminosum.44 Altogether, the optimal cyt. c2 - bc1 complex, characterized by a high docking score, complementary binding surfaces, and a contact area comparable with areas of relevant crystallographic structures, should provide a satisfactory starting point for MD studies to be described now.
Figure 2. The cyt. c2 - bc1 complex interface in the pre-ET state.

(a) Complementarity of cyt. c1 (bottom) and cyt. c2 (top) surfaces. The two surfaces exhibit complementary outer half-rings of Glu and Asp (in cyt. c1) and of Lys and Arg (in cyt. c2) encasing an inner cluster of polar and hydrophobic residues. The outer half-rings attract each other into a fixed azimuthal orientation; the inner side groups add to the adhesion between cyt. c2 and cyt. c1 and provide an environment around the two heme groups that is conducive to electron transfer. The reduced cyt. c1 heme is colored pink, the oxidized cyt. c2 heme, cyan, the positively charged residues, blue, the negatively charged residues, red, the polar residues, green, and the non-polar residues, white. Residues shown in solid surfaces are selected based on their interface interactions as presented in Table 1. (b) Interface contact area of the cyt. c2 - cyt. c1 interface in redox states and . While this area for the former, pre-ET, state on an average increases to 1200 c2 over 150 ns of MD, the area of the latter, post-ET, state initially decreases and plateaus around 800 c2. Inset: Contact area distribution over the MD trajectory showing that the area of (blue) is larger than the area of (light-blue), which is larger than the area of (orange), and which is larger than the area of (red). Structures were stored every ps to construct an ensemble of 1.5 × 10⁵ snapshots that are binned to obtain the distribution of physical properties of interest. (c) Interaction energy at the cyt. c2 - cyt. c1 complex. The increase in contact area of the interface in the pre-ET state is accompanied by a stronger cyt. c2 - cyt. c1 interaction, implying relaxation of the docked model into an energy minimum; the post-ET cyt. c2 - cyt. c1 interface exhibits interactions that are attenuated by 20–30 kcal/mol.
MD simulation suggests a stable and functional, yet fuzzy complex
We carried out an MD simulation of the optimal cyt. c2 - bc1 complex in the redox state , as described in SI Methods. The complex remained stable and exhibited a close (8.5 Å edge-edge) distance between the cyt. c2 and cyt. c1 heme groups, but nevertheless exhibited a fuzzy geometry characterized through an ensemble of conformations as seen in the scatter plot shown in Fig. 1b. The majority of these conformations enable fast cyt. c1 → cyt. c2 electron transfer, i.e., can be considered functional single-electron transfer complexes. In light of the observation of a fuzzy, namely conformationally distributed, functional complex, rather than a functional complex with a sharp distribution, we will characterize in the following sections the interface properties of the complex, namely, area of contact, dissociation constant, spacial arrangement and interaction strength of nonbonded residues, water population, and heme-heme distance in terms of a distribution, and not just a single numerical value.
MD simulation enhances binding interface contact
In the case of pre-ET state, the contact area of the cyt. c2 - cyt. c1 interface increased from 956 Å2 to 1256 Å2 over the first 5 – 10 ns of MD simulation, after which time the area typically stabilized at this mean value, fluctuating with deviations of ±198 Å2 (Fig. 2b). A similar increase in contact area relative to the initial structure was reported in MD simulations of yeast cyt. c - cyt. c1, in which case the area increased from 880 to 1247–1555 Å2 in 3 – 5 ns.19 An increase in binding contact area during initial MD equilibration indicates a relaxation of the complementary binding partners at the interface (Fig. 2c), as well as an onset of dynamic interactions that are not captured by a stationary docked model. As discussed below, dynamic adhesion, which is not accounted for in the initial docked model, adds not only to the predicted binding strength of the cyt. c2 - bc1 complex, but reveals also a significant correlation between the motion of cyt. c2 and of the iron-sulfur protein. Regardless, for now it is noted that the MD simulated cyt. c2 - bc1 complex contact area of 1256±198 Å2 in Rba. sphaeroides is in good agreement with its yeast counterpart (1381±163 Å2).19
Electrostatic and hydrophobic interactions stabilize the binding interfaces of , and
A list of interactions stabilizing the cyt. c2 - cyt. c1 interface is provided in Table 1 and Table S3. The presented interactions have been determined from MD simulations of four redox states of the cyt. c2 - cyt. c1 complex, namely (pre-ET), , and (post-ET) (see Table S1).
Table 1. Interfacial interaction energies.
Long-range (charged-charged), mid-range (charged-polar, charged-nonpolar, polar-polar) and short-range (polar-nonpolar, nonpolar-nonpolar) interaction energies between key residues at the cyt. c2 - cyt. c1 interface. Energies are computed for pre- and post-ET states, employing a modified generalized Born (GB) model45 with structures saved every picosecond from the final 100 ns of the MD simulations. The long-range interactions weaken in going from to . Energy differences between the two redox states are highest for long-range electrostatic interactions, medium for mid-range interactions, involving polar residues, and smallest for short-range interactions involving non-polar residues.
| (a) Long-range | |||
|---|---|---|---|
|
| |||
| cyt. c2 - cyt. c1 | Interaction energy (Kcal/mol) | ||
|
| |||
|
|
|
||
|
| |||
| R32 - E141 | −27.03±4.34 | −5.26±2.16 | |
| R32 - E147 | −1.47±0.52 | 0.00±0.14 | |
| K35 - E150 | −11.42±3.12 | −10.07±3.31 | |
| K35 - D152 | −18.36±3.68 | −1.20±0.54 | |
| K55 - D152 | −7.70±2.15 | −4.05±2.72 | |
| K95 - D80 | −21.88±4.92 | −4.73±2.98 | |
| K97 - E95 | −20.68±3.47 | −3.50±2.45 | |
| K99 - E95 | −8.25±2.27 | −3.12±2.41 | |
| K103 - E34 | −16.60±3.76 | −11.95±4.02 | |
| K105 - E34 | −20.49±4.99 | −9.82±4.12 | |
| (b) Mid-range | ||
|---|---|---|
|
| ||
| Q14 - D191 | −4.17±1.68 | −2.24±1.13 |
| Q14 - D192 | −2.30±0.92 | −1.58±0.72 |
| R32 - P142 | −1.50±0.17 | 0.00±0.14 |
| K35 - P151 | −1.69±0.50 | −0.86±0.21 |
| T36 - Y155 | −2.45±0.63 | −1.20±0.53 |
| F54 - D152 | −1.42±0.32 | −0.53±0.34 |
| K97 - A93 | −1.75±0.42 | −0.45±0.31 |
| T101 - C39 | −2.26±0.35 | −1.15±0.45 |
| (c) Short-range | ||
|---|---|---|
|
| ||
| Q14 - M190 | −2.88±0.32 | −1.37±0.57 |
| T17 - M190 | −2.71±0.35 | −2.05±0.72 |
| T101 - A38 | −3.85±0.67 | −2.39±1.10 |
| F102 - M190 | −1.56±0.23 | −1.23±0.27 |
| F102 - L193 | −3.22±0.23 | −3.04±0.56 |
| *K35 - F154 | −1.45±0.25 | −1.43±0.36 |
denotes cation-π interactions.
To identify the interface stabilizing interactions, we consider the MD simulation of the pre-ET state first, as this is, functionally speaking, the initial state when an oxidized cyt. c2 approaches a bc1 complex with a reduced cyt. c1. This state permits electron transfer from bc1 complex to cyt. c2 and is, thus, most relevant for cyt. c2 - cyt. c1 docking.
The cyt. c2 - cyt. c1 docking surfaces of the energetically most favorable pre-ET complex are illustrated and characterized in Fig. 2a. The surfaces exhibit a clear complementarity, namely a half-ring peripheral arrangement of oppositely charged residues that enclose polar and hydrophobic residues within a tight core; it is noteworthy that the cyt. c2 and cyt. c1 heme groups are encased within these hydrophobic cores. The adhesion interactions can be classified into long-range electrostatic, medium-range charge-polar and polar-polar, and short-range van der Waals interactions. In addition, our simulations suggest the presence of cation-π interactions at the docking interface.
The long-range interactions between basic residues of the cyt. c2 half-ring (residues R32, K35, K55, K95, K97, K99, K103, and K105) and complementary acidic side chains of the cyt. c1 half-ring (residue E141, E147, E150, D152, D80, E95, and E34) are seen in the MD simulation to exhibit more dynamic adjustment than the amino acids involved in intermediate or short-range interactions. Listed in Table S3, distances between the complementary charged residues exhibit a significantly larger variance than those of the hydrophobic residues. The simulation reveals also that water molecules at the cyt. c2 - cyt. c1 interface mediate a majority of the electrostatic interactions, thus, rendering these interactions dynamic. One can notice that these dynamical electrostatic interactions remain strong even at cyt. c2 distances of 10–12 Å from the bc1 complex surface and, thereby, achieve long-distance recognition of the half ring patterns for cyt. c2 binding. In contrast to the charged residues, the polar and the hydrophobic residues (residue T17, T101, F102 of cyt. c2 and A38, M190, L193 of cyt. c1) avoid water, are tightly packed via short-range interactions and, thereby, exhibit reduced fluctuations. The role of water molecules mediating interfacial electrostatics will be elaborated further in Discussion.
Short-range interactions between the hydrophobic residues of cyt. c2 and cyt. c1 in the immediate neighborhood of their heme groups allow the two hemes to get into close proximity of each other. As listed in Table S4, the edge-to-edge distance between the two hemes derived from MD simulation of the pre-ET complex is 8.48 ± 0.21 Å, which is in good agreement with the distance of 9.1 Å seen in the yeast crystal structure of the cyt. c2 - bc1 complex.14 The distance of closest approach between carbon atoms of the cyt. c2 and cyt. c1 hemes is found in our simulation to be 4.06 ± 0.76 Å (Fig. 3a); both distances discussed here are marginally larger for the post-ET state . The short inter-heme spacing is too small to allow water between the heme edges and permits direct heme-to-heme electron transfer from bc1 complex to cyt. c2.46 Such direct transfer path is in sharp contrast to amino acid-mediated electron transfer suggested for the cyt. c2 - RC complex.47,48 A distribution of heme-heme geometries is observed in Fig. 1b indicating clearly that for comparable edge-to-edge distances there exists an ensemble of multiple protein and heme conformations each of which are perfectly capable of direct electron transfer.
Figure 3. Redox state dependence of cyt. c2 - bc1 complex adhesion dynamics.

(a) Interfacial residues of the cyt. c2 - bc1 complex are colored black to white based on the magnitude of backbone fluctuations relative to the initial structure, seen over the course of an MD simulation. The left figure shows that the bc1 complex surface is less flexible than the cyt. c2 surface. The inter-heme distances, as noted in Table S4, are labeled. A top-down view of the bc1 complex on the right shows that its binding surface exhibits structured water. Presented is the water molecule density at a value of 50%. The water molecule density agrees very closely with that reported10 for the yeast bc1 complex (inset) supporting the accuracy of our docked model of the complex. (b) Positional variance of water-mediated electrostatically interacting residues as listed in Table 1a shows an increase in fluctuation for the cyt. c2 surface residues (green) and a decrease for the bc1 complex residues (purple) upon docking in redox state . Residues are labeled according to the order in Table 1a. (c) Effect of cyt. c1 and cyt. c2 redox states on dynamical properties of the adhesion complex. Presented is the positional variance of cyt. c1 (upper panel) and cyt. c2 (lower panel). The variance of the interface residues gradually increases from (blue) to (light-blue) to (orange) to (red). However, for a given redox state, variances in cyt. c2 are greater than those in cyt. c1. The strongest variance mismatch arises in changing the redox state to , namely for the redox state arising after electron transfer, when cyt. c2 is supposed to separate from the bc1 complex.
Another striking feature of the adhesion between cyt. c2 and cyt. c1 that all the four MD simulations (Table S1) reveal is a mobility-mismatch between the complementary charged residues. As illustrated in Fig. 3a–b, positive residues on the surface of cyt. c2 exhibit larger positional variance and, thereby, a fuzzier conformational distribution than the negative ones contributed by cyt. c1. As a result, the cyt. c1 surface is found to accommodate a substantial number of structured water molecules at the interface, as has also been observed crystallographically for yeast cyt. c1 (Fig. 3a inset).10 The mobility mismatch, due to binding-induced changes in the stability of cyt. c2 and cyt. c1 docking faces, is discussed further below.
All the four MD simulations indicate further a cation-π interaction between residues K35 of cyt. c2 and F154 of cyt. c1, consistent with crystallographic findings in yeast.10 However, given the limitations of available force fields in accurately capturing such interactions, the energies are underestimated typically by a factor of two relative to values calculated from density functional theory for an isolated cation-π bond.49 The values calculated here, even though underestimated, can still be qualitatively reconciled with existing knowledge on the role of cation-π interactions at the cyt. c2 - cyt. c1 interface, because, (a) isolated cation-π interactions are not the best estimate of their contribution in a real protein-protein interface and, (b) indeed, calorimetric experiments have revealed considerably weaker cation-π interactions of ~1 kcal/mol at the cyt. c2 - RC interface, indicating the lability of these interactions.20 Therefore, as argued in Section S2 of SI, it seems advisable to defer discussion of the role of cation-π interactions for docking cyt. c2 to the bc1 complex until further quantitative experimental data are available.
Finally, we note in Section S3 of SI some of the interface stabilizing residues on the bc1 complex that are identified during the MD simulation of the pre-ET state, such as E141, E34, D191, D192, and D152. These residues remain conserved in other photosynthetic and respiratory life forms including Rba. capsulatus, Chlamydomonas reinhardtii and Bos taurus.24 Such evolutionary evidence further supports the interaction analysis of Table 1 in demonstrating the essential role of interface-binding residues predicted from our docking analysis and MD simulations.
Redox state control of interfacial interactions
Conformational changes at the cyt. c2 - cyt. c1 docking interface were further analyzed on the basis of the MD simulations (Table S1) of the four possible redox states of the complex, namely (pre-ET), , and (post-ET). As suggested by the interaction energy data in Tables 1, S3, and illustrated in Fig. 4a, changes to cyt. c2 - cyt. c1 adhesion in the pre-ET state result from cyt. c1 → cyt. c2 electron transfer, due to changes of the electrostatic interactions between cyt. c2 and the bc1 complex. The electrostatic interactions are seen to decrease in going from to . Coincidentally, the first three redox states, and , have been crystallographically isolated for yeast,10 confirming their higher stability relative to the fourth, post-ET state, , which, indeed, should be functionally unstable as cyt. c2 needs to separate from the bc1 complex after electron transfer. Consistent with the decrease in interfacial adhesion, the contact area, as seen in our simulations, strongly decreases from the pre- to the post-ET states (Fig. 2b inset). Structural details underlying the weakness of cyt. c2 - cyt. c1 binding (Table S3) after electron transfer from cyt. c1 to cyt. c2 are further examined in Discussion.
Figure 4. Cyt. c2 - cyt. c1 binding interface before and after electron transfer.

(a) A loss of electrostatic interaction between positive cyt. c2 residues (blue) and negative (red) cyt. c1 residues can be inferred from the looser packing of the positive and negative residues. (b) Distribution of water molecules in the cyt. c2 - cyt. c1 interface. The number of water molecules increases in going from the pre-ET to the post-ET state. Inset: Occupancy of structured water is considerably less in the post-ET state than in the pre-ET state as also illustrated in Fig. 3a (inset). (c) Scatter diagram showing distributions of cyt. c2 conformations on the bc1 complex surface for the pre- and post-ET complex. The electron transfer renders the cyt. c2 - cyt. c1 interface less adhesive and more fuzzy as can be recognized by a larger interface-opening and stronger bc1 complex scatter in the post-ET complex (see black ovals and black arrows). As in case of Fig. 1b, 10,000 structures are saved every 10 ps from the final 100 ns of the MD simulation (see Table S1) of the pre- and post-ET complex and superimposed here.
Note, represents a state where the oxidized cyt. c2 has arrived at the bc1 complex surface, but the electron from quinol is yet to be transferred into the cyt. c1 - heme. The cyt. c1 surface in is therefore less negatively charged than that in . Consequently, the cyt. c2 - cyt. c1 binding interactions in are weaker than in those . Nonetheless, these interactions are still higher than those in and , and sustains an adhesive cyt. c2 - cyt. c1 interface prior to the arrival of the electron at the cyt. c1 - heme. Thus, formation of the complex supports a cyt. c1 → cyt. c2 electron transfer within the photosynthetic energy conversion scheme of Fig. S3. In contrast, represents a state, where following electron transfer and unbinding from the oxidized bc1 complex, the reduced cyt. c2 binds to a second reduced bc1 complex instead of reaching the electron deficient RC protein. This mis-targeted state does not support the cyt. c1 → cyt. c2 electron transfer and is expected to reduce the photosynthetic energy conversion efficiency of the scheme in Fig. S3. Our computations reveal that the electrostatic interactions in , though adhesive, are one of the weakest of the four redox states, undermining thereby, the in vitro feasibility of this complex. A comparison of cyt. c2 - cyt. c1 interactions in (Table S2), with the cyt. c2 - RC interactions from ref.,27 together with data from steady state kinetics studies,11,50,51 further demonstrates that formation of the former complex is less thermodynamically favorable. Thus, the population of the complex is naturally screened during the photosynthetic energy conversion cycle by formation of the more functionally relevant - RC complex.
Three key observations pertaining to the unbinding of cyt. c2 from the bc1 complex are made from the MD simulations. (i) The decrease in adhesion between cyt. c2 and bc1 complex in going from the pre- to the post-ET states was seen to be accompanied by an enhancement of cyt. c2 and cyt. c1 surface fluctuations (Fig. 3c) yielding, thus, even fuzzier interface conformations than those of Fig. 1b (Fig. 4c). (ii) The cyt. c2 fluctuations remain consistently higher than those of cyt. c1 in all four redox states, thus, maintaining a mobility-mismatch both before and after the electron transfer. In the post-ET complex, which is prone to unbinding, both cyt. c2 and cyt. c1 surfaces are found to exhibit maximum surface fluctuations and still the highest mismatch (Fig. 3c). (iii) The loss of interfacial adhesion of the post-ET complex is followed by an increase in the number of water molecules at the binding interface (Fig. 4b). Pronounced surface fluctuation in this complex lowers the density of structured water at the interface (Fig. 4b inset vs. Fig. 3a), further adding to interface mobility and, thereby, inducing dissociation of the complex. In fact, as discussed in Section S4, the interfacial water undergoes an order-disorder transition from a structured to an unstructured state in going from the pre- to the post-ET states.
The variation in interface interaction energies, in response to changes in the heme redox states of cyt. c2 and cyt. c1, strongly depends on the partial charge of the complementary binding partners. One can see from Table 1c that the short-range van der Waals interactions due to hydrophobic residues vary only marginally with electron transfer; this variation is in contrast to the variations seen in the long-range electrostatic interactions that are due to charged residues and heme groups and, actually, give rise to large energy difference between four possible redox states. Illustrated in Fig. S2, the hydrophobic residues encasing the heme groups are similarly oriented before and after the inter-heme electron transfer, i.e., in states and . This independence of the short-range interactions on the redox state has also been observed in three cyt. c - cyt. c1 complexes for yeast (PDBID: 1KYO, 3CX5, and 1YEA). In these systems, the hydrophobic groups in the immediate neighborhood of the heme moieties constitute a “minimal core” of short-range interactions that permits the close heme-heme spacing necessary for direct electron transfer.10 The feasibility of the close hydrophobic minimal core described is now demonstrated for all four possible redox states of the Rba. sphaeroides cyt. c2 - bc1 complex.
Steered MD simulations reveal pathways of cyt. c2 binding/unbinding
Ten independent 50-ns SMD simulations for the two key redox states (listed in Table S1) revealed similarities and differences in the unbinding of the cyt. c2 - bc1 complex in its pre- and post-ET states. Under the assumption of microscopic reversibility, the unbinding of cyt. c2 sheds light also on the pathway(s) of binding.
The results of our unbinding simulations shown in Fig. 5 are consistent with the equilibrium simulation results shown in Fig. 4a and Table 1a; the majority of the long-range electrostatic interactions are attractive in the pre-ET state, covered in Fig. 5a, and, indeed, these interactions together with the van der Waals interactions are seen to cohesively stabilize the binding interface for the first 15 ns of steering that attempts to pull the complex apart. In the post-ET state (Fig. 5b), the long-range interactions are relatively weak, and only the short-range van der Waals contacts contribute to interface adhesion, holding the complex together for 15 ns despite the application of pulling forces. In fact, the simulations clearly show that complementary charged, polar and hydrophobic residues remain strongly correlated across the interface (Fig. S4a in SI); only the polar and hydrophobic residues retain such correlation after electron transfer (Fig. S4b), further confirming the loss of electrostatic interactions after electron transfer. The detailed correlation patterns are derived employing the dynamical network analysis52 of VMD.38
Figure 5. Analysis of steered MD simulations.

Energy profile showing changes in the average interfacial van der Waals and electrostatic interactions during SMD simulations pulling apart the (a) and (b) complexes. Over the first 10–15 ns electrostatic interactions contribute more to adhesion in case of , while van der Waals interactions dominate in . Both interactions decrease with subsequent separation over the next 35–40 ns. Inset: Inter-residue interaction energies showing cyt. c2 undocking is induced by the switching-off of the K99-E95 interactions (lysine-switch), which generally precedes destabilization of the hydrophobic interactions (QT14-M190 shown), ultimately followed by breaking of the water-mediated electrostatic interactions (K32-E41 shown). For simplicity, only select interactions are presented; more detailed results are provided in Fig. S3. (c) Cyt. c2 undocking from bc1 complex at t = 0, t = 20 ns and t = 50 ns showing most of the key interface stabilizing interactions subside within the first 20 ns of SMD simulations, after which cyt. c2 unbinds from the bc1 complex.
Nonequilibrium work profiles derived from the SMD simulations of the pre- and post-ET complexes, presented in Fig. S5 and presented in Section S5, are consistent with the energy changes shown in Fig. 5, demonstrating that the initial phase of unbinding involves mainly work to overcome strong van der Waals and/or electrostatic interactions; this work subsides later on in the trajectory. As detailed in Section S6, unbinding of cyt. c from the bc1 complex in yeast follows a similar work profile, suggesting a binding/unbinding pathway comparable to that of Rba. sphaeroides. Given that the cyt. c-bound bc1 complex is found across a broad range of eukaryotes, its agreement with the binding/unbinding pathways derived from our computationally docked model of cyt. c2 -bound bc1 complex argues for the biological relevance of the present findings.
Finally we note three key observations, labeled below (i), (ii) and (iii), made during the SMD simulations that directly relate to the regulation of the bc1 complex binding/unbinding of cyt. c2, and cyt. c1 → cyt. c2 through the electron transfer process. (i) When steering apart cyt. c2 in the complex, first, an intermediate scale electrostatic interaction between K99 and E95, which is among the weakest charge-charge interactions listed in Table 1a, is lost (Fig. 5a inset). The van der Waals contact disrupts after 10 ns and, finally, the remaining long-range electrostatic interactions, which are stronger than the van der Waals interactions, unbind after 15 ns. In Discussion we examine further how this trade-off between long- and short-range interactions accompanies electron transfer.
(ii) Independent SMD simulations, performed with the same steering protocol, proceeded via multiple equally likely pathways that are characterized by similar energy profiles, but differ by the sequence of unbinding between the electrostatic pairs (Fig. S8). Assuming microscopic reversibility, the involvement of multiple unbinding pathways suggests the existence of multiple binding pathways of cyt. c2; each pathway is equally favorable, but is mediated by a different sequence of binding between the charged residues. The conclusion is in line with EPR measurements that likewise suggest the existence of a cloud of multiple equally bindable cyt. c2 domains in the vicinity of a reduced cyt. c1 surface.17
(iii) The minimal core that encases the heme groups is not necessarily limited to the perfectly docked cyt. c2 conformation(s); rather, the relevant hydrophobic residues begin to interact already when the hemes of cyt. c2 and cyt. c1 are 12–13 Å apart (Fig. S6). Furthermore, unlike equilibrium configurations where minimal core interactions are nearly redox-independent (see Table 1c), in the SMD simulations minimal core contacts in are found to be consistently more separated than those in (Fig. S7), a characteristic that leverages to avoid reverse electron transfer from the reduced cyt. c2 back to bc1 complex.
Thermodynamics of cyt. c2 binding/unbinding
Dissociation constant (Kd) and binding free energy of the MD simulated structures of the pre- and post-ET complexes were computed using a bioinformatics-oriented approach on the CRYSTAL STRUCTURE Kd SERVER from the SEQMOL suite (biochemlabsolutions.com). The software employs scoring functions involving experimentally determined binding parameters, accumulated over hundreds of complexes reported in the PDB, and the input structure to measure the binding free energy and interface dissociation constant. Fifty structures, saved every ns over the final 50 ns of MD trajectories involving the pre- and post-ET complexes, were separately processed on the server to compute the corresponding Kd. The average Kd of the pre- and post-ET complexes were found to be 0.03 µM and 0.11 µM respectively, in excellent agreement with 0.06 µM and 0.22 µM obtained from plasmon waveguide resonance spectroscopy experiments of the cyt. c2 - cyt. c1 complex.53 Recovery of such realistic Kd values for the cyt. c2 bound bc1 complex of Rba. sphaeroides further reinforces confidence in the docked model presented here.
Note, the experimentally determined Kd values for the post-ET complexes range from 0.11 µM up to 3.4 µM.53 The MD simulations have converged to a relatively tightly bound state of these complexes that exhibit smaller Kd values; the more weakly bound, 3.4 µM, complexes remain obscure to the MD simulations. Determination of only the tight post-ET complexes is expected due to the limited timescale (150 ns) of the MD simulations. Within this timescale the simulated post-ET complex relaxes into a state which is indeed less stable than the pre-ET complex and, thus, prone to cyt. c2 unbinding (Fig. 4a); however, this state fails to capture the much weaker cyt. c2 - cyt. c1 interactions of the 3.4 µM complexes that is absolutely necessary to unbind cyt. c2. Unlike MD, such weak interactions are captured in the SMD simulations (Fig. 5c: 50 ns), which indeed features complexes with computed Kd values in the range of 3.1 – 3.4 µM; these complexes are collected over the final 5 ns of each of the five 50-ns SMD simulations.
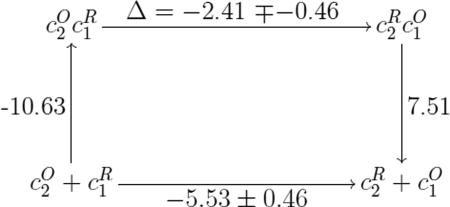
The simulated and observed Kd values together with the known redox potentials cyt. c2 - bc1 complex contain information on the binding and redox energetics of this redox partner system. This system can be described through four states, namely and , defined above, and , and , which correspond to the same redox states, but for separated cyt. c2 and bc1 complex. The four states form a thermodynamic cycle presented along with the respective energy values, in units of kcal/mol, in Scheme (1). If one defines the energy of redox state as the (zero) reference energy, then the energy of redox state is in the range −5.07 to −5.99 kcal/mol (see lower arm of Scheme (1)). This range of values is deduced from the well-known redox potential energy differences of −220 to −260 mV for the reaction between cyt. c2 and its typical single-electron redox partners like the bc1 complex.54 The energy of state is calculated from the association reaction to be −10.63 kcal/mol. Labeled on the left arm of Scheme (1), the latter energy is computed employing the relationship E = RT ln(Kd), where Kd for is 0.03 µM. If one assigned to electron transfer (labeled on the upper arm of Scheme (1)) an energy Δ, then the energy of state is −10.63 kcal/mol + Δ. Finally, the energy difference between states and (labeled on the right arm of Scheme (1)) is given by the Kd value of 3.4 µM53 for the disociation reaction; the numerical value translates into an energy of E = RT ln(Kd) = 7.51 kcal/mol. Note, even though our MD simulation has delivered complexes with Kd values of ~0.11 µM, majority of the post-ET population is characterized by 3-fold weaker complexes with Kd values of ~3.4 µM,53 which is also captured in SMD. Consequently, dissociation energy of the weaker complexes is considered for computing the energetics of electron transfer.
The thermodynamic cycle characteristics summarized above and in Scheme (1) lead to an interesting implication about the biological design of the cyt. c2 - bc1 complex redox partner system. Clearly, electron transfer is energetically favorable by −5.5 ± 0.45 kcal/mol. According to the thermodynamic cycle the binding, electron transfer and unbinding steps consuming an energy of −10.63 kcal/mol + Δ + 7.51 kcal/mol should add up to the redox energy −5.53 ± 0.46 kcal/mol. This implies for Δ small values in the range of −2.41 ± 0.46 kcal/mol. One can conclude from the thermodynamic cycle then an important, amazingly optimal, strategy of the cyt. c2 - bc1 complex system, namely to invest almost 60 % of the negative (−5.53 ± 0.46 kcal/mol) energy into recognition and binding of the partners, rather than electron transfer. Clearly, the underlying strategy to use redox energy for partner recognition and binding is optimal for the cell, in particular, as the role of cyt. c2 in cellular bioenergetics is often rate limiting.9,10
 |
(1) |
Summarizing the key results, in agreement with prior experiments our simulated model of the cyt. c2 bound bc1 complex reveals dynamic electrostatic interactions, a tightly packed hydrophobic minimal core, close inter-heme distances and mobility mismatch at the binding interface. We have also now established that the strong influence of the electrostatic and hydrophobic interactions is not limited to the docked state; rather these interactions play a major role in interface recognition when both the cyt. c2 and bc1 complex are out of their docked conformations. The cyt. c2 binding is highly targeted, driven by a half-ring pattern of complementary charged residues on the bc1 complex surface, yet multiple equally-likely bc1 complex approach pathways exist for cyt. c2. Consequently, there is no single bound state, but an ensemble of bound states characterized by µM-scale dissociation constants and satisfying the crystallographically determined structural features. Lastly, we discovered that electron transfer from cyt. c1 → cyt. c2 disrupts interfacial electrostatic interactions and enhances interface mobility to ultimately induce the unbinding of cyt. c2.
Discussion
In this section, functional and mechanistic inferences are drawn from the above results of this study. First, we discuss the role of long-range electrostatic interactions in mediating cyt. c2 recognition and binding to the bc1 complex. Second, changes in the conformation and mobility of charged residues at the interface in response to cyt. c1 → cyt. c2 electron transfer are discussed to elucidate how dynamics at the side group level induce interface-wide events, such as cyt. c2 unbinding. Third, it is explained how electron transfer is promoted by hydrophobic interactions between the non-polar residues at the interface. Fourth, dynamical correlation between cyt. c2 and the ISP is explored to discuss the direct role of cyt. c2 unbinding in quinol oxidation. Finally, discussions across the above four facets are tied into a logical order to provide a detailed picture of cyt. c2 recognition, binding and unbinding mechanism. This mechanism portrays how the architecture of cyt. c2 is leveraged in photosynthetic and respiratory pathways to enable timely single-electron transport between the integral membrane proteins.
Well-defined, dynamic cyt. c2 docking surface
As illustrated in Fig. 2, the electrostatic interactions at the cyt. c2 - cyt. c1 interface stem from residues that form complementary half-rings surrounding in each partner weakly polar and non-polar residues. Five oppositely charged interaction pairs are identified in the half-rings (Table 1a). The interaction pairs include contributions from amino acids K95 to K106 in cyt. c2, which have been shown by single-point mutation experiments to be key for the binding of cyt. c2 to the bc1 complex in Rba. sphaeroides;13 dipolar interactions involving Y155, reported in Table 1b, have also been demonstrated to be critical in stabilizing the cyt. c2 - bc1 complex interface in Rba. capsulatus.25
A half-ring peripheral arrangement of the interacting partners orients their electric dipoles to a definite azimuthal direction that provides the basis for a well-defined docked state. In contrast, a circular arrangement could have invoked rotationally equivalent and equally feasible binding patterns, thus likely involving heme - heme geometries not suitable for direct electron transfer.46 Besides, undocking of a circular arrangement, rather than a half-ring arrangement, would be energetically more demanding and slow, which might ultimately reduce the overall rate of ATP synthesis as the cyt. c2 - bc1 complex redox reaction is likely rate limiting.55 Furthermore, the half-ring arrangement of charged residues is a common feature among the three electron transfer complexes cyt. c - bc1 complex, cyt. c2 - reaction center, and cyt. c - cyt. c peroxidase.21,22 Thus, the predicted half-ring arrangement of complementary residues, which clearly defines an orderly docking geometry, is expected to be optimal for efficient electron transfer from bc1 complex to cyt. c2.56,57
The electrostatically interacting residues are separated across the docking partners by distances of 7 – 12 Å (Table S3). These distances are comparable to the Debye length of 9.6 Å between single-charged ions at an ionic concentration of 100 mM.58 The distance values suggest the absence of direct salt-bridge interactions between the binding faces of cyt. c2 and cyt. c1. Rather, 1.5 times more interfacial water than found on typical protein-protein interfaces14 renders the water-mediated electrostatic interactions highly dynamic and, thus, cyt. c2 - bc1 complex interface conformationally fuzzy. The dynamics of the interface exhibits conformational freedom described by an ensemble of docked cyt. c2 states (Fig. 1b), all of which allow fast enough electron transfer due to the constraints imposed by the overall half-ring binding pattern and close inter-heme geometries.
Interestingly, water molecules associated with the cyt. c2 side of the interface are less structured than those with the cyt. c1 side. As shown in Figs. 3, 4, the absence of structured water in the vicinity of the cyt. c2 binding surface coincides with a higher mobility of the associated positively charged side chains relative to those of the negative cyt. c1 residues, thereby, resulting in a mobility-mismatch.
Role of mobility mismatch
In order to investigate the role of the mobility mismatch at the cyt. c2 - bc1 complex interface we also carried out an MD simulation of an isolated cyt. c2 to compare the dynamics of its binding surface residues in the docked and undocked states. The new simulation suggests that the positive cyt. c2 residues R32, K35, K55, K95, K97, K99, K103, and K105, which are the electrostatic partners to cyt. c1 in the docked case, in the undocked case form strong intra-cyt. c2 salt bridges with residues D52, E59, D82 and D93. Upon binding of cyt. c2 to the bc1 complex, the intra-cyt. c2 salt bridges are replaced by weaker, water mediated, long-range electrostatic interactions with cyt. c1 residues E141, E147, E150, E152, D80, E95, and E34 (see Table 1). Consequently, cyt. c2 marginally loses stability after binding to the bc1 complex (Figs. S11a and S10) and its surface residues become more mobile (Fig. 3a).
Unlike undocked cyt. c2, undocked cyt. c1 lacks any substantial internal interaction partners for its surface glutamate and aspartate residues. Thus, cyt. c1, upon binding to cyt. c2, gains complementary partners and, thereby, stability (Figs. S11b and S10), as well as decreased surface mobility, explaining the mobility mismatch at the cyt. c2 surface. Subsequently, negatively charged cyt. c1 residues and positively charged cyt. c2 residues orient the dipole moments of the interfacial water molecules (Fig. S12a), with the water-hydrogens pointing towards the bc1 complex surface, promoting hydrogen bond formation between water molecules and the negatively charged residues at the surface. As a result, the hydrogen-bonded water molecules on the bc1 complex surface are found ordered and, therefore, less mobile relative to those in the vicinity of cyt. c2.
The predicted decrease in thermal stability of cyt. c2 upon binding to the bc1 complex, employed here to rationalize the mobility mismatch, is independently supported by microcalorimetric experiments that show the denaturation temperatures of cyt. c to decrease after binding.59 Taken together, our explanation of the mobility mismatch rationalizes crystallographic findings on the surface water accessibility10 with the thermodynamics of binding interface stability, linking two seemingly exclusive experiments.
Finally, the mismatch in mobility of residues at the cyt. c2 and cyt. c1 binding surfaces reflects a key structural element that cyt. c2 employs to redox-selectively bind as well as unbind the bc1 complex. A low extent of mismatch before the electron transfer from cyt. c1 to cyt. c2, shown in Fig. 3c, ensures a µM-scale dissociation constant of the complex; this medium-range protein-protein dissociation constant60 suffices, on the one hand, for adhesive cyt. c2 binding, and on the other hand, facilitates a bc1 complex residence time of ~11 ms, supporting the overall 25 ms turnover time for cyt. c2.8 The ensuing electron transfer is followed by an increase in mobility mismatch at the interface and a 3–10 fold decrease of the dissociation constant which facilitates, in turn, the unbinding of cyt. c2. Conversely, if the mobility mismatch were absent, two situations would have arisen, but neither being sufficient to maintain the optimal rate of cyt. c2 turnover: first, if both surfaces were equally highly mobile and, therefore, unstable after binding, cyt. c2 would have always avoided cyt. c1 binding and subsequent electron transfer; second, if both surfaces became less mobile and, therefore, stabilized after binding, the mobile, water mediated, cyt. c2 - bc1 complex electrostatic interactions would be replaced by direct salt bridges. Purely for dielectric reasons these salt bridges would be 10-fold stronger than water-mediated interactions27 making the bc1 complex residence time of cyt. c2 at least e10-fold longer and, thus, disrupting the overall efficiency of cyt. c2 turnover.
Cyt. c2 unbinding via a redox-dependent lysine-switch
The results of our simulations show that the electrostatic interaction between cyt. c2 and bc1 complex decreases along the redox states to to to (Table 1a). Consequently, the area of contact between cyt. c2 and cyt. c1 follows a similar trend (Fig. 2). Here, we discuss how atomic-scale conformational changes in response to variations in the cyt. c2 or cyt. c1 heme oxidation states affect the electrostatic interaction across the binding interface.
The electrostatic interactions listed in Table 1a, for the most stable bound redox state, , range from −25 to −10 kcal/mol. The interaction between K99 of cyt. c2 and E95 of cyt. c1, though significant, is one of the weakest interface-stabilizing electrostatic interactions. Therefore, on external perturbation, this interaction is expected to be more readily weakened than the other, stronger, interactions (Fig. 5a inset). In fact, such a perturbation to the bound state occurs when the electron is transferred from the bc1 complex to cyt. c2, generating the state, in which the potential on the cyt. c2 heme region becomes more negative (Fig. 6b inset). As a result, the E95-bound K99 lysine becomes attracted towards the carboxylate group of the cyt. c2 heme (Fig. 6b) and switches its salt bridge from E95, stable in the state (Fig. 6a), to a cyt. c2 heme carboxylate in the state (Fig. 6b). Weakening of the K99-E95 interaction opens space for water to intrude into the interface, thereby, facilitating cyt. c2 unbinding (Fig. 4a) through increased fluctuations of the surface residues and the resulting destabilization of the binding interface. The statistical significance of the lysine-switch is established by counting the time intervals in which the K99-E95 bond is formed in the fuzzy pre-ET complex and the time intervals in which a K99-heme carboxylate bond is formed in the post-ET complex (Fig. S14).
Figure 6. Lysine switch in cyt. c2.

Conformations of the K99 and E95 side-chains showing contact (switch on) in the state (a) and no contact (switch off) after electron transfer in the state (b). Insets: Electrostatic potential isosurfaces of magnitude ±10 kT/e in the vicinity of the lysine switch and the heme groups. The polarity of the field about the cyt. c2 and cyt. c1 hemes reverses with electron transfer. This reversal in polarity is visually indicated by the fact that the positive potential, lower left (blue background), in the vicinity of the oxidized cyt. c2 heme (blue licorice) in (a) becomes negative, lower right (red background), after electron transfer when the heme becomes reduced (red licorice) in (b), and vice-versa for the bc1 complex. The electrostatic calculation was performed with a 1 Å grid using APBS.61 (c) Evidence for a lysine switch due to interface residue K84 of yeast cyt. c is also seen in crystal structures, PDBID: 1KYO (CPK representation) and PDBID: 3CX5 (licorice). (d) Histograms showing that while the K99 - E95 distance (upper panel) increases after electron transfer from (blue line) to (red line), the K99-heme carbonyl distance (lower panel) simultaneously decreases.
The switching of lysine is supported by crystal structures that show a strong conformational change in the lysine equivalent to K99 between oxidized and reduced states of yeast cyt. c2 (namely, K84 in 1YKO and 3CX5, and K79 in 1YEA; see Fig. 6). Electrochemical studies of cyt. c in yeast62 further suggest that the lysine(K79)-switch interactions exclude some excess water from the binding interface to bring the bc1 heme closer for a direct electron transfer. A lysine-switch is seen, in MD simulations, to also play a role in stabilizing the cyt. c2 - RC interface.27
Altogether, the decrease in cyt. c2 - cyt. c1 interface stability from pre- to post-ET redox state is explained mainly on the basis of the extent of lysine-switching. Summarized in Table S3, lysine-switching happens the least before the electron transfer, in and , where the K99-E95 bond is present, keeping the interface relatively stable. The extent of switching increases after the electron transfer, in and , where the K99-E95 bond is replaced by the K99-heme carboxyl interaction and where all the dominant interfacial electrostatic interactions are attenuated.
In addition to inducing unbinding of cyt. c2, the lysine-switch can be viewed as a heme redox recognition element. Only an oxidized cyt. c2 with K99 not interacting with the heme will be able to interact with E95 residue of cyt. c1 forming and complexes. In contrast, a heme-carbonyl bound K99 as it exists in reduced cyt. c2, will find it difficult to interact with the E95 of cyt. c1, therefore naturally reducing the population of complexes and .
Role of minimal core for heme-heme electron transfer
Inter-protein electron transfer has been investigated previously in case of a cyt. c2 - RC encounter pair.14,27 A key difference between the cyt. c2 - RC complex and the cyt. c2 - bc1 complex is the electron transfer distance. In the former, an edge-to-edge distance for electron transfer of 14 Å is reached in the docked state;16 in the latter, however, the edge-to-edge distance in the docked state is 9 Å, the shorter distance brought about by the so-called minimal core. Since fast physiological electron transfer is observed for edge-edge distances of up to 14 Å,46 in principle, electron transfer in case of the cyt. c2 - bc1 complex could already occur while cyt. c2 is approaching its fully docked state. One may then ask whether the bc1 complex forms multiple productive complexes with cyt. c2 with inter-heme distances of > 9 Å or whether a mechanism exists that prevents less efficient complexes and favors formation of a narrowly defined single complex. Our simulations addressed the questions as follows.
SMD simulations of the pre-ET complex, , show that the hydrophobic minimal core which encases the heme groups, can remain intact for the first 10 ns of steering when interheme distance increases from 10 to 12–13 Å (Fig. S6). Consequently, it is possible that electron transfer is still mediated via the minimal core even if the cyt. c2 heme is out of its equilibrium conformation; also, the dissociation constant of the cyt. c2 - bc1 complex in the pre-ET state remains between 0.03 µM and 0.06 µM (close to experimental numbers) when the inter-heme distance is increased up to 13 Å. The minimal core itself is rigid and forms only after half-ring oriented electrostatic interactions get cyt. c2 close to the bc1 complex, ensuring orientational restriction between the heme moieties. Thus, it seems that electron transfer can occur only for an ensemble of docked states that exhibit a well-defined minimal core which keeps the hemes within proximity and orientation. However, multiple binding pathways in regard to direction of approach or to binding sequence (see Fig. S8) are permitted such that a rather broad docking funnel can guide the system to a heme-heme conformation suitable for efficient electron transfer.
Inferences on binding/unbinding mechanisms
The results of our MD and SMD simulations provide a model for bc1 complex recognition, binding, and unbinding of cyt. c2 in Rba. sphaeroides. First, long-range electrostatic interactions, between an oxidized cyt. c2 and a reduced bc1 complex, allow for recognition of complementary half-ring binding patterns to yield an encounter complex. The formation of this complex is followed by establishing the intermediate scale charge-charge and charge-polar interactions and, subsequently, the short-range van der Waals, minimal core interactions when the docking partners approach each other within 5–7 Å. Finally, the lysine switch is formed signaling the last binding step. The close inter-heme distance permitted by the fuzzy docked conformations allows for rapid electron transfer to take place. After the electron transfer, the lysine switch breaks and interface mobility mismatch sets in, thereby weakening the electrostatic interactions at the interface through hydration. The surfaces, now water-exposed, force the hydrophobic residues to bury themselves within the surfaces of their respective proteins to avoid solvent, thus loosening the interface hydrophobic contact. This loosening of the hydrophobic contacts facilitates further separation of the two hemes, thus, reducing the probability of a reverse electron transfer. Finally, the already weakened long-range electrostatic interactions are screened away by the growing water population at the interface, causing cyt. c2 to unbind from the bc1 complex. Described in Section S7 of the SI, the iron-sulfur protein then unbinds from cyt. c1 to return towards the quinol binding site where it acquires a new electron to replenish the oxidized cyt. c1 in the next cycle.
Conclusions
The present study establishes a first all-atom model of cyt. c2 recognition, binding, and unbinding of the bc1 complex in Rba. sphaeroides. The model is further shown to be applicable for the more ubiquitous cyt. c - bound bc1 complexes. In particular, we show how single-electron transport complexes tune their non-bonded (electrostatic and van der Waals) interactions to recognize and respond to the different stages of electron transfer. Addressing these interactions provides direct structural and functional insights into key rate-determining bioenergetic processes that underlie photosynthesis and respiration. We find: (i) a non-degenerate half-ring binding pattern of the cyt. c2 molecule on the bc1 complex primarily guided through electrostatic interactions that enable long-range recognition and optimal orientation; (ii) the structure and physical characteristics of a hydrophobic core which allows close inter-heme proximity and direct bc1 complex to cyt. c2 electron transfer; (iii) a distribution of conformations characterizing cyt. c2 - cyt. c1 docking rather than a single conformation, all conformations exhibiting short heme edge-heme edge distances guaranteeing fast electron transfer; (iv) a lysine switch which attenuates interfacial adhesion after electron transfer; (v) a mobility mismatch between the cyt. c2 and bc1 complex binding surfaces that facilitates unbinding; (vi) a majority of the redox energy stored between the reduced and oxidized hemes being consumed for partner recognition and binding, rather than for driving electron transfer. These findings bridge the information gap between apparently conflicting experimental data over the past three decades, also providing a key example of interface recognition within a crowded cellular environment and its computational description.
Supplementary Material
Acknowledgments
The research reported here has been supported by the National Institute of Health through grants 9P41GM104601 (to KS), and R01GM086749 (to ET), U54GM087519 (to KS, ET), and the National Science Foundation through grants MCB1157615 and PHY1430124 (to KS) and ACI1238993 (to ET). The authors also acknowledge supercomputer time on Stampede provided by the Texas Advanced Computing Center (TACC) at the University of Texas at Austin through Extreme Science and Engineering Discovery Environment (XSEDE) Grant XSEDE MCA06N060 (to ET) and MCA93S028 to (KS). This research used resources of the Oak Ridge Leadership Computing Facility at the Oak Ridge National Laboratory, which is supported by the Office of Science of the U.S. Department of Energy under Contract No. DE-AC05-00OR22725. AS and AMB are grateful for financial support from the Beckman Foundation.
Footnotes
Electronic Supplementary Information
Electronic Supplementary Information (ESI) available: Additional tables and figures, and coordinates of the energetically most favorable conformation of cytochrome c2 - bc1 docked complex (sphaeroides.pdb) and its aligned yeast counterpart (yeast.pdb), as derived from MD simulations.
References
- 1.Garrett R, Grisham C. Biochemistry. Cengage Learning; 2012. [Google Scholar]
- 2.Moser CC, Dutton PL. Biochemistry. 1988;27:2450–2461. doi: 10.1021/bi00407a031. [DOI] [PubMed] [Google Scholar]
- 3.Fromme P, Melkozernov A, Jordan P, Krauss N. FEBS Lett. 2003;555:40–44. doi: 10.1016/s0014-5793(03)01124-4. [DOI] [PubMed] [Google Scholar]
- 4.Cartron ML, Olsen JD, Sener M, Jackson PJ, Brindley AA, Qian P, Dickman MJ, Leggett GJ, Schulten K, Hunter CN. Biochim. Biophys. Acta – Bioener. 2014;1837:1769–1780. doi: 10.1016/j.bbabio.2014.02.003. [DOI] [PMC free article] [PubMed] [Google Scholar]
- 5.Hunter C, Daldal F, Thurnauer M, Beatty J. The purple phototrophic bacteria. Vol. 28 Springer Science & Business Media; 2008. [Google Scholar]
- 6.Li Y, Naqui A, Frey TG, Chance B. Biochem. J. 1987;242:417–423. doi: 10.1042/bj2420417. [DOI] [PMC free article] [PubMed] [Google Scholar]
- 7.Witt H, Malatesta F, Nicoletti F, Brunori M, Ludwig B. Eur. J. Biochem. 1998;251:367–373. doi: 10.1046/j.1432-1327.1998.2510367.x. [DOI] [PubMed] [Google Scholar]
- 8.Geyer T, Helms V. Biophys. J. 2006;91:927–937. doi: 10.1529/biophysj.105.067561. [DOI] [PMC free article] [PubMed] [Google Scholar]
- 9.Nyola A, Hunte C. Transactions. 2008;36:981–985. doi: 10.1042/BST0360981. [DOI] [PubMed] [Google Scholar]
- 10.Solmaz SRN, Hunte C. J. Biol. Chem. 2008;283:17542–17549. doi: 10.1074/jbc.M710126200. [DOI] [PubMed] [Google Scholar]
- 11.Guner S, Willie A, Millett F, Caffrey MS, Cusanovich MA, Robertson DE, Knaff DB. Biochemistry. 1993;32:4793–4800. doi: 10.1021/bi00069a014. [DOI] [PubMed] [Google Scholar]
- 12.Venturoli G, Gabellini N, Oesterhelt D, Melandri BA. Eur. J. Biochem. 1990;189:95–103. doi: 10.1111/j.1432-1033.1990.tb15464.x. [DOI] [PubMed] [Google Scholar]
- 13.Long JE, Durham B, Okamura M, Millett F. Biochemistry. 1989;28:6970–6974. doi: 10.1021/bi00443a029. [DOI] [PubMed] [Google Scholar]
- 14.Lange C, Hunte C. Proc. Natl. Acad. Sci. USA. 2002;99:2800–2805. doi: 10.1073/pnas.052704699. [DOI] [PMC free article] [PubMed] [Google Scholar]
- 15.Sinjorgo KM, Steinebach OM, Dekker HL, Muijsers AO. Biochim. Biophys. Acta – Bioener. 1986;850:108–115. doi: 10.1016/0005-2728(86)90014-9. [DOI] [PubMed] [Google Scholar]
- 16.Axelrod HL, Abresch EC, Okamura MY, Yeh AP, Rees DC, Feher G. J. Mol. Biol. 2002;319:501–515. doi: 10.1016/S0022-2836(02)00168-7. [DOI] [PubMed] [Google Scholar]
- 17.Pietras R, Sarewicz M, Osyczka A. J. Phys. Chem. B. 2014;118:6634–6643. doi: 10.1021/jp503339g. [DOI] [PMC free article] [PubMed] [Google Scholar]
- 18.Wang K, Zhen Y, Sadoski R, Grinnell S, Geren L, Ferguson-Miller S, Durham B, Millett F. J. Biol. Chem. 1999;274:38042–38050. doi: 10.1074/jbc.274.53.38042. [DOI] [PubMed] [Google Scholar]
- 19.Kokhan O, Wraight CA, Tajkhorshid E. Biophys. J. 2010;99:2647–2656. doi: 10.1016/j.bpj.2010.08.042. [DOI] [PMC free article] [PubMed] [Google Scholar]
- 20.Paddock ML, Weber KH, Chang C, Okamura MY. Biochemistry. 2005;44:9619–9625. doi: 10.1021/bi050651d. [DOI] [PMC free article] [PubMed] [Google Scholar]
- 21.Pelletier H, Kraut J. Science. 1992;258:1748–1755. doi: 10.1126/science.1334573. [DOI] [PubMed] [Google Scholar]
- 22.Volkov AN, Worrall JAR, Holtzmann E, Ubbink M. Proc. Natl. Acad. Sci. USA. 2006;103:18945–18950. doi: 10.1073/pnas.0603551103. [DOI] [PMC free article] [PubMed] [Google Scholar]
- 23.Hunte C, Koepke J, Lange C, Roßmanith T, Michel H. Structure. 2000;8:669–684. doi: 10.1016/s0969-2126(00)00152-0. [DOI] [PubMed] [Google Scholar]
- 24.Esser L, Elberry M, Zhou F, Yu C-A, Yu L, Xia D. J. Biol. Chem. 2008;283:2846–2857. doi: 10.1074/jbc.M708608200. [DOI] [PubMed] [Google Scholar]
- 25.Kyndt JA, Fitch JC, Berry RE, Stewart MC, Whitley K, Meyer TE, Walker FA, Cusanovich MA. Biochim. Biophys. Acta – Bioener. 2012;1817:811–818. doi: 10.1016/j.bbabio.2012.01.013. [DOI] [PMC free article] [PubMed] [Google Scholar]
- 26.Tiede DM, Vashishta AC, Gunner MR. Biochemistry. 1993;32:4515–4531. doi: 10.1021/bi00068a006. [DOI] [PubMed] [Google Scholar]
- 27.Autenrieth F, Tajkhorshid E, Schulten K, Luthey-Schulten Z. J. Phys. Chem. B. 2004;108:20376–20387. [Google Scholar]
- 28.Roberts VA, Thompson EE, Pique ME, Perez MS, Ten Eyck L. J. Comp. Chem. 2013;34:1743–1758. doi: 10.1002/jcc.23304. [DOI] [PMC free article] [PubMed] [Google Scholar]
- 29.Jo S, Kim T, Im W. PLoS ONE. 2007;2:e880. doi: 10.1371/journal.pone.0000880. [DOI] [PMC free article] [PubMed] [Google Scholar]
- 30.Jo S, Lim JB, Klauda JB, Im W. Biophys. J. 2009;97:50–58. doi: 10.1016/j.bpj.2009.04.013. [DOI] [PMC free article] [PubMed] [Google Scholar]
- 31.Wu EL, Cheng X, Jo S, Rui H, Song KC, Dávila-Contreras EM, Qi Y, Lee J, Monje-Galvan V, Venable RM, Klauda JB, Im W. J. Comp. Chem. 2014;35:1997–2004. doi: 10.1002/jcc.23702. [DOI] [PMC free article] [PubMed] [Google Scholar]
- 32.Jo S, Kim T, Iyer VG, Im W. J. Comp. Chem. 2008;29:1859–1865. doi: 10.1002/jcc.20945. [DOI] [PubMed] [Google Scholar]
- 33.Brooks BR, et al. J. Comp. Chem. 2009;30:1545–1614. doi: 10.1002/jcc.21287. [DOI] [PMC free article] [PubMed] [Google Scholar]
- 34.Phillips JC, Braun R, Wang W, Gumbart J, Tajkhorshid E, Villa E, Chipot C, Skeel RD, Kalé L, Schulten K. J. Comp. Chem. 2005;26:1781–1802. doi: 10.1002/jcc.20289. [DOI] [PMC free article] [PubMed] [Google Scholar]
- 35.Klauda JB, Venable RM, Freites JA, O’Connor JW, Tobias DJ, Mondragon-Ramirez C, Vorobyov I, Alexander D, MacKerell J, Pastor RW. J. Phys. Chem. B. 2010;114:7830–7843. doi: 10.1021/jp101759q. [DOI] [PMC free article] [PubMed] [Google Scholar]
- 36.Mackerell AD, Feig M, Brooks CL. J. Comp. Chem. 2004;25:1400–1415. doi: 10.1002/jcc.20065. [DOI] [PubMed] [Google Scholar]
- 37.Autenrieth F, Tajkhorshid E, Baudry J, Luthey-Schulten Z. J. Comp. Chem. 2004;25:1613–1622. doi: 10.1002/jcc.20079. [DOI] [PubMed] [Google Scholar]
- 38.Humphrey W, Dalke A, Schulten K. J. Mol. Graphics. 1996;14:33–38. doi: 10.1016/0263-7855(96)00018-5. [DOI] [PubMed] [Google Scholar]
- 39.Izrailev S, Stepaniants S, Balsera M, Oono Y, Schulten K. Biophys. J. 1997;72:1568–1581. doi: 10.1016/S0006-3495(97)78804-0. [DOI] [PMC free article] [PubMed] [Google Scholar]
- 40.Izrailev S, Crofts AR, Berry EA, Schulten K. Biophys. J. 1999;77:1753–1768. doi: 10.1016/S0006-3495(99)77022-0. [DOI] [PMC free article] [PubMed] [Google Scholar]
- 41.Isralewitz B, Baudry J, Gullingsrud J, Kosztin D, Schulten K. J. Mol. Graph. Model. 2001;19:13–25. doi: 10.1016/s1093-3263(00)00133-9. [DOI] [PubMed] [Google Scholar]
- 42.Conte LL, Chothia C, Janin J. J. Mol. Biol. 1999;285:2177–2198. doi: 10.1006/jmbi.1998.2439. [DOI] [PubMed] [Google Scholar]
- 43.Crowley PB, Carrondo MA. Proteins: Struct., Func., Bioinf. 2004;55:603–612. doi: 10.1002/prot.20043. [DOI] [PubMed] [Google Scholar]
- 44.Crowley PB, Ubbink M. Acc. Chem. Res. 2003;36:723–730. doi: 10.1021/ar0200955. [DOI] [PubMed] [Google Scholar]
- 45.Tanner DE, Chan K-Y, Phillips JC, Schulten K. J. Chem. Theor. Comp. 2011;7:3635–3642. doi: 10.1021/ct200563j. [DOI] [PMC free article] [PubMed] [Google Scholar]
- 46.Hunte C, Solmaz S, Lange C. Biochim. Biophys. Acta – Bioener. 2002;1555:21–28. doi: 10.1016/s0005-2728(02)00249-9. [DOI] [PubMed] [Google Scholar]
- 47.Tetreault M, Rongey SH, Feher G, Okamura MY. Biochemistry. 2001;40:8452–8462. doi: 10.1021/bi010222p. [DOI] [PubMed] [Google Scholar]
- 48.Tetreault M, Cusanovich M, Meyer T, Axelrod H, Okamura MY. Biochemistry. 2002;41:5807–5815. doi: 10.1021/bi012053e. [DOI] [PubMed] [Google Scholar]
- 49.Becke AD. J. Chem. Phys. 1993;98:5648–5652. [Google Scholar]
- 50.Kubota T, Yoshikawa S, Matsubara H. J. Biochem. 1992;111:91–98. doi: 10.1093/oxfordjournals.jbchem.a123725. [DOI] [PubMed] [Google Scholar]
- 51.Gabellini N, Bowyer JR, Hurt E, Melandri BA, Hauska G. Eur. J. Biochem. 1982;126:105–111. doi: 10.1111/j.1432-1033.1982.tb06753.x. [DOI] [PubMed] [Google Scholar]
- 52.Sethi A, Eargle J, Black AA, Luthey-Schulten Z. Proc. Natl. Acad. Sci. USA. 2009;106:6620–6625. doi: 10.1073/pnas.0810961106. [DOI] [PMC free article] [PubMed] [Google Scholar]
- 53.Devanathan S, Salamon Z, Tollin G, Fitch JC, Meyer TE, Berry EA, Cusanovich MA. Biochemistry. 2007;46:7138–7145. doi: 10.1021/bi602649u. [DOI] [PMC free article] [PubMed] [Google Scholar]
- 54.Charles Olea J, Kuriyan J, Marletta MA. J. Am. Chem. Soc. 2010;132:12794–12795. doi: 10.1021/ja106252b. [DOI] [PMC free article] [PubMed] [Google Scholar]
- 55.Sener M, Strümpfer J, Singharoy A, Hunter CN, Schulten K. eLife. 2015 doi: 10.7554/eLife.09541. Submitted. [DOI] [PMC free article] [PubMed] [Google Scholar]
- 56.Kaila VRI, Johansson MP, Sundholm D, Wikstrom M. Proc. Natl. Acad. Sci. USA. 2010;107:21470–21475. doi: 10.1073/pnas.1005889107. [DOI] [PMC free article] [PubMed] [Google Scholar]
- 57.Mitin AV, Kubicki JD. Langmuir. 2009;25:548–554. doi: 10.1021/la802647c. [DOI] [PubMed] [Google Scholar]
- 58.Atkins P, de Paula J. Atkins Physical Chemistry. OUP Oxford; 2010. [Google Scholar]
- 59.Yu C-A, Steidl JR, Yu L. Biochim. Biophys. Acta – Biomem. 1983;736:226–234. doi: 10.1016/0005-2736(83)90288-2. [DOI] [PubMed] [Google Scholar]
- 60.Krishnaswamy SR, Williams ER, Kirsch JF. Prot. Sci. 2006;15:1465–1475. doi: 10.1110/ps.062083406. [DOI] [PMC free article] [PubMed] [Google Scholar]
- 61.Baker NA, Sept D, Joseph S, Holst MJ, McCammon JA. Proc. Natl. Acad. Sci. USA. 2001;98:10037–10041. doi: 10.1073/pnas.181342398. [DOI] [PMC free article] [PubMed] [Google Scholar]
- 62.Battistuzzi G, Borsari M, Bortolotti CA, Di Rocco G, Ranieri A, Sola M. J. Phys. Chem. B. 2007;111:10281–10287. doi: 10.1021/jp0730343. [DOI] [PubMed] [Google Scholar]
Associated Data
This section collects any data citations, data availability statements, or supplementary materials included in this article.