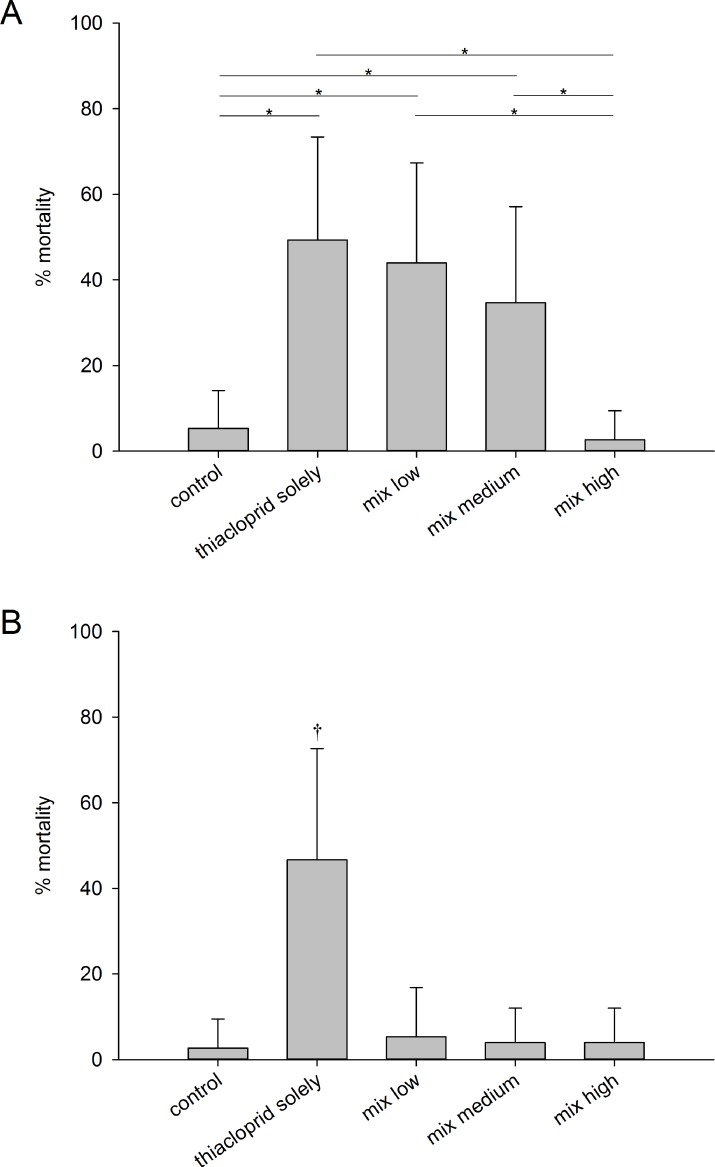
Figure 3. Mortality rates.
Means mortality rates ±SD of C. riparius larvae per test vessel (n = 15) after exposure for 96 h to control conditions, to 1.0 µg/L thiacloprid solely, or to 1.0 µg/L thiacloprid in addition of low, medium and high concentrations of zeolites. (A) Experiment with Y30 zeolites. Asterisks (*) mark p ≤ α. (B) Experiment with H-Beta(OH)-III zeolites. The cross (†) marks the treatment group that showed significant differences vs. all other treatments.

