Abstract
Aim
To describe the vascular features of choroidal tumors using enhanced depth imaging (EDI), optical coherence tomography (OCT), and OCT-angiography.
Methods
In this prospective study, we evaluated 116 Caucasian patients with choroidal tumors (60 eyes with choroidal nevi, 40 with choroidal melanoma, 6 with choroidal hemangioma, 2 with optic disc melanocytoma, 6 with choroidal osteoma, and 2 with retinal metastases). Patients underwent a complete ophthalmic examination including bulbar echography, EDI-OCT, OCT-angiography, and multicolor imaging. Sixteen patients also underwent fluorescein and indocyanine angiography.
Results
The left eye was more involved than the right eye. The mean tumor thickness was 1.23±0.17 mm in the 60 eyes with choroidal nevi; 2.75±0.83 mm in the 40 eyes with choroidal melanoma; 3.28±0.78 mm in the 6 eyes with retinal angioma; 2.02±0.001 mm in the 2 eyes with optic disc melanocytoma; 2.40±0.31 mm in the 6 eyes with choroidal osteoma; and last, 3.49±0.001 mm in the 2 eyes with retinal metastases. OCT-angiography showed: (i) a lack of blood flow in the outer retinal layer (ORL) and a normal choroid capillary layer in choroidal nevi and optic disc melanocytomas; (ii) a lack of blood flow in the ORL of choroidal metastases; and (iii) a dense irregular vascular network in the ORL and choroid capillary layers of choroidal melanomas, choroidal hemangiomas, and choroidal osteomas.
Conclusions
OCT-angiography is a noninvasive reliable method with which to evaluate the vascularization of small choroidal tumors and may improve the diagnosis of these tumors.
Introduction
Unlike fluorangiography and indocyanine green angiography that entail the use of contrast media to visualize the chorioretinal layers, optical coherence tomography (OCT)-angiography is based on high-resolution imaging techniques whereby the retinal and choroidal circulation can be visualized using the blood flowing through vessels.1, 2 This noninvasive technique is now used to diagnose and monitor most chorioretinal disorders.3, 4 Herein, we describe the vascular features of choroidal tumors using EDI-OCT and OCT-angiography.
Materials and methods
Patients
One-hundred and sixteen Caucasian patients with choroidal tumors attending the Eye Clinic of the University of Naples Federico II between December 2014 and September 2015 were enrolled. Sixty eyes had choroidal nevi (51.72%), 40 choroidal melanoma (34.48%), 6 choroidal hemangioma (5.17%), 2 optic disc melanocytoma (1.73%), 6 choroidal osteoma (5.17%), and 2 retinal metastases (1.73%). The study protocol was approved by the Institutional Review Board of the University of Naples Federico II and adhered to the tenets of the Declaration of Helsinki (64th WMA General Assembly, Fortaleza, Brazil, October 2013).
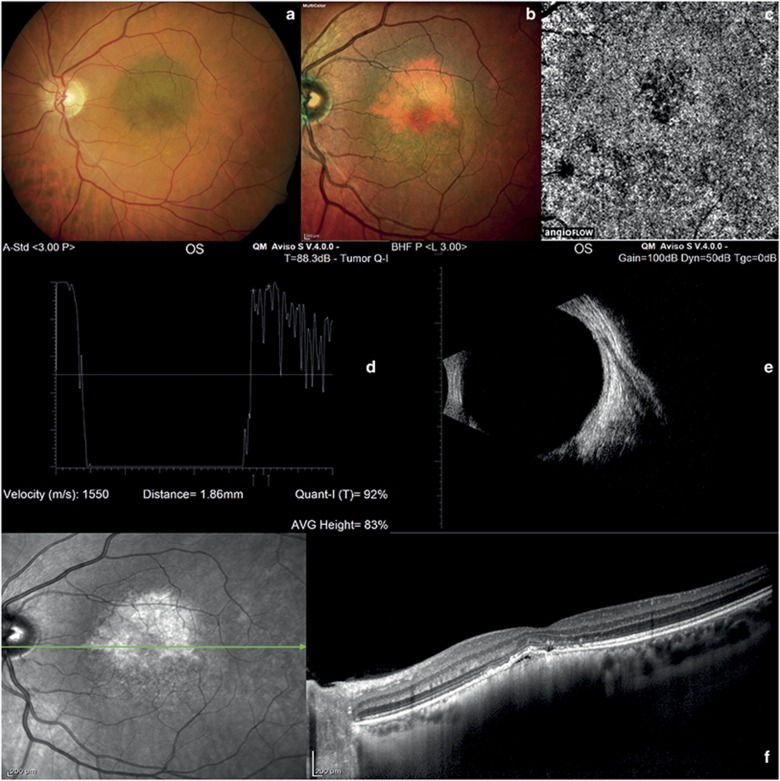
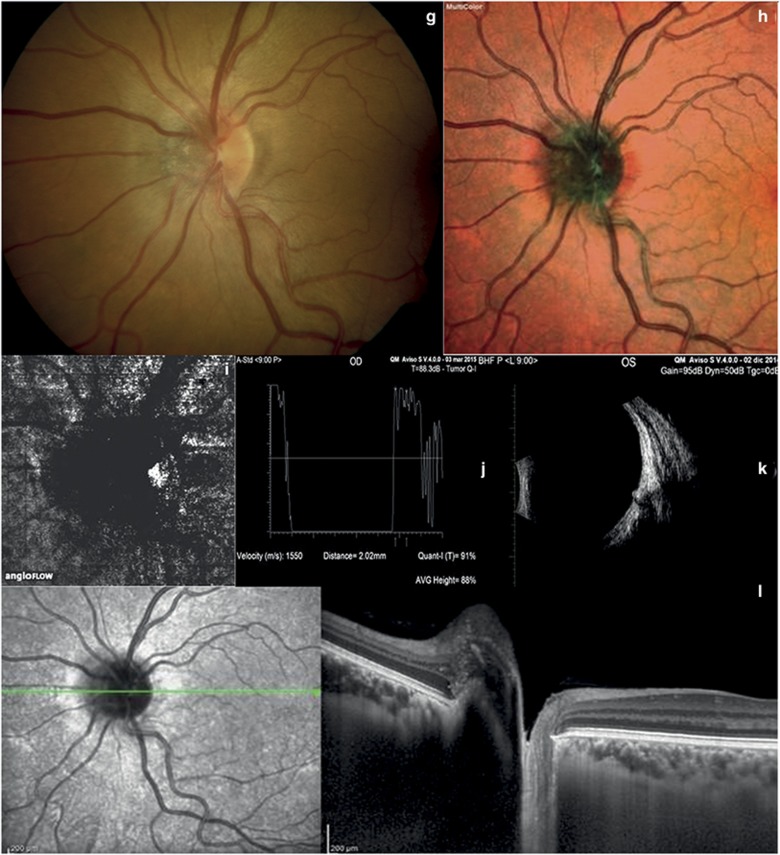
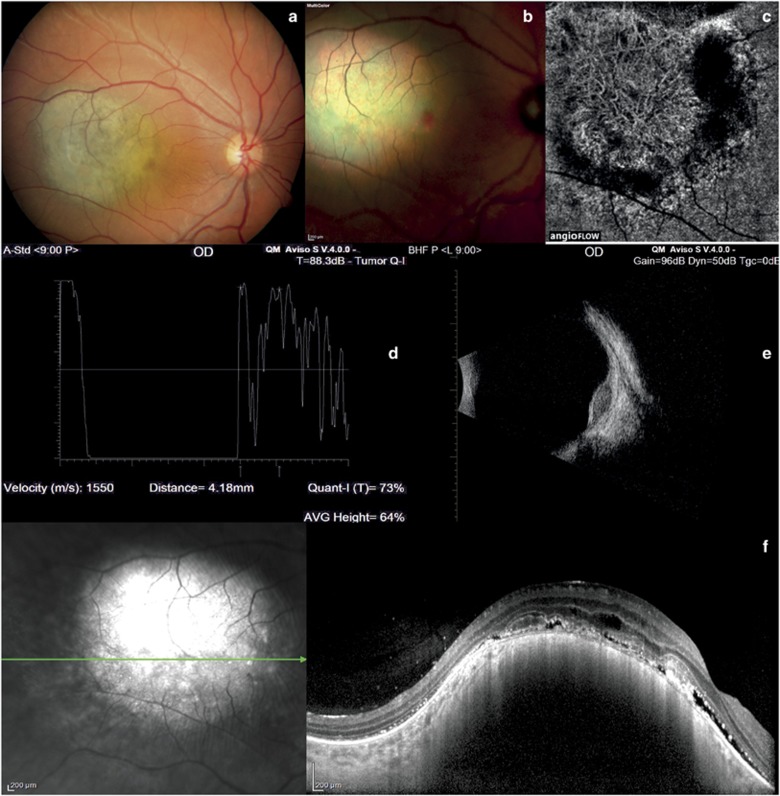
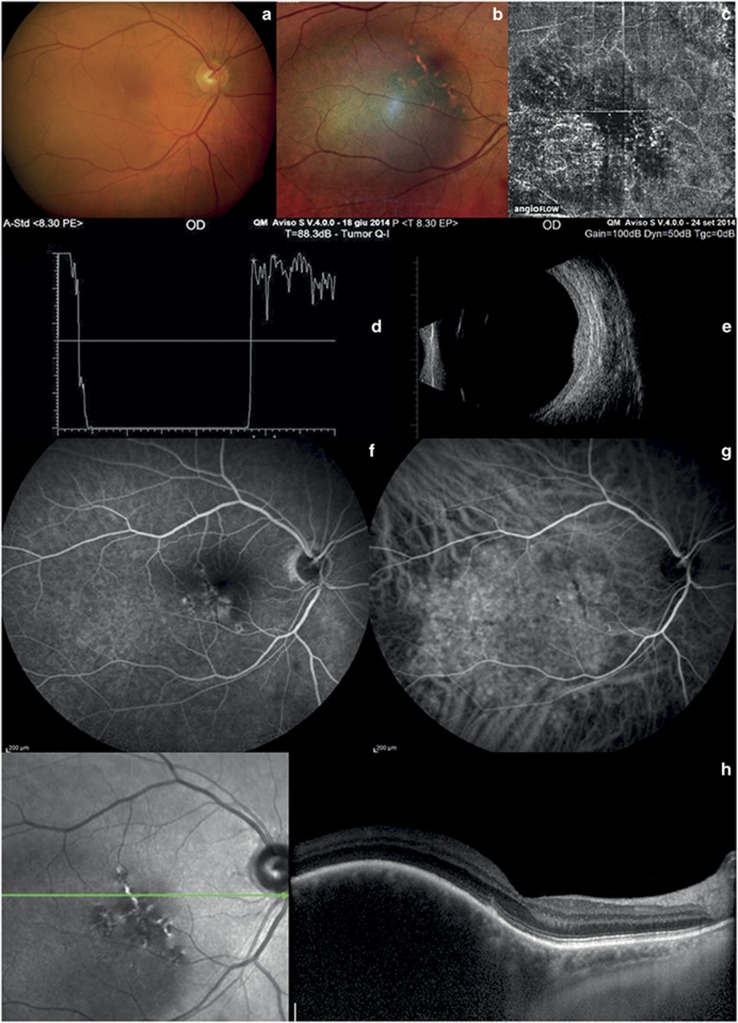
All patients underwent a detailed clinical examination that included evaluation of intraocular pressure, dilated fundus photography (Figures 1a and g, 2a, 3a, 3l and 4a), ultrasonographic evaluation (A-scan and B-scan echography), OCT-angiography, multicolor imaging (Figures 1b and h,2b, 3b, and 4b), and enhanced depth imaging (EDI)-OCT. The tumor thickness was calculated with ultrasonography. Sixteen patients underwent fluorescein and indocyanine angiography: 8 with choroidal melanoma, 4 with choroidal osteoma, and 4 with choroidal hemangioma (Figures 3f and g and 4c and d).
Figure 1.
Choroidal nevus and melanocytoma. (a) Color fundus photography of choroidal nevus shows a pigmented lesion with smooth margins located at the posterior pole. (b) Multicolor imaging of choroidal nevus shows an orange-yellow lesion. (c) At OCT-angiography of choroidal nevus, the outer retinal and choroid layers are normal. (d) A-scan echography showing high reflectivity of choroidal nevus. (e) B-scan echography of choroidal nevus shows a solid flat lesion at the posterior pole. (f) In choroidal nevus, EDI-OCT shows a highly reflective band within the choriocapillaris, subretinal fluid, and photoreceptor loss. (g) Color fundus photography of melanocytoma shows a pigmented lesion located on the optic disk. (h) Multicolor imaging of melanocytoma shows an orange-yellow lesion. (i) OCT-angiography of melanocytoma did not reveal any blood flow within the tumor. (j and k) A- and B-scan ultrasonography of melanocytoma shows high reflectivity at the optic disk. (l) In melanocytoma, EDI-OCT reveals photoreceptor loss.
Figure 2.
Melanoma. (a and b) Color fundus photography and multicolor imaging reveal a pigmented mass. (c) OCT-angiography shows a vascular network inside the tumor. (d) A-scan echography shows low to medium reflectivity and vascularity of the lesion. (e) B-scan echography shows a dome-shaped hyperreflective mass. (f) EDI-OCT reveals a highly reflective band associated with intra-subretinal fluid and shaggy photoreceptors.
Figure 3.
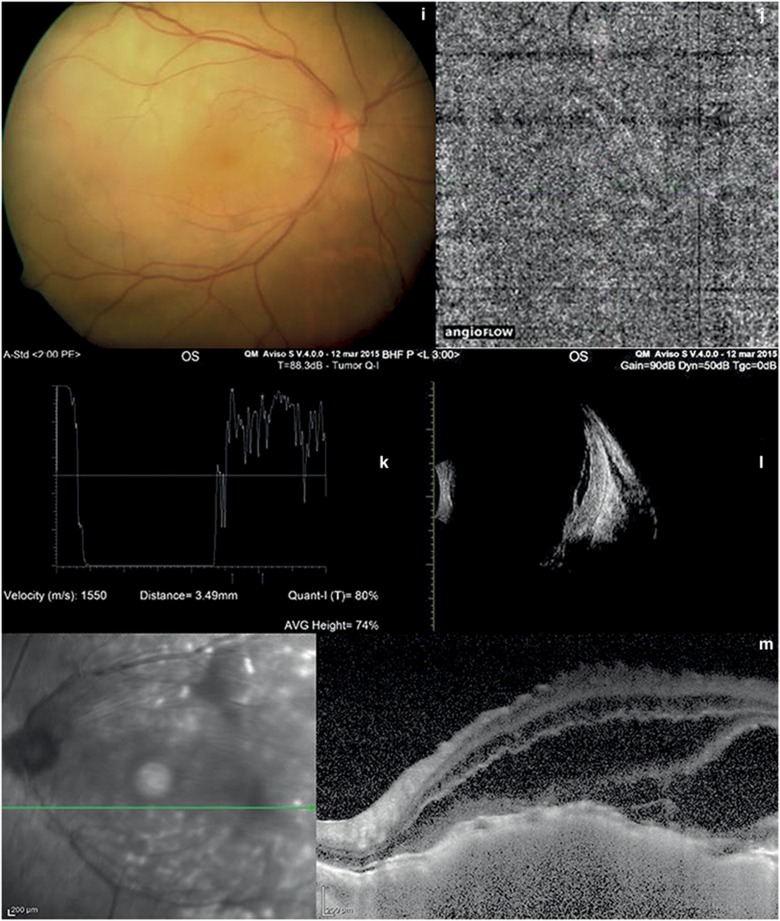
Choroidal hemangioma and choroidal metastasis. (a and b) Color fundus photography of hemangioma and multicolor imaging show an orange–red lesion. (c) OCT-angiography of hemangioma shows large choroidal vessels inside the tumor. (d) A-scan echography of hemangioma shows high reflectivity of the lesion. (e) B-scan echography of hemangioma shows a dome-shaped hyperreflective mass. (f, and g) Fluorescein and indocyanine angiography of hemangioma reveal hyperfluorescence in the early stage. (h) In choroidal hemangioma, EDI-OCT shows elevation of the retinal-choroid complex and photoreceptor loss. (i) Color fundus examination of choroidal metastasis shows a yellow mass. (j): OCT-angiography of choroidal metastasis does not show any blood flow inside the lesion. (k) A-scan echography of choroidal metastasis shows high irregular reflectivity. (l) B-scan echography of choroidal metastasis shows a solid mass and retinal detachment. (m) In choroidal metastasis, EDI-OCT shows elevation of the retina-choroid complex and retinal detachment.
Figure 4.
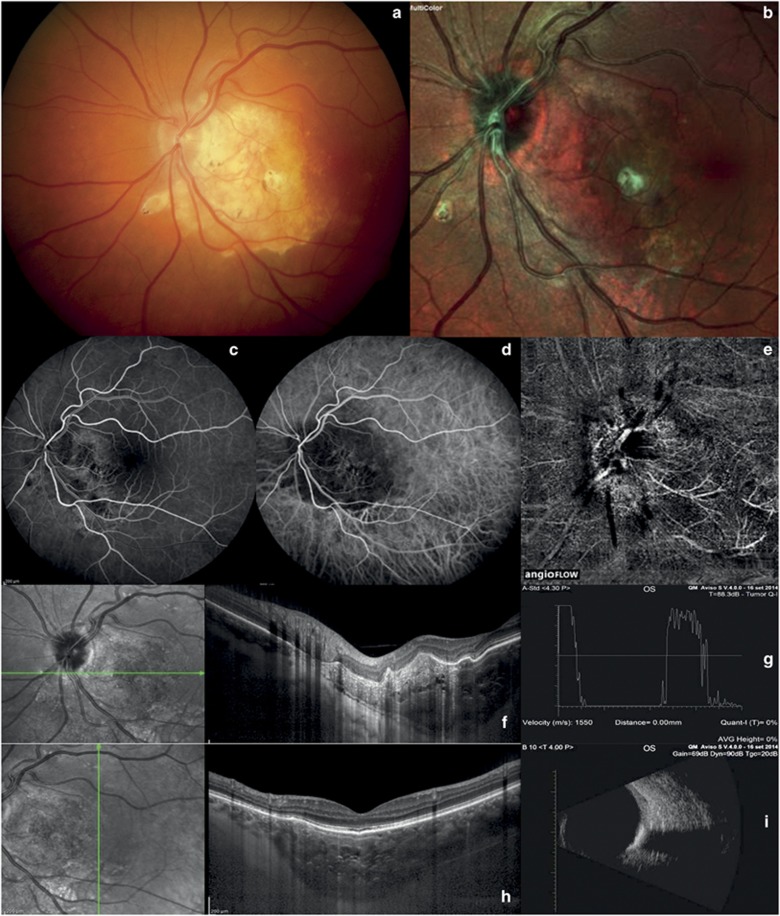
Choroidal osteoma. (a and b) Color fundus photography and multicolor imaging show an orange–red lesion. (c and d) Fluorescein and indocyanine angiography show a capillary network in the early stage. (e) OCT-angiography reveals a fine vascular network within the tumor. (f–h) EDI-OCT shows horizontal lamellar lines, horizontal or vertical tubules, and speckled regions. (a) A-scan echography shows very high reflectivity. (i) B-scan echography shows a solid mass with acoustic shadowing.
OCT-angiography
We obtained OCT images with the Optovue Avanti RTVue XR system (Optovue Inc., Fremont, CA, USA), which is based on the split-spectrum amplitude decorrelation algorithm. This instrument has an A-scan rate of 70 000 scans per second, using a scan beam centered at 840 nm, with a bandwidth of 45 nm. Each OCT-angiography volume contained 304 × 304 A-scans, with two consecutive B-scans (M–B frames) captured at each fixed position before proceeding to the next sampling location. The acquisition time per volume was ~3 s. Two orthogonal volumes were acquired for motion correction and to minimize motion artifacts. The spectrum of the light source was split into multiple component parts to decrease the noise present in the image; each part was used to perform the decorrelation step and the results of all the split spectra were averaged. In any given region of tissue, the projection image can be viewed to obtain an image of the contained blood flow.5, 6 The images were captured with the standard angioretina protocol7 with a resolution of 3 mm × 3 mm, and 6 mm × 6 mm centered on the lesion. We manually segmented from 30 μm below Bruch’s membrane (inner boundary) to 30–60 μm below the retinal pigment epithelium (RPE) (outer boundary). The inner capillary layers (superficial) were imaged starting with the internal limiting membrane and by selecting a thickness sufficient to include the ganglion cell layer in the central macular region. To image the outer plexus (deep), we placed the inner segmentation line at the outer border of the inner plexiform layer and the outer boundary was the mid-point of the outer plexiform layer. Thus defined, the inner retina should contain the entire normal retinal vasculature. The outer retinal layer (ORL) was defined as the distance from the outer plexiform layer to Bruch’s membrane. The outer retina is normally avascular, and any flow in this layer could be interpreted as pathological vascularization. The choroidal layer was defined as the layer below Bruch’s membrane. Images were separated into retinal and choroidal regions with the dividing boundary set at the RPE. The depth of the highly reflective RPE was identified through the analysis of the reflectance and reflectance gradient profiles. The region above the RPE is defined as the retinal layer, and the region below as the choroidal layer.8, 9
Results
The median age of our 116 patients was 54.46±15.13 years. The majority were female (56.9 vs 43.1%). In all patients, the left eye was more involved than the right eye (65.52 vs 34.48%). The features of the choroidal tumors are summarized in Table 1. At standardized A-scan echography, the mean tumor thickness was 1.23±0.17 mm (range 0.41–2.34 mm) in the 60 eyes with choroidal nevi (Figures 1d and e); 2.75±0.83 mm (range 1.94–4.77 mm) in the 40 eyes with choroidal melanoma (Figures 2d and e); 3.28±0.78 mm (range 2.32–4.03 mm) in the 6 eyes with retinal hemangioma (Figures 3d and e); 2.02±0.007 mm (range 2.02–2.03 mm) in the 2 eyes with optic disc melanocytoma (Figures 1j and k); 2.40±0.31 mm (range 2.05–2.75 mm) in the 6 eyes with choroidal osteoma (Figures 4g and i); and 3.49±0.014 mm (range 3.48–3.50 mm) in the 2 eyes with retinal metastasis (Figures 3k and l). At EDI-OCT, a highly reflective band within the choriocapillaris layer with posterior shadowing appeared in all melanocytic tumors (nevi, optic disc melanocytomas, and melanomas; Figures 1f and l and 2f). However, the caliber of choroidal vascular spaces was normal in melanocytic nevus. Circumscribed choroidal hemangioma showed low/medium reflectivity and a homogenous signal with large intrinsic spaces (possibly vascular; Figure 3h). In contrast, choroidal metastasis appeared as a low reflective band with enlargement of the suprachoroidal space (Figure 3m).
Table 1. Ophthalmic features of the study population.
| Feature | Melanoma | Hemangioma | Melanocytoma | Osteoma | Metastasis | Nevi |
|---|---|---|---|---|---|---|
| Eyes, no. | 40 | 6 | 2 | 6 | 2 | 60 |
| Tumor thickness (mm)a | 2.75±0.83 | 3.28±0.78 | 2.02±0.007 | 2.40±0.31 | 3.49±0.014 | 1.23±0.170 |
| Primary tissue involved | Choroid | Choroid | Choroid | Choroid | Choroid | Choroid |
| Subretinal findings | Fluid | Fluid | RPE atrophy | Fluid | Fluid | Fluid |
| Intrinsic tumor features | Homogeneous | Heterogeneous | Heterogeneous | Heterogeneous | Heterogeneous | Homogeneous |
| Retinal features | Photoreceptor shaggy | Photoreceptor shaggy | Photoreceptor loss | Photoreceptor shaggy | Photoreceptor shaggy | Photoreceptor loss |
| Choroidal vascular features | Compression | Expansion | Compression | Compression | Compression | Compression |
| Deep optical shadowingb | +++ | ++ | ++ | ++ | ++ | +++ |
| OCT-A vascularizationc | +++ | +++ | + | ++ | + | + |
Abbreviations: OCT-A, optical coherence tomography angiography; RPE, retinal pigment epithelium.
Data are expressed as mean plus/minus SD.
+, Mild; ++, moderate; +++, severe.
+, Poor capillary network; ++, modest capillary network; +++, high capillary network.
EDI-OCT showed the characteristic surface topography of choroidal osteomas, namely dome-shaped or undulating associated with horizontal lamellar lines, horizontal or vertical tubules, and speckled regions (Figures 4f and h).
OCT-angiography imaging of choroidal nevi and optic disc melanocytomas showed a lack of blood flow within the ORL, and a normal choroid capillary layer (Figures 1c and l). It also showed a lack of blood flow in the ORL in cases of choroidal metastases (Figure 3j). On the contrary, OCT-angiography imaging of choroidal melanomas, choroidal hemangiomas, and choroidal osteomas showed a dense irregular vascular network in the ORL and choroid capillary layers (Figures 2c, 3c, and 4e).
Discussion
To our knowledge, the present study is the first to evaluate choroidal tumors using OCT-angiography. Previously, this technique was used to study other retinal and choroid diseases. For example, it was used to study the morphology of the foveal avascular zone (FAZ) in patients with diabetes mellitus,10 and to evaluate the retinal vascular layers in macular telangiectasia type 2, choroidal neovascularization, and retinal vein occlusion.11, 12
Ultrasonography has an important role in the diagnosis of choroidal tumors because of its high accuracy in this setting.13 Although EDI-OCT enables the study of choroidal tumors and retinal changes induced by choroidal tumors, it does not permit an adequate visualization of choroidal vascularization.14, 15, 16, 17 OCT-angiography on the contrary visualizes the retinal and choroidal circulation without the injection of dye.5 Furthermore, OCT-angiography of the macula revealed enlargement of the deep FAZ as well as a reduction in superficial and deep capillary vascular density (CVD) in eyes with choroidal melanoma.18 In contrast, it did not identify either FAZ enlargement or CVD reduction in eyes affected by choroidal nevi.19 Speckle noise-free OCT shows the characteristic morphologic features of choroidal vessels in melanocytic choroidal tumors that depends on tumor size and on the location of the tumor.20 On the other hand, OCT-angiography visualizes the vascular tissue within the tumor and thus appears to be an good tool for the diagnosis and follow-up of choroidal tumors. In this prospective study, OCT-angiography visualized only the vascularization of small choroidal tumors (thickness ≤3 mm) within the posterior pole, and can thus be considered a complementary technique to EDI-OCT and ultrasound procedures for the diagnosis of choroidal tumors. Our study has several limitations. The patient sample was relatively small, and many OCT-angiography scans were of insufficient quality.
In conclusion, in this preliminary study we demonstrate the feasibility of directly imaging a variety of frequent benign and malignant choroidal tumors with OCT-angiography. Conceivably, advances in OCT-angiography technology will enable visualization of larger choroidal tumors located in the retinal periphery.
Footnotes
The authors declare no conflict of interest.
References
- Spaide RF, Klancnik Jr JM, Cooney MJ. Retinal vascular layers in macular telangiectasia type 2 imaged by optical coherence tomographic angiography. JAMA Ophthalmol 2015; 133: 66–73. [DOI] [PubMed] [Google Scholar]
- Ishibazawa A, Nagaoka T, Takahashi A, Omae T, Tani T, Sogawa K et al. Optical coherence tomography angiography in diabetic retinopathy: a prospective pilot study. Am J Ophthalmol 2015; 160: 35–44. [DOI] [PubMed] [Google Scholar]
- Veverka KK, AbouChehade JE, Iezzi Jr R, Pulido JS. Noninvasive grading of radiation retinopathy: the use of optical coherence tomography angiography. Retina 2015; 35(11): 2400–2410. [DOI] [PubMed] [Google Scholar]
- Mastropasqua R, Di Antonio L, Di Staso S, Agnifili L, Di Gregorio A, Ciancaglini M et al. Optical coherence tomography angiography in retinal vascular diseases and choroidal neovascularization. J Ophthalmol 2015; 2015: 343515. [DOI] [PMC free article] [PubMed] [Google Scholar]
- Spaide RF, Klancnik Jr JM, Cooney MJ. Retinal vascular layers imaged by fluorescein angiography and optical coherence tomography angiography. JAMA Ophthalmol 2015; 133(1): 45–50. [DOI] [PubMed] [Google Scholar]
- Kokame GT, Hirai K, Yanagihara R, Polypoidal Choroidal. Vasculopathy: imaging by indocyanine green angiography and en face optical coherence tomography. JAMA Ophthalmol 2015; 133(11): e151886. [DOI] [PubMed] [Google Scholar]
- Freiberg FJ, Pfau M, Wons J, Wirth MA, Becker MD, Michels S. Optical coherence tomography angiography of the foveal avascular zone in diabetic retinopathy. Graefes Arch Clin Exp Ophthalmol 2016; 254(6): 1051–1058. [DOI] [PMC free article] [PubMed] [Google Scholar]
- Jia Y, Bailey ST, Wilson DJ, Tan O, Klein ML, Flaxel CJ et al. Quantitative optical coherence tomography angiography of choroidal neovascularization in age-related macular degeneration. Ophthalmology 2014; 121: 1435–1449. [DOI] [PMC free article] [PubMed] [Google Scholar]
- An L, Wang RK. In vivo volumetric imaging of vascular perfusion within human retina and choroids with optical micro-angiography. Optics Express 2008; 16(15): 11438–11452. [DOI] [PubMed] [Google Scholar]
- Di G, Weihong Y, Xiao Z, Zhikun Y, Xuan Z, Yi Q et al. A morphological study of the foveal avascular zone in patients with diabetes mellitus using optical coherence tomography angiography. Graefes Arch Clin Exp Ophthalmol 2016; 254(5): 873–879. [DOI] [PubMed] [Google Scholar]
- Coscas GJ, Lupidi M, Coscas F, Cagini C, Souied EH. Optical coherence tomography angiography versus traditional multimodal imaging in assessing the activity of exudative age-related macular degeneration. Retina 2015; 35(11): 2219–2228. [DOI] [PubMed] [Google Scholar]
- Rispoli M, Savastano MC, Lumbroso B. Capillary network anomalies in branchretinal vein occlusion on optical coherence tomography angiography. Retina 2015; 35(11): 2332–2338. [DOI] [PMC free article] [PubMed] [Google Scholar]
- Rosa N, Cennamo G, Tranfa F. Comparison between echographic and histological findings in choroidal malignant melanomas. Acta Ophthalmol Suppl 1992; 204: 99–101. [DOI] [PubMed] [Google Scholar]
- Rojanaporn D, Kaliki S, Ferenczy SR, Shields CL. Enhanced depth imaging optical coherence tomography of circumscribed choroidal hemangioma in 10 consecutive cases. Middle East Afr J Ophthalmol 2015; 22(2): 192–197. [DOI] [PMC free article] [PubMed] [Google Scholar]
- Shields CL, Pellegrini M, Ferenczy SR, Shields JA. Enhanced depth imaging optical coherence tomography of intraocular tumors: from placid to seasick to rock and rolling topography—the 2013 Francesco Orzalesi Lecture. Retina 2014; 34(8): 1495–1512. [DOI] [PubMed] [Google Scholar]
- Torres VL, Brugnoni N, Kaiser PK, Singh AD. Optical coherence tomography enhanced depth imaging of choroidal tumors. Am J Ophthalmol 2011; 151(4): 586–593. [DOI] [PubMed] [Google Scholar]
- Spaide RF, Koizumi H, Pozzoni MC. Enhanced depth imaging spectral-domain optical coherence tomography. Am J Ophthalmol 2008; 146: 496–500. [DOI] [PubMed] [Google Scholar]
- Li Y, Say EA, Ferenczy S, Agni M, Shields CL. Altered parafoveal microvasculature in treatment-naïve choroidal melanoma eyes detected by optical coherence tomography angiography. Retina 2016; 37(1): 32–40. [DOI] [PubMed] [Google Scholar]
- Valverde-Megías A, Say EA, Ferenczy SR, Shields CL. Differential macular features on optical coherence tomography angiography in eyes with choroidal nevus and melanoma. Retina 2016. e-pub ahead of print 19 July 2016. [DOI] [PubMed]
- Maloca P, Gyger C, Hasler PW. A pilot study to image the vascular network of small melanocytic choroidal tumors with speckle noise-free 1050-nm swept source optical coherence tomography (OCT choroidal angiography). Graefes Arch Clin Exp Ophthalmol 2016; 254(6): 1201–1210. [DOI] [PubMed] [Google Scholar]


