

Abstract
Creatine, a key component of muscle energy metabolism, exhibits a chemical exchange saturation transfer effect (CEST) between its amine group and bulk water which has been exploited to spatially and temporally map creatine changes in skeletal muscle before and after exercise. Additionally, exercise leads to an increase in muscle perfusion. In this work we determined the effects of perfused blood on the CEST effects from creatine in skeletal muscle. Experiments were performed on healthy human subjects (n= 5) on whole-body Siemens 7T MRI scanner with a 28 channel RF coil. Reactive hyperemia, induced by inflation and subsequent deflation of a pressure cuff secured around the thigh was used to increase tissue perfusion while maintaining the levels of creatine kinase metabolites. CEST, arterial spin labeling (ASL), and 31P MRS data were acquired at baseline and for 6 minutes post cuff deflation. Reactive hyperemia resulted in substantial increases in perfusion in human skeletal muscle of the lower leg as measured by ASL mean percent difference. However, no significant changes in the CrCESTasym as well as in 31P MRS derived PCr levels of skeletal muscle were observed following cuff deflation. This work demonstrates that perfusion changes do not have a major confounding effect on CrCEST measurements.
Keywords: CEST, Creatine, Muscle, ASL, Perfusion
Introduction
The creatine kinase (CK) reaction plays a vital role in muscle energetics by catalyzing the exchange of high energy phosphates from phosphocreatine (PCr) to adenosine triphosphate (ATP)1.
| [1] |
During exercise, PCr is depleted to maintain ATP levels, resulting in an increased creatine (Cr) concentration2.
Magnetic resonance has been a valuable tool for studying CK kinetics since the discovery of 31P Magnetic Resonance Spectroscopy (MRS)3. 31P MRS can measure high-energy phosphate compounds including PCr and ATP. Additionally, intracellular pH can be measured noninvasively from the chemical shift of the inorganic phosphate (Pi) peak4. This technique has been used extensively to study metabolism of skeletal and cardiac muscle metabolism5–7. However, like all spectroscopy techniques, 31P MRS suffers from poor spatial resolution due to the low concentration of measured metabolites as well as a reduced sensitivity due to the low gyromagnetic ratio of 31P.
More recently, chemical exchange saturation transfer (CEST) has been used to measure CK kinetics in vivo with high spatial resolution. In a CEST experiment, saturated magnetization from exchangeable protons on a pool of solute molecules is transferred to a much larger pool of bulk water protons. The corresponding reduction in water signal results in a solute-concentration dependent contrast in CEST water images8–10, which can be utilized to provide contrast to the solute as well as potentially quantitative information about solute content and exchange rate11,12. Cr has been shown to exhibit a concentration dependent CEST effect between its amine group (-NH2) protons and bulk water protons (CrCEST)13. Furthermore, the feasibility of spatially and temporally mapping the CrCEST effect following exercise has also been demonstrated in skeletal muscle at 3T and 7T14,15.
Plantar flexion exercise has been shown to increase the CrCEST effects in exercised muscle, and the complementary recovery kinetics to the 31P MRS PCr signal under the same exercise conditions15. Furthermore, due to differences in amine proton exchange rates, the other metabolites of the creatine kinase reaction (PCr, ATP, ADP) do not exhibit a CEST effect with the utilized pulse parameters and therefore do not confound measurements of Cr changes after exercise. However, exercise also leads to an increase in muscle perfusion, and it has recently been shown ex vivo, that blood also exhibits a CEST effect16. Accordingly, increases in tissue perfusion could potentially confound measurements of CrCEST increases during and after exercise.
On the other hand, a short bout of ischemia, where blood flow is occluded for several minutes and then rapidly restored, has little effect of the PCr signal, but results in a blood flow increases during reactive hyperemia when hyperemia is restored17,18. Thus, the purpose of this investigation was to assess whether blood-flow changes alone were confounding/contaminating the measured CrCEST increase by measuring the CrCEST and 31P MRS during reactive hyperemia.
Arterial spin labeling (ASL) is widely used for non-invasive magnetic resonance imaging of perfusion19,20. In ASL, inflowing arterial blood is magnetically labeled proximal to the tissue of interest. This labeled blood then functions as an endogenous tracer that flows downstream to the capillary bed and exchanges with unlabeled protons19,20. The signal difference between images collected with and without magnetic labeling is directly proportional to tissue perfusion.
In this work, we investigated the effects of increased muscle perfusion on the CrCEST effect during reactive hyperemia following blood flow occlusion. Changes in CrCEST with increased perfusion were also compared with changes in PCr levels from 31P MRS.
Methods
Subjects
All studies were conducted in healthy volunteers (n=5, 3 male, 2 female, ages 23–31) under an approved Institutional Review Board protocol. Prior to data collection, informed written consent was obtained from each volunteer after explaining the study protocol. All MR data acquisitions of the lower leg were performed in separate trials of blood flow occlusion and subsequent hyperemia.
MRI Scans
All imaging experiments were performed on a 7T whole body MRI scanner (Siemens Medical Systems, Erlangen, Germany). CEST and flow-sensitive alternating inversion recovery (FAIR) ASL imaging experiments utilized a 28-channel receive and single channel transmit 1H knee coil (Quality Electrodynamics, Mayfield Village, OH, USA)20. 31P MRS was performed with a 1H/31P dual-tuned transmit/receive surface coil (RAPID Biomedical GmbH, Rimpar, Germany) with a 7 cm inner diameter. Reactive hyperemia was induced with an inflatable pressure cuff (Hokanson, Bellevue, WA, USA) secured around the superior thigh and rapidly inflated to 200 mmHg. The protocol included 2 minutes of rest, followed by 3 minutes of blood flow occlusion induced by cuff inflation, and then cuff deflation. CEST MRI (30s temporal resolution), FAIR ASL perfusion (reconstructed with 32s effective temporal resolution), and 31P MRS data (12s effective temporal resolution) were acquired at baseline and for 6 minutes post cuff deflation. CEST, ASL, and 31P MRS data was acquired in a single scan session in 3 separate bouts of reactive hyperemia with a swap of coils for 31P MRS acquisition following CEST and ASL acquisition.
CEST images were acquired with a 500-ms saturation pulse consisting of a series of 100-ms Hanning windowed saturation pulses and a B1rms of 123 Hz (2.9 μT) followed by a single shot RF spoiled gradient echo (GRE) readout with centric phase encoding order as previously utilized for 7T CrCEST studies15 and imaging parameters: TR/TE = 6.1/2.9 ms; slice thickness = 10 mm; FA = 10°, matrix size = 128 × 128; FOV = 130 × 130 mm. Water saturation shift reference (WASSR) images and B1 maps were collected, as described previously, for all CEST studies before and after cuff occlusion to correct for B0 and B1 inhomogeneities21,22. Cr amine protons have a chemical shift of 1.8 ppm downfield from water and thus CEST images were collected in a frequency shift range with respect to the water resonance of +1.5 ppm to +2.1 ppm and −1.5ppm to −2.1 ppm with a 0.3 ppm step size to calculate CrCESTasym and allow for adequate B0 inhomogeneity correction.
The FAIR ASL data was acquired using a pulse sequence developed in-house with echo-planar imaging readout and imaging parameters: TR/TI/TE = 2,000/1,000/20 ms; slice thickness = 10 mm; matrix size = 128 × 128; FOV = 200 × 200 mm20. Non-selective and slice-selective adiabatic inversion pulses were used for the control and label conditions, respectively. Eight label and control pairs were averaged to provide an effective frame rate of one perfusion image per 32 seconds (i.e., the perfusion map calculated at a given time-point is the mean result of 32 seconds of FAIR acquisition). A chemical shift selective fat saturation pulse was applied prior to image readout to reduce the signal from fat in the muscle.
Finally, non-localized 31P MRS was performed using the 1H/31P dual-tuned 7-cm diameter surface coil positioned on the calf and the following parameters: spectral width = 5 kHz, number of points = 512, averages = 5, TR = 2.4 s, for an effective temporal resolution of 12 s.
Data Processing
All image processing and data analysis was performed in MATLAB (Mathworks Inc., Natick, MA, version 7.5, R 2009b). B0 maps were used to generate corrected CEST images (± 1.8 p.p.m.) using the WASSR method. Similarly, B1 maps were created from two images obtained using preparation square pulses with flip angles of 30° and 60°. The B1 calibration curve for muscle at varying saturation amplitudes developed for previous CrCEST muscle studies was used in conjunction with B1 maps to correct for B1 inhomogeneities15. CrCEST asymmetry (CrCESTasym) was calculated using the B0-corrected signal intensity at ±1.8 ppm,23
| [2] |
For ASL data, motion correction was performed using SPM8 (Wellcome Trust Centre for Neuroimaging, UCL, London, UK), and ASL analysis was performed using MATLAB. Mean percent signal change maps were generated by calculating the average signal difference between pairwise control and label images, and dividing by the mean of all the controls for 8 label/control pairs. 31P MR Spectra were phased and baseline corrected and fitted using nonlinear squares methods with Gaussian functions.
Statistical analyses were done using Stata Release 14.1 (StataCorp LP, College Station, TX) and R 3.1.2 (www.r-project.org). One-sided exact Wilcoxon tests were used to compare measures of CrCESTasym, ASL mean percent difference, and relative PCR peak area between time points. Further, exact Kruskal-Wallis tests stratified by subject were used to test whether each measure differed over time.
Results
Figure 1 shows CrCESTasym maps with a temporal resolution of 30 seconds at baseline and after cuff deflation following 3 minutes of blood flow occlusion induced by cuff inflation. Similarly, Figure 2 shows ASL mean percent difference maps for 8 label control pairs with a total temporal resolution of 32 seconds generated at baseline and following cuff deflation. While ASL percent difference maps exhibited a large increase in perfusion during reactive hyperemia caused by cuff deflation which returns to baseline levels in a couple of minutes, CESTasym maps of the muscles of the lower leg in the same slice did not show any significant differences (ΔCrCESTasym< 1.0%) throughout the reactive hyperemia experiment. Thus, under the saturation parameters utilized for CrCEST experiments in skeletal muscle at 7T, the CEST effect from perfusion seems negligible as there was no change in CESTasym following cuff release.
Figure 1.
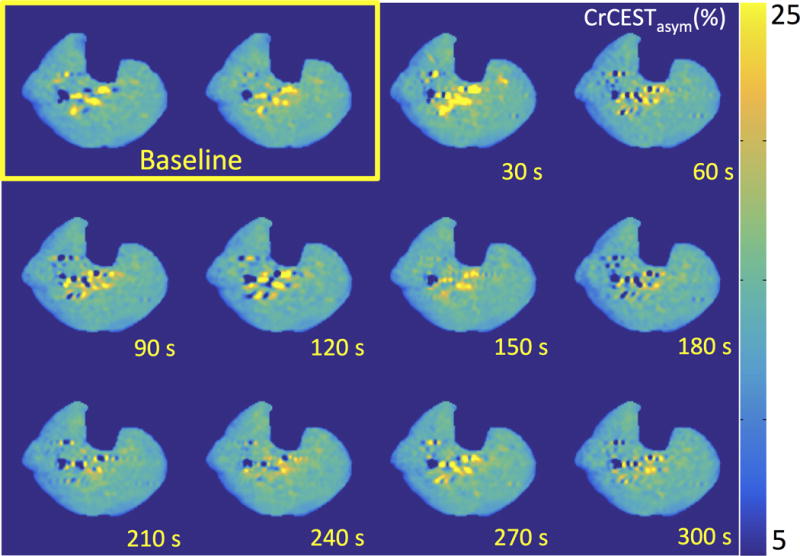
CrCESTasym maps of a healthy human leg at baseline and every 30 seconds during recovery following 3 minutes of blood flow occlusion induced by cuff inflation (total time post cuff release labeled). Color bar represents CrCESTasym in percent.
Figure 2.
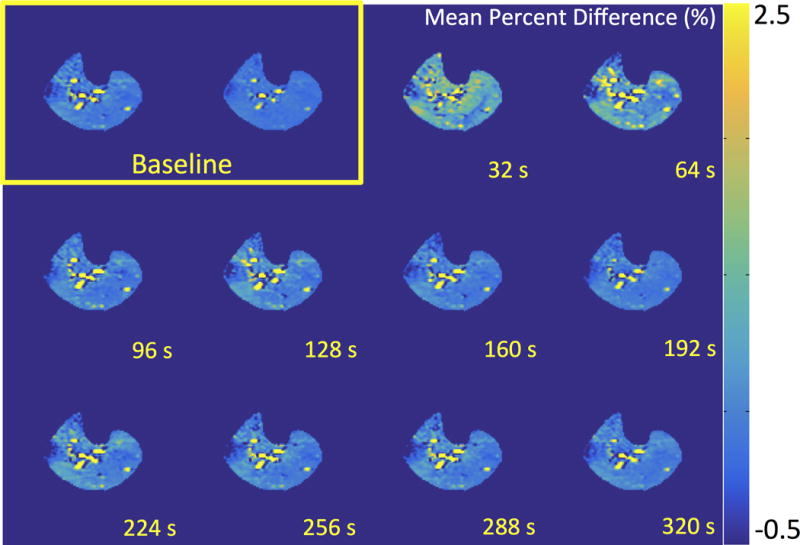
ASL mean percent difference maps for 8 label/control pairs with a total temporal resolution of 32 seconds generated at baseline and recovery after 3 minutes of blood flow occlusion induced by cuff inflation (total time post cuff release labeled). Color bar represents mean percent difference.
To further validate the CrCEST results, 31P MRS was performed to demonstrate that the Cr concentration also did not change during reactive hyperemia. The concentrations of Cr and PCr are tightly coupled due to the activity of creatine kinase and thus a decrease in PCr concentration would equate to an equivalent increase in Cr concentration. For short durations of occlusion, PCr and thus Cr levels were relatively unaffected. This is seen in Figure 3a which shows a stacked plot of every 31P MRS spectra acquired with a 12 second temporal resolution at baseline, during cuff inflation and following cuff release. This is further exhibited the plot of the normalized PCr peak integral from 31P MR spectra as a function of time in Figure 3b. During reactive hyperemia following cuff deflation, a less than 3% change in the area of the PCr peak (<1 mM Δ[PCr]) was observed24. In addition, there was no shift in the inorganic phosphate (Pi) peak indicating that there were negligible changes in muscle pH, which could also confound CrCEST measurements.
Figure 3.
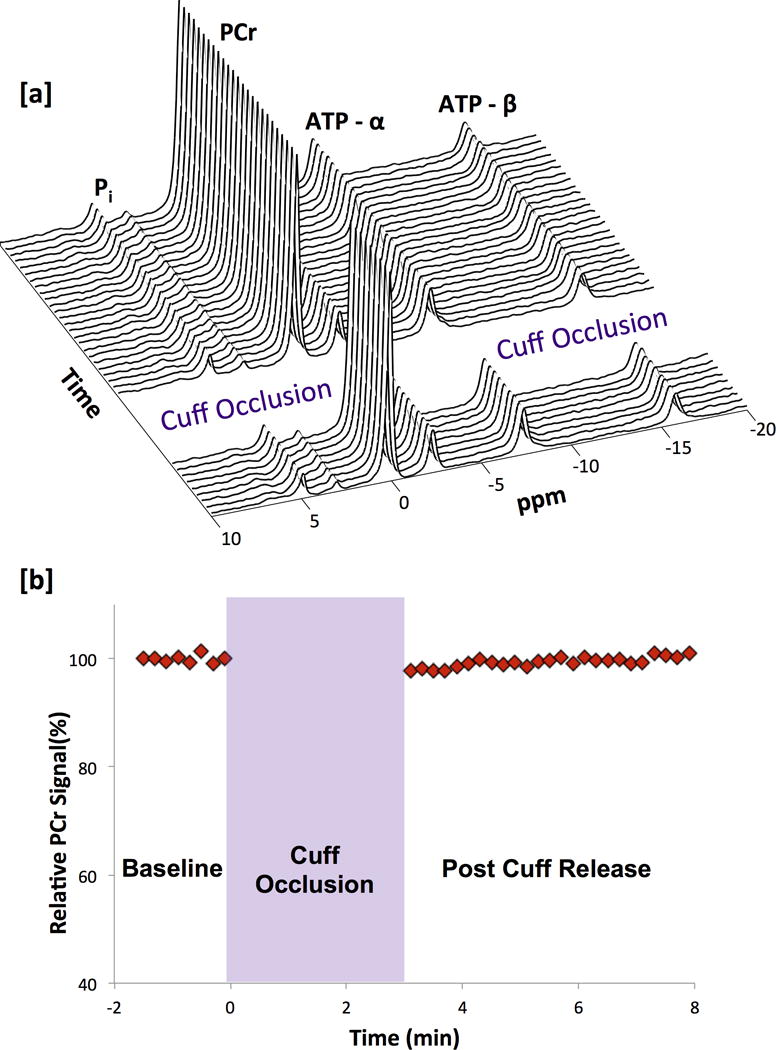
(a) Stacked plot of every 31P MRS spectra acquired with a 12 second temporal resolution at baseline, during cuff inflation and following cuff release. (b) 31P MRS PCr signal integral as a function of time from 31P MRS spectra acquired with a temporal resolution of 12 seconds.
Figure 4 shows CrCESTasym, ASL mean percent difference, and relative PCr peak integral values at baseline, immediately following cuff deflation and 5 min post cuff deflation for each of the 5 subjects. For CrCESTasym and ASL mean percent difference measurements, a central region of interest between the gastrocnemius and soleus muscles away from any major vessels was used. Error bars represent the standard deviations of measurements in the region of interest. As expected, a significant increase in perfusion was observed between baseline and cuff deflation (p=0.003) and decrease between cuff deflation and 5 minutes post cuff deflation (p=0.005) across all subjects as measured by ASL mean percent difference. However, differences in CrCESTasym and PCr peak area observed across subjects immediately after cuff release compared to those made at baseline and 5 minutes after cuff release (Baseline vs. Peak Hyperemia and Peak Hyperemia vs. Recovery) were not significant (for CrCESTasym p=0.28 and p=0.41, respectively, and for PCr peak area p=0.16 and p=0.10, respectively). Additionally, no significant differences were observed between measurements of ASL mean percent difference, CrCESTasym or PCr at baseline and 5 minutes after cuff release (Baseline vs Recovery) (p=0.81, p=0.63, p=.60, respectively). Further, exact Kruskal-Wallis tests stratified by subject showed that ASL measurements of perfusion changed significantly over time (P=0.008) while CrCESTasym and PCr peak measurement did not (p= 0.97 and p= 0.15, respectively).
Figure 4.
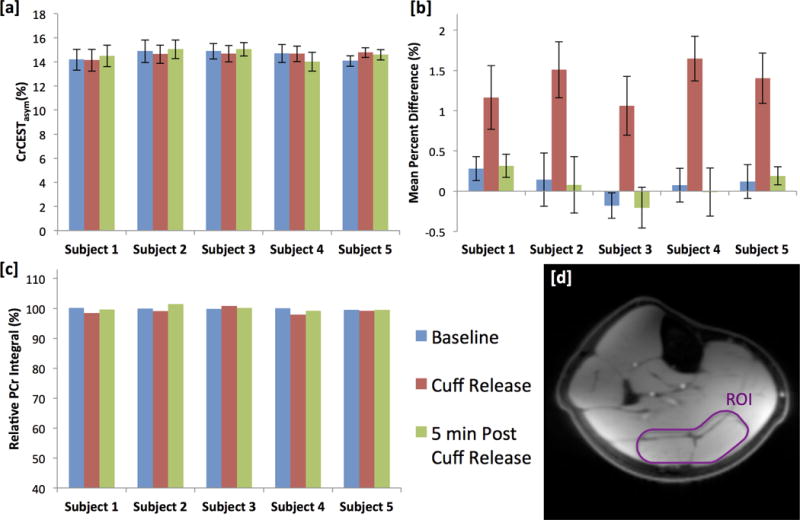
(a) CrCESTasym, (b) ASL mean percent difference, and (c) relative PCr peak integral values at baseline, immediately following cuff deflation and 5 min post cuff deflation for each of the 5 subjects. (d) Anatomical image of the lower leg. CrCESTasym and ASL mean percent difference measurements were calculated as an average from values in a region of interest (ROI) [outlined in white] for the gastrocnemius and soleus muscles chosen to correspond to the localization of the 31P surface coil which was away from any major vessels. Error bars represent the standard deviation in the CrCESTasym and ASL mean percent difference in the ROI.
Discussion
In this study, reactive hyperemia was used to demonstrate that the impact of perfused blood on muscle CrCEST asymmetry are negligible. The observed increase in tissue perfusion with reactive hyperemia is expected to be larger than or equal to the perfusion response in exercise studies25. Therefore, although exercise leads to an increase in both CESTasym and tissue perfusion in exercised muscle, any perfusion effects with exercise likely do not appreciably confound observed CrCEST effects. These findings are relevant for faster exchanging labile protons such as amine protons which require a larger saturation amplitude such as the one used in this work. Further studies need to be conducted on the effect of perfusion on slower exchanging spins such as amide protons where a smaller saturation amplitude and longer duration are generally utilized.
Other potential confounders to the CrCEST effect in mild plantar flexion exercise including changes of cellular pH, water content, and other metabolites have been previously reported at 7T15. Muscle pH is not expected to change for short durations of occlusion, as used in this study, and this is supported by 31P MRS findings, which showed negligible differences in the shape or position of the Pi peak. Increases in muscle signal intensity reflecting elevated water content due to increased perfusion may be observed in base CEST images. However, for small changes in hydration, this signal enhancement is largely equivalent in +Δω and -Δω frequency saturation images and will be subtracted out in the asymmetry analysis9.
Cuff inflation and deflation did result in notable changes in the signal from blood in the large vessels. Retrograde flow in the large vessels of the lower leg could lead to differences in saturation of labile protons and bulk water, which would result in inaccuracies of CEST asymmetry analysis. Furthermore, inhomogeneities from flow effects could confound the measurement, thus areas near these large vessels were avoided in our analysis. The large vessels supplying muscle in the leg are located centrally, not within the major muscles of the lower leg, therefore avoidance of regions surrounding the feeding vessels is not expected to be a limitation of this investigation.
It should be noted that the 31P signal was localized only by the position of the 31P surface coil and as a result was not obtained from the identical region as CEST data but rather from part of the gastrocnemius and soleus muscles from a large area of the calf, similar to previous studies15. Thus, comparisons made between CrCESTasym and 31P MRS are rough estimates. Nonetheless, changes in both the CrCESTasym and 31P MRS PCr signal were not significant between the baseline and reactive hyperemia periods. It should also be noted that measurements of perfusion with ASL mean percent difference were calculated with a 32 second effective temporal resolution for comparison with the temporal resolution used for acquisition of CrCESTasym maps. This likely underestimated the peak perfusion during reactive hyperemia. However, as we are not interested in the physiologic response of blood flow but rather whether blood flow changes impact CrCESTasym measurement, we felt it was more appropriate to use similar temporal resolution for both measurements. Measurements of perfusion were used primarily to show that cessation of induced ischemia resulted in an expected increase in tissue perfusion. Lastly, CEST, ASL and 31P MRS data were acquired in separate cuff occlusion trials and subtle differences in perfusion and muscle changes between trials could also have occurred. Nevertheless, any such variances are expected to be small26, as occlusion was relatively short and subjects were healthy volunteers.
In summary, this work demonstrated that measurements of CrCESTasym at 7T in skeletal muscle following induced ischemia are not confounded by perfusion effects, suggesting that blood flow alone does not contribute to CrCESTasym changes following exercise. The CrCEST approach has the potential to provide key information about primary disorders of muscle metabolism as well as the secondary complications of muscle metabolism associated with other pathologies.
Acknowledgments
We gratefully acknowledge A. Bonner for his help in designing and building the 31P MRS coil setup. We thank Dr. Jarrett Rosenberg for his aid with statistics in this project. This work was supported by a NIBIB supported resources center grants P41EB015893, P41EB015893S1, R01NS087516, R01EB002524, K24AR062068 and training grant T32EB009384.
Grant Support: P41EB015893; P41EB015893S1; R01NS087516; R01EB002524; K24AR062068; T32EB009384;
Abbreviations
- ATP
Adenosine triphosphate
- ASL
Arterial Spin Labeling
- CEST
Chemical Exchange Saturation Transfer
- CK
Creatine Kinase
- Cr
Creatine
- CrCEST
Chemical Exchange Saturation Transfer of Creatine
- FAIR
Flow-sensitive Alternating Inversion Recovery ASL
- Pi
Inorganic Phosphate
- PCr
Phosphocreatine
- WASSR
Water Saturation Shift Reference
References
- 1.Chance B, Williams GR. RESPIRATORY ENZYMES IN OXIDATIVE PHOSPHORYLATION .3. THE STEADY STATE. Journal of Biological Chemistry. 1955;217(1):409–427. [PubMed] [Google Scholar]
- 2.Davies RE. A MOLECULAR THEORY OF MUSCLE CONTRACTION - CALCIUM-DEPENDENT CONTRACTIONS WITH HYDROGEN BOND FORMATION PLUS ATP-DEPENDENT EXTENSIONS OF PART OF MYOSIN-ACTIN CROSS-BRIDGES. Nature. 1963;199(489):1068–&. doi: 10.1038/1991068a0. [DOI] [PubMed] [Google Scholar]
- 3.Hoult DI, Busby SJW, Gadian DG, Radda GK, Richards RE, Seeley PJ. OBSERVATION OF TISSUE METABOLITES USING P-31 NUCLEAR MAGNETIC-RESONANCE. Nature. 1974;252(5481):285–287. doi: 10.1038/252285a0. [DOI] [PubMed] [Google Scholar]
- 4.Moon RB, Richards JH. Determination of intracellular pH by 31P magnetic resonance. J Biol Chem. 1973;248(20):7276–7278. [PubMed] [Google Scholar]
- 5.Matthews PM, Allaire C, Shoubridge EA, Karpati G, Carpenter S, Arnold DL. INVIVO MUSCLE MAGNETIC-RESONANCE SPECTROSCOPY IN THE CLINICAL INVESTIGATION OF MITOCHONDRIAL DISEASE. Neurology. 1991;41(1):114–120. doi: 10.1212/wnl.41.1.114. [DOI] [PubMed] [Google Scholar]
- 6.Tarnopolsky MA, Parise G. Direct measurement of high-energy phosphate compounds in patients with neuromuscular disease. Muscle & Nerve. 1999;22(9):1228–1233. doi: 10.1002/(sici)1097-4598(199909)22:9<1228::aid-mus9>3.0.co;2-6. [DOI] [PubMed] [Google Scholar]
- 7.Yabe T, Mitsunami K, Inubushi T, Kinoshita M. QUANTITATIVE MEASUREMENTS OF CARDIAC PHOSPHORUS METABOLITES IN CORONARY-ARTERY DISEASE BY P-31 MAGNETIC-RESONANCE SPECTROSCOPY. Circulation. 1995;92(1):15–23. doi: 10.1161/01.cir.92.1.15. [DOI] [PubMed] [Google Scholar]
- 8.WOLFF S, BALABAN R. NMR IMAGING OF LABILE PROTON-EXCHANGE. Journal of Magnetic Resonance. 1990:164–169. [Google Scholar]
- 9.Zhou J, van Zijl P. Chemical exchange saturation transfer imaging and spectroscopy. Progress in Nuclear Magnetic Resonance Spectroscopy. 2006:109–136. doi: 10.1016/j.pnmrs.2020.06.001. [DOI] [PubMed] [Google Scholar]
- 10.van Zijl PCM, Yadav NN. Chemical Exchange Saturation Transfer (CEST): What is in a Name and What Isn’t? Magnetic Resonance in Medicine. 2011;65(4) doi: 10.1002/mrm.22761. [DOI] [PMC free article] [PubMed] [Google Scholar]
- 11.Ward K, Aletras A, Balaban R. A new class of contrast agents for MRI based on proton chemical exchange dependent saturation transfer (CEST) Journal of Magnetic Resonance. 2000:79–87. doi: 10.1006/jmre.1999.1956. [DOI] [PubMed] [Google Scholar]
- 12.Kogan F, Hariharan H, Reddy R. Chemical Exchange Saturation Transfer (CEST) Imaging: Description of Technique and Potential Clinical Applications. Current Radiology Reports. 2013:1–13. doi: 10.1007/s40134-013-0010-3. [DOI] [PMC free article] [PubMed] [Google Scholar]
- 13.Haris M, Nanga RP, Singh A, Cai K, Kogan F, Hariharan H, Reddy R. Exchange rates of creatine kinase metabolites: feasibility of imaging creatine by chemical exchange saturation transfer MRI. NMR Biomed. 2012;25(11):1305–1309. doi: 10.1002/nbm.2792. [DOI] [PMC free article] [PubMed] [Google Scholar]
- 14.Kogan F, Haris M, Debrosse C, Singh A, Nanga RP, Cai K, Hariharan H, Reddy R. In vivo chemical exchange saturation transfer imaging of creatine (CrCEST) in skeletal muscle at 3T. J Magn Reson Imaging. 2014;40(3):596–602. doi: 10.1002/jmri.24412. [DOI] [PMC free article] [PubMed] [Google Scholar]
- 15.Kogan F, Haris M, Singh A, Cai K, Debrosse C, Nanga RP, Hariharan H, Reddy R. Method for high-resolution imaging of creatine in vivo using chemical exchange saturation transfer. Magn Reson Med. 2014;71(1):164–172. doi: 10.1002/mrm.24641. [DOI] [PMC free article] [PubMed] [Google Scholar]
- 16.Zheng S, van der Bom IM, Zu Z, Lin G, Zhao Y, Gounis MJ. Chemical exchange saturation transfer effect in blood. Magn Reson Med. 2014;71(3):1082–1092. doi: 10.1002/mrm.24770. [DOI] [PubMed] [Google Scholar]
- 17.Duteil S, Wary C, Raynaud JS, Lebon V, Lesage D, Leroy-Willig A, Carlier PG. Influence of vascular filling and perfusion on BOLD contrast during reactive hyperemia in human skeletal muscle. Magn Reson Med. 2006;55(2):450–454. doi: 10.1002/mrm.20760. [DOI] [PubMed] [Google Scholar]
- 18.Andreas M, Schmid AI, Keilani M, Doberer D, Bartko J, Crevenna R, Moser E, Wolzt M. Effect of ischemic preconditioning in skeletal muscle measured by functional magnetic resonance imaging and spectroscopy: a randomized crossover trial. J Cardiovasc Magn Reson. 2011;13:32. doi: 10.1186/1532-429X-13-32. [DOI] [PMC free article] [PubMed] [Google Scholar]
- 19.Detre JA, Leigh JS, Williams DS, Koretsky AP. Perfusion imaging. Magn Reson Med. 1992;23(1):37–45. doi: 10.1002/mrm.1910230106. [DOI] [PubMed] [Google Scholar]
- 20.Kim SG. Quantification of relative cerebral blood flow change by flow-sensitive alternating inversion recovery (FAIR) technique: application to functional mapping. Magn Reson Med. 1995;34(3):293–301. doi: 10.1002/mrm.1910340303. [DOI] [PubMed] [Google Scholar]
- 21.Kim M, Gillen J, Landman B, Zhou J, van Zijl P. Water Saturation Shift Referencing (WASSR) for Chemical Exchange Saturation Transfer (CEST) Experiments. Magnetic Resonance in Medicine. 2009:1441–1450. doi: 10.1002/mrm.21873. [DOI] [PMC free article] [PubMed] [Google Scholar]
- 22.Singh A, Cai K, Haris M, Hariharan H, Reddy R. On B1 inhomogeneity correction of in vivo human brain glutamate chemical exchange saturation transfer contrast at 7T. Magn Reson Med. 2013;69(3):818–824. doi: 10.1002/mrm.24290. [DOI] [PMC free article] [PubMed] [Google Scholar]
- 23.Liu G, Gilad AA, Bulte JWM, van Zijl PCM, McMahon MT. High-throughput screening of chemical exchange saturation transfer MR contrast agents. Contrast Media & Molecular Imaging. 2010;5(3) doi: 10.1002/cmmi.383. [DOI] [PMC free article] [PubMed] [Google Scholar]
- 24.Kemp GJ, Meyerspeer M, Moser E. Absolute quantification of phosphorus metabolite concentrations in human muscle in vivo by P-31 MRS: a quantitative review. Nmr in Biomedicine. 2007;20(6):555–565. doi: 10.1002/nbm.1192. [DOI] [PubMed] [Google Scholar]
- 25.Lopez D, Pollak AW, Meyer CH, Epstein FH, Zhao L, Pesch AJ, Jiji R, Kay JR, DiMaria JM, Christopher JM, Kramer CM. Arterial spin labeling perfusion cardiovascular magnetic resonance of the calf in peripheral arterial disease: cuff occlusion hyperemia vs exercise. J Cardiovasc Magn Reson. 2015;17:23. doi: 10.1186/s12968-015-0128-y. [DOI] [PMC free article] [PubMed] [Google Scholar]
- 26.Englund EK, Langham MC, Li C, Rodgers ZB, Floyd TF, Mohler ER, Wehrli FW. Combined measurement of perfusion, venous oxygen saturation, and skeletal muscle T2* during reactive hyperemia in the leg. J Cardiovasc Magn Reson. 2013;15:70. doi: 10.1186/1532-429X-15-70. [DOI] [PMC free article] [PubMed] [Google Scholar]