Abstract
Background
EEG interpretation relies on experts who are in short supply. There is a great need for automated pattern recognition systems to assist with interpretation. However, attempts to develop such systems have been limited by insufficient expert-annotated data. To address these issues, we developed a system named NeuroBrowser for EEG review and rapid waveform annotation.
New Methods
At the core of NeuroBrowser lies on ultrafast template matching under Dynamic Time Warping, which substantially accelerates the task of annotation.
Results
Our results demonstrate that NeuroBrowser can reduce the time required for annotation of interictal epileptiform discharges by EEG experts by 20–90%, with an average of approximately 70%.
Comparison with Existing Method(s)
In comparison with conventional manual EEG annotation, NeuroBrowser is able to save EEG experts approximately 70% on average of the time spent in annotating interictal epileptiform discharges. We have already extracted 19,000+ interictal epileptiform discharges from 100 patient EEG recordings. To our knowledge this represents the largest annotated database of interictal epileptiform discharges in existence.
Conclusion
NeuroBrowser is an integrated system for rapid waveform annotation. While the algorithm is currently tailored to annotation of interictal epileptiform discharges in scalp EEG recordings, the concepts can be easily generalized to other waveforms and signal types.
Keywords: EEG, Interictal discharges, Spikes, Graphical user interface, Rapid annotation, Template matching, Dynamic Time Warping
1. Introduction
Epilepsy refers to a group of chronic brain disorders characterized by recurrent unprovoked seizures. Epilepsy affects approximately 65 million people worldwide (Epilepsy Foundation of America, 2014). Electroencephalography (EEG) is an electrophysiological monitoring method to record the electrical activity of the brain, measuring voltage fluctuations resulting from ionic current within the neurons of the brain (Niedermeyer and da Silva, 2005). Both excitatory postsynaptic potentials and inhibitory postsynaptic potentials in cortical pyramidal cells contribute to the synaptic activity recorded as EEG (Olejniczak, 2006). EEG provides a continuous measure of cortical function with excellent temporal resolution.
Significant efforts (manpower, money, and time) are spent on interpreting EEG data for clinical purposes. Approximately 10–25 million EEG tests are performed annually worldwide (Encyclopedia of Surgery, 2014). The duration of EEG recordings ranges from 30 minutes to several weeks. While in current clinical practice, visual inspection and manual annotation are still the gold standard for interpreting EEG, this process is tedious and ultimately subjective. For instance, the agreement rate for interictal discharges has been found as low as 60% between electroencephalographers for certain cases (Wilson and Emerson, 2002). Moreover, experienced electroencephalographers are in short supply (Racette et al., 2014). Therefore, a great need exists for automated systems for EEG interpretation.
The finding of primary importance for the diagnosis for epilepsy is the presence of interictal discharges, encompassing spikes, polyspikes, sharp waves and spike-wave complexes. The International Federation of Societies for Electroencephalography and Clinical Neuro-physiology (IFSECN) describes spikes as a subcategory of “epileptiform pattern”, in turn defined as “distinctive waves or complexes, distinguished from background activity, and resembling those recorded in a proportion of human subjects suffering from epileptic disorders…” (Chatrian et al., 1974). Spikes are the key diagnostic biomarker for epilepsy. The presence of spikes predicts seizure recurrence (van Donselaar et al., 1992), and allows a physician to make a confident diagnosis of epilepsy and to prescribe appropriate treatment (van Donselaar et al., 1992; Fountain and Freeman, 2006; Pillai and Sperling, 2006). In practice, physicians detect spikes by visually inspecting 10–20 second-long of an EEG signal at a time. Spike detection is difficult, due to: (i) the wide variety of morphologies of spikes (Fig. 1), and (ii) the similarity of spikes to waves that are part of the normal background activity and to artifacts, e.g., potentials from muscle, eyes, and the heart.
Figure 1.
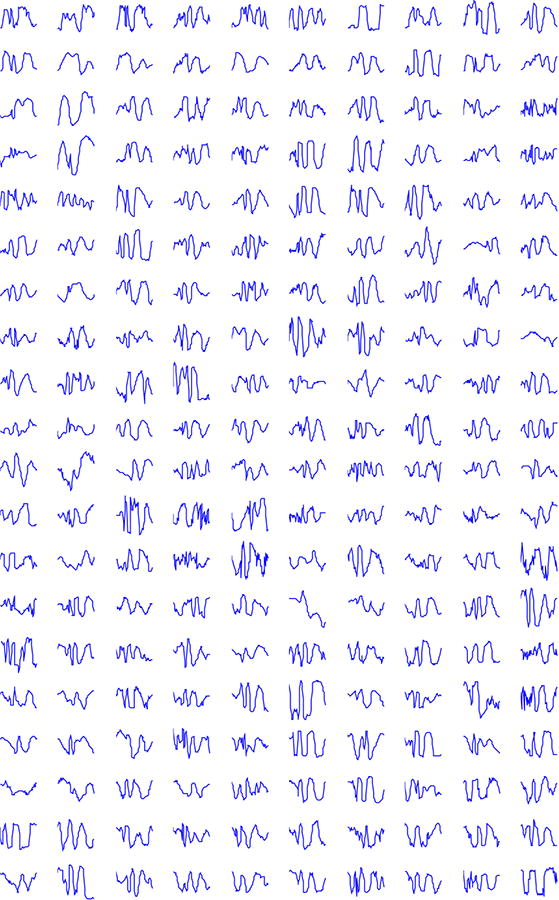
200 spikes chosen at random from the database of 19,000+ spikes of 100 patients. Clearly a large variability exists in the morphology of the spikes.
Automated spike detection would be faster, less expensive, more objective, and potentially more accurate. Automated spike detection would enable wider availability of EEG diagnostics and more rapid referral to qualified physicians who can provide further medical investigation and interventions. However, spikes are difficult to detect in an automated manner due to the large variability of spike waveforms within and between patients among other factors. As illustrated in Table 1, attempts have been made to create automatic spike detection systems. Unfortunately, these methods have not been validated on a large dataset and consequently are not universally accepted. One of the most critical hurdles to developing an effective algorithm for spike detection is the lack of a sufficiently large database of expert-annotated spike waveforms.
Table 1.
Spike detection methods.
| Literature Index | Patient Number | Spike Count |
|---|---|---|
| 1 (Witte et al., 1991) | 1 | 50 |
| 2 (Gabor and Seyal, 1992) | 5 | 752 |
| 3 (Gotman and Wang, 1992) | 20 | Unknown |
| 4 (Hostetler et al., 1992) | 5 | 1,393 |
| 5 (Sankar and Natour, 1992) | 11 | Unknown |
| 6 (Pietilä et al., 1994) | 6 | Unknown |
| 7 (Webber et al., 1994) | 10 | 927 |
| 8 (Senhadji et al., 1995) | 1?c | 982 |
| 9 (Feucht et al., 1997) | 3 | 1,509 |
| 10 (Park et al., 1997) | 32 | n.a.d |
| 11 (Özdamar and Kalayci, 1998) | 5 | n.a.d |
| 12 (Dümpelmann and Elger, 1999) | 7 | 2,329 |
| 13 (Hellmann, 1999) | 10 | n.a.d |
| 14 (Ramabhadran et al., 1999) | 6/18 | ?c/982 |
| 15 (Wilson et al., 1999) | 50 | 1,952 |
| 16 (Black et al., 2000) | 521 | Unknown |
| 17 (Goelz et al., 2000) | 11 | 298 |
| 18 (Acir and Güzeliş, 2004) | 18/7 | Unknown/139 |
| 19 (Xu et al., 2007) | 12 | 957 |
| 20 (Oikonomou et al., 2007) | 13 | 333 |
| 21 (Ji et al., 2011) | 17 | >780 |
| 22 (Liu et al., 2013) | 12 | 142 |
| 23 (Lodder and van Putten, 2014) | 8 | 2,973 |
Total number of spikes not known. Algorithm detections reviewed after processing.
N/N format is applied when both training and test sets exist.
A “?” after a value denotes uncertainty.
The “n.a.” values indicate that the data was presented in a non-standard manner that precluded comparison.
The brute-force approach to generating such a database is to manually annotate numerous EEG records. However, exhaustive manual annotation of spikes is prohibitively time-consuming, especially for EEG recordings with large numbers of spikes (up to thousands per hour). The time and labor required severely limits the willingness of EEG experts to help establish a large database of annotated spikes. At present, no technology exists to enable rapid waveform annotation in EEG recordings.
In this paper, we describe a new system that dramatically accelerates the process of acquiring expert-annotated EEG records. This system, named NeuroBrowser, includes a graphical user interface designed for EEG review and rapid waveform annotation. The algorithm underlying NeuroBrowser is based on the observation that, within the same patient, spikes typically share a similar morphology (as shown in Fig. 2). With suitable choice of similarity measure and spike templates, it is possible to extract many more similar candidate waveforms from the same EEG record in less time. Rather than annotating one spike at the time, groups of spikes (typically 10–100 spikes) can be annotated by template matching, accelerating the annotation process.
Figure 2.
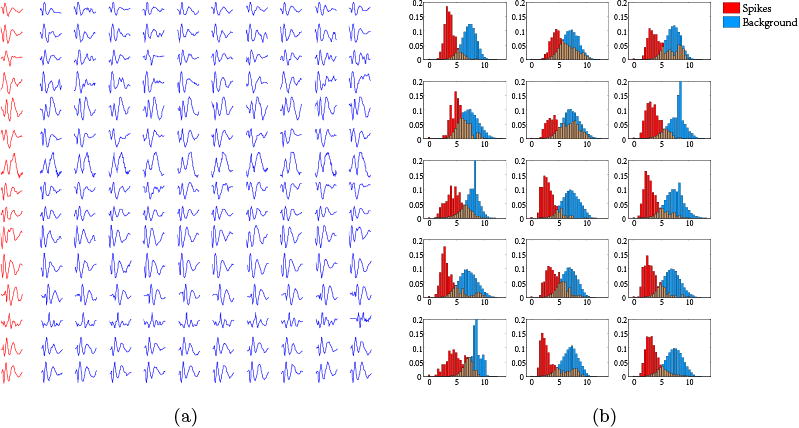
(a) Spike waveforms: each row presents 10 spikes (blue) extracted using a spike template (red) from the EEG recording of one out of 15 patients. For each patient, the spike waveforms have morphology similar to the template. (b) Dynamic Time Warping distance of spikes (red) and background EEG (blue) extracted from the EEG recordings of these 15 patients. The histograms are normalized to sum to one. The X-axis corresponds to the DTW distance. The Y-axis shows the normalized counts.
NeuroBrowser includes a fully functional EEG viewer plus a custom-built algorithm for template matching to enable rapid waveform annotation. In earlier work (Jing et al., 2014), we applied the Euclidean Distance (ED) as the similarity measure. However, the ED is sensitive to small variations in waveforms, and often fails to “match” waveforms that share strong morphological similarity, limiting annotation speed.
In this study, we consider a more powerful similarity measure: Dynamic Time Warping (DTW) (Keogh and Ratanamahatana, 2005; Müller, 2007). It is a distance measure that permits non-linear distortion so as to achieve better waveform alignments. Specifically, a modification of the Trillion algorithm from the UCR (University of California, Riverside) suite (Rakthanmanon et al., 2012) is employed here for rapid similarity search under DTW. Annotation speed is improved drastically as a result. A related system (hereafter referred to collectively simply as the “Self-Adapting System”) has been proposed in (Lodder and van Putten, 2014), which also integrates the concept of template matching together with user assessment to iteratively refine the detection results while populating the database of tem plates. The Self-Adapting System is not dependent on user-selected templates in the actual application, while for NeuroBrowser, the user does need to define a specific template for the EEG recording at hand. Rather than a specific template, the detection in Self-Adapting System is made based on the similarities in detected transients in naive EEGs that are subsequently compared to templates collected from other recordings. During user assessment, the system only shows the top 10 candidate spikes to the user that have the best agreement with any of the templates in the database. After that, the system learns from the user, as he/she agrees, disagrees or is uncertain about the 10 candidates presented. In addition, correlation is used as the similarity measure in Self-Adapting System, and the candidate spikes are assessed by the user one at a time. By contrast, we achieve much faster assessment by a variety of strategies, including preprocessing, DTW, and clustering of spikes.
Our experimental results show that NeuroBrowser is able to save EEG experts an average of approximately 70% of the time spent on annotating spikes, relative to conventional unassisted annotation. A database of 19,000+ spikes from 100 patient EEG recordings is constructed with NeuroBrowser. Each EEG was cross-annotated by 3 neurologists at Massachusetts General Hospital (MGH), and we only consider spikes that are accepted by at least 2 neurologists. To our knowledge this represents the largest expert-annotated database of spikes in existence. While the algorithm is currently tailored to annotation of spikes in scalp EEG recordings, the concepts can be easily generalized to other waveforms and signal types.
This paper is organized as follows. In Section II, we discuss scalp EEG and the technical components of NeuroBrowser. In Section III, we demonstrate the features and functions of NeuroBrowser for EEG review and rapid waveform annotation. In Section IV, we describe annotation experiments designed to measure the potential time savings achievable by NeuroBrowser. In Section V, we discuss the advantages and limitations of NeuroBrowser, and offer concluding remarks and recommendations for future research.
2. Methods
2.1. Clinical EEG Data
We consider EEG data from 100 patients with known epilepsy at Massachusetts General Hospital (MGH). Each EEG recording lasts approximately 30 minutes and is recorded from 19 scalp electrodes arranged according to the standard international 10–20 system (see Fig. 3a). All EEG records contain spike events, with spike counts ranging from several to thousands of spikes. All EEG records were down-sampled to 128Hz. This step reduces computational complexity without compromising the ability to visually identify spikes. A digital high-pass filter with cutoff frequency of 0.1Hz and a notch filter at 60Hz were applied to remove artifacts such as baseline drift and power-line interference.
Figure 3.
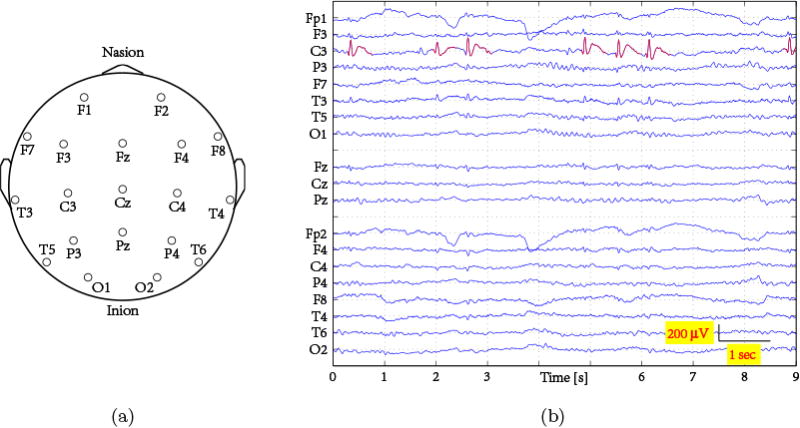
Epileptiform EEG in this study: (a) electrodes placed according to the 10–20 system on a 2-dimensional human scalp (top-view); (b) 9 seconds sample from a 19-channel EEG of a subject with epilepsy. Spikes are highlighted in red.
2.2. Rapid Waveform Annotation
NeuroBrowser utilizes fast matching to user-selected templates to enable rapid waveform annotation. NeuroBrowser's template matching algorithm is based on Dynamic Time Warping (DTW) as a similarity measure. While DTW is traditionally considered too computationally intensive for real-time applications, we overcome this challenge by taking advantage of a recent breakthrough, the Trillion algorithm, that enables ultra-fast DTW-based similarity search. An implementation of the Trillion algorithm is publicly available in the UCR suite (Rakthanmanon et al., 2012).
In this work we used a custom-modified version of the core Trillion algorithm. NeuroBrowser is semi-automated as illustrated in Fig. 4, in the sense that users are actively involved in 2 types of tasks: (i) the user needs to provide templates for DTW-based matching via manual annotation; (ii) the user needs to accept or reject the suggested matches. More specifically, the user is required to determine whether the suggested waveforms are indeed spikes. Several strategies have been implemented in NeuroBrowser to further improve the efficiency of the matching procedure, as we explain in the following sections.
Figure 4.
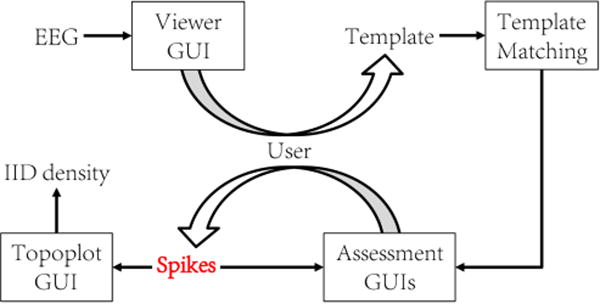
The block diagram of the NeuroBrowser system.
2.2.1. Template matching via DTW
We begin by defining the data type of interest, time series: A time series T is an ordered list of data points of length N: T = t1, t2, …, tN. While the source data T is one long time series, we ultimately wish to compare it to shorter segments called subsequences: A subsequence Ti,n of a time series T is a shorter time series starts from position i with a length of n, i.e., Ti,n = ti, ti,+i, …, ti+n−1, 1≤i≤N−n+1. Where there is no ambiguity, we may refer to subsequence Ti,n as C, as in a Candidate match to a Query Q of length n. The Euclidean distance (ED) between Q and C, with the same length n, is defined as:
| (1) |
We illustrate these definitions in Fig. 5.
Figure 5.

A long time series T can have a subsequence Ti,n extracted and compared to a query Q under the Euclidean distance, which is simply the square root of the sum of the squared hatch line lengths (Rakthanmanon et al., 2012).
In earlier study (Jing et al., 2014), we applied the Euclidean distance (ED) as a similarity measure for template matching. The larger the distance ED, the lower the similarity between the two time series. The ED is based on a simple one-to-one alignment of waveforms that can be computed rapidly. However, a major problem with ED is the high sensitivity to small variations in the morphology of the waveforms. As illustrated in Fig. 6a, ED fails to emphasize the essential morphological features of a spike such as the sharp contour. This leads to false recommendations where, relative to a given spike template Q, the non-spike C1 is ranked closer in similarity than the spike C2. Consequently the non-spike C1 must be rejected by the user and the spike C2 must be annotated manually at a later stage, slowing down the annotation process. While additional enhancements are able to compensate (Jing et al., 2014), these limitations of ED-based template matching ultimately motivated us to further improve the method by moving to DTW-based similarity search.
Figure 6.
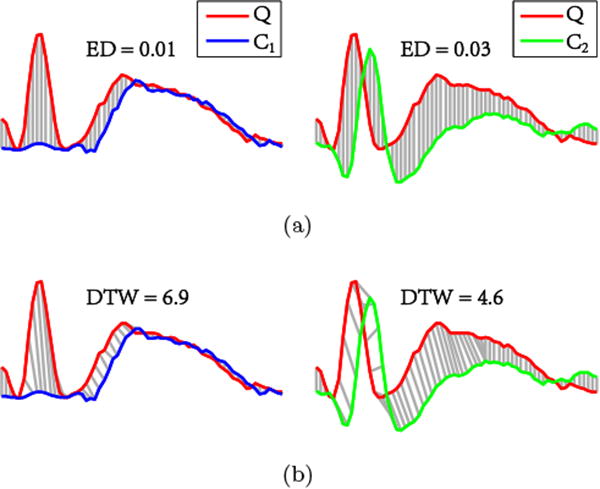
Matching by means of ED and DTW: (a) Matching according to ED: non-spike C1 is more similar to spike template Q than spike C2. (b) Matching according to DTW: spike C2 is more similar to spike template Q than non-spike C1. Therefore, DTW is a more suitable similarity measure for matching spike templates.
In this study, we replace ED by the Dynamic Time Warping (DTW) distance. DTW permits non-linear distortion of the time axis to achieve better waveform alignments (see Fig. 6b). The larger the DTW distance, the lower the similarity between the two time series. In DTW, segments of a time series are aligned with segments of another time series, effectively allowing for matching similar waveforms in spite of small local dilations and stretches of the time axis. DTW first became popular in the speech recognition community, where it has been used to determine whether two speech waveforms represent the same underlying spoken phrase (Sakoe and Chiba, 1978). Since then it has been adopted in many other areas, becoming the similarity metric of choice in many time series analysis applications (Keogh and Pazzani, 2000).
To align two time series Q = q1, q2, …, qn and C = c1, c2, …, cn, a warping matrix D ∈ ℝn2 is constructed whose entries Di,j are the following:
| (2) |
The optimal warping path (the path marked by blue squares in Fig. 7b) is obtained within the region constrained by the Sakoe-Chiba Band (Sakoe and Chiba, 1978) with a width of R (typically set to 10% of the signal's length), i.e., the pair of black lines parallel to the diagonal as shown in Fig. 7b.
Figure 7.
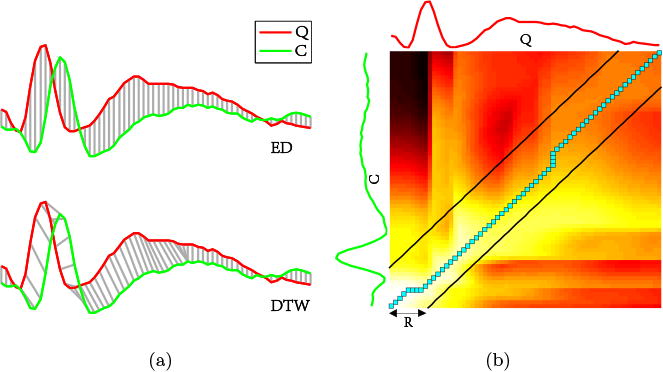
(a) Alignments between two time series by means of ED and DTW respectively; (b) DTW matrix with the optimal warping path (solid blue squares) obtained by applying the Sakoe-Chiba band with a width of R.
2.2.2. The UCR suite: Rapid similarity search under DTW
Similarity search is a common subroutine of data mining algorithms dealing with time series problems. Consequently, the time cost for similarity search is the most common computational bottleneck for virtually all time series data mining algorithms. In spite of dozens of alternatives, there is increasing empirical evidence that the classic DTW measure is the most similarity measure suitable in many domains (Ding et al., 2008).
Although DTW yields good matches, it is computationally expensive and thus conventionally slow (Alon et al., 2009; Chadwick et al., 2011). The UCR suite draws on four ideas to massively reduce the computational complexity and increase the speed of DTW. As a result, DTW can now be applied to massive datasets, including the EEG data in the present study. The four key ideas in the UCR suite to substantially reduce the computational complexity of DTW are:
-
Early abandoning z-normalization
A classic technique to speed up sequential search with an expensive distance measure such as DTW is to use a cheap-to-compute lower bound to prune off unpromising candidates (Ding et al., 2008; Keogh et al., 2009). The idea here is to interleave early abandoning calculations of the lower bound with online z-normalization to optimize the normalization step. In other words, as we incrementally compute the z-normalization, we can also incrementally compute the lower bound of the same data point. Thus, if we can abandon this computation early, we have pruned not only the distance calculation, but also the normalization steps.
In similarity search, each subsequence needs to be normalized first. The mean μ of the subsequence C can be obtained by keeping two running sums of the long time series T, which have a lag of exactly m values. The standard deviation σ of the subsequence C can be similarly computed. The formulas are given below for clarity:(3) Online normalization enables early abandoning of the distance computation of the lower bound in addition to the normalization. A high-level outline of the algorithm is shown in Table 2, where the online normalization in line 11 allows the early abandoning of the distance computation in addition to the normalization; X is a circular buffer to store the current subsequence being compared with the query Q.
-
Reordering early abandoning
Instead of the conventional left-to-right ordering to incrementally compute the distance, the UCR suite utilizes a universal optimal ordering. Fig. 8a shows the conventional left-to-right ordering, in which the early abandoning calculation proceeds. In this case, nine calculations were performed before the accumulated distance exceeded the threshold, and therefore we could abandon. In contrast, a different ordering is shown in Fig. 8b, which was able to abandon earlier with just five calculations.
It is conjectured that the universal optimal ordering is to sort the indices based on the absolute values of the z-normalized Q. The intuition behind this idea is that the value at Qi will be compared to many Ci values during a search. However, for subsequence search with z-normalized candidates, the distribution of many Ci values will be approximately Gaussian, with a mean of zero. Thus, sections of the query that are farthest from the zero mean will tend to have the largest contributions to the distance measure. This universal optimal ordering was validated by comparing it with the empirically determined optimal ordering, yielding a correlation value of 0.999.
-
Reversing the query/data role in lower bound computation
Usually, lower bounds are applied to build an envelope around the query Q, as illustrated in Fig. 9a. However, as discussed in the next section, envelopes can also be formed around the candidate C (see Fig. 9b), in a “just-in-time” fashion, to handle the scenario where all other bounds fail to further prune the candidate waveform. This removes the space overhead and, as we will see, the time overhead pays for itself by pruning more full DTW calculations.
-
Cascading lower bounds
An efficient strategy to speed up time series similarity search is to use lower bounds to admissibly prune off unpromising candidates. This has led to a flurry of investigations on lower bounds, with at least eighteen proposed lower bounds for DTW (Yi et al., 1998; Kim et al., 2001; Sakurai et al., 2005; Zinke and Mayer, 2006; Ding et al., 2008; Keogh et al., 2009; Zhang and Glass, 2011). The UCR suite applies all of these lower bounds in cascade. The algorithm first considers the O(l) lower bound LBKimFL, which uses the distances between the First (Last) pair of points from C and Q as a lower bound. It is a weak but fast-to-compute lower bound that prunes many candidates. If a candidate is not pruned at this stage, the O(n) lower bound LBKeoghEQ is considered, which uses the Euclidean distance between the query Q and the closer of its envelopes {U, L} as a lower bound. If we complete this lower bound without exceeding the best-so-far, we reverse the query/data role and compute lower bound LBKeoghEC, which uses the Euclidean distance between the candidate sequence C and the closer of its envelopes {U, L} as a lower bound. If this bound does not allow pruning, we start the early abandoning calculation of DTW.
Table 2.
Subsequence search with online z-normalization (Rakthanmanon et al., 2012).
| Algorithm Similarity Search | |
|---|---|
| Procedure [nn] = SimilaritySearch (T, Q) | |
| 1 | best-so-far←∞, counts←0 |
| 2 | Q←z-normalize(Q) |
| 3 | while !next(T) |
| 4 | i←mod(count,m) |
| 5 | X[i]←next(T) |
| 6 | ex←ex+X[i], ex2←ex2+X[i]2 |
| 7 | if count ≥m-l |
| 8 | μ←ex/m, σ←sqrt(ex2/m-μ2) |
| 9 | j←0, dist←0 |
| 10 | while j<m and dist<best-so-far |
| 11 | dist←dist+(Q[j]-(X[mod(i+l+j,m)]-μ)/σ)2 |
| 12 | j←j+1 |
| 13 | if dist<best-so-far |
| 14 | best-so-far←dist, nn←count |
| 15 | ex←ex-X[mod(i+l,m)] |
| 16 | ex2←ex2-X[mod(i+l,m)]2 |
| 17 | counts←count+1 |
Figure 8.

(a) Standard early abandon ordering from left to right, with 9 computations required before exceeding the best-so-far; (b) Different ordering allows abandon after just 5 calculations (Rakthanmanon et al., 2012).
Figure 9.

(a) Lower bound computed based on envelopes U and L around the query Q. (b) Reversing the roles of Q and C such that the envelopes U and L are built around the candidate C (Rakthanmanon et al., 2012).
2.2.3. Further efforts to improve time efficiency
Besides fast DTW template matching, multiple strategies are employed to further improve the time efficiency of template matching. First, while the Trillion algorithm available in the UCR suite finds the single best match to any given query waveform, NeuroBrowser uses a custom-modified version of Trillion (coded by author TR), which returns the top K matches. Second, as in previous work (Jing et al., 2014), we preprocess EEGs by down-sampling to 128Hz in order to reduce the computational complexity. This step was based on observations (of the authors MBW and SSC) that visual recognition of spikes in scalp EEG is uncompromised by subsampling to this level. Furthermore, DTW similarity search is limited to the same channel/electrode where the expert-selected spike template is located, based on the observation that within any given patient spikes with similar morphology tend to occur in the same spatial location. In addition, we carry out the following operations to improve time efficiency (in the flowchart in Fig. 10):
-
Overlap scan
We carry out post-processing steps to remove overlaps from waveform matches. The output from our customized version of the Trillion algorithm is a list of the top K similar waveforms, ranked according to their DTW values relative to a given template. However, there are typically numerous candidates with large overlaps, resulting from the fact that the UCR suite applies a sliding window when extracting waveform candidates. The sliding window has a length of n and movies 1 data point each time along the time series X = x1, x2, …,xN, with n being the length of the template, and N the length of the input EEG X. For instance, if the n-point candidate Xm = xm, xm+1, … , xm+n−1 has a high ranking in the list, it is very likely to find Xm±1 also in the list with similar rankings. To remove candidates with large overlaps, the list of waveforms is scanned from top to bottom. For each candidate, once it is found to have more than 32 data points (half of the window length) overlapping with any candidate possessing a higher ranking, it is discarded from the list. We set the value of DTW parameter K to be 1,000 at first. The overlap scan stops when there are h = 60 candidates with less than 32-point overlaps. If there are less than 60 candidates after scanning the list of all K =1,000 waveforms, we discard these 1,000 waveforms from the input EEG. We then select the next 1,000 DTW-based candidates and repeat the overlap scan to identify more candidates. Ultimately, this process yields at most h = 60 candidates with less than 32-point overlap, ready to be passed to the user for assessment.
-
Threshold on feature Vpp
As the Trillion algorithm also utilizes z-normalization, low amplitude spike candidates are often detected. However, these low amplitude spikes are often determined to be false detections by EEG experts. To eliminate those low amplitude false detections, the peak-to-trough value Vpp (see Fig. 11) is extracted from all 60 candidates after the overlap scan. A threshold is applied such that we only keep candidates with Vpp greater than the threshold, which takes the value of γ(Vpp)min, with γ = 95%, and (Vpp)min the minimum peak-to-trough voltage obtained from existing annotated spikes.
Please note that the values of the parameters K, h, and γ were selected by the neurologists for the purpose of convenience and easy implementation, which are also customizable.
-
User input to harvest spikes
The remaining candidates are grouped into clusters of 10 waveforms each (see Fig.13a and 13b), according to the characteristic Vpp. The user can then assess the waveforms in the different clusters. The user is given the option to accept an entire cluster at once as true spikes or, if some of the candidates in a cluster are not considered true spikes, the user can mark them accordingly.
Figure 10.
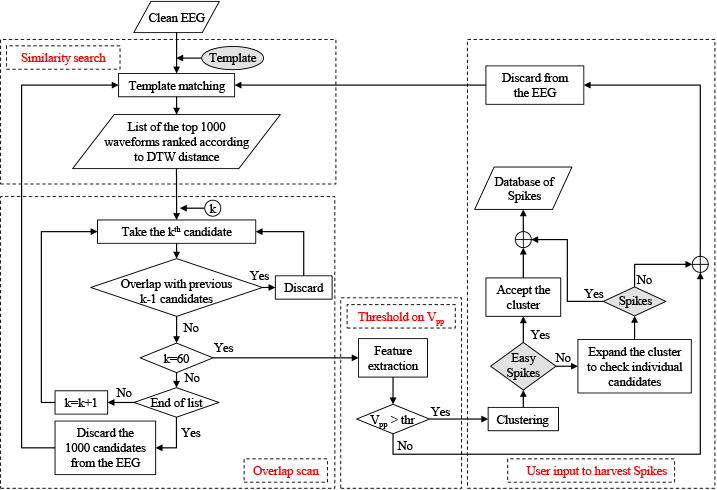
Flowchart of the proposed algorithm for rapid waveform annotation.
Figure 11.
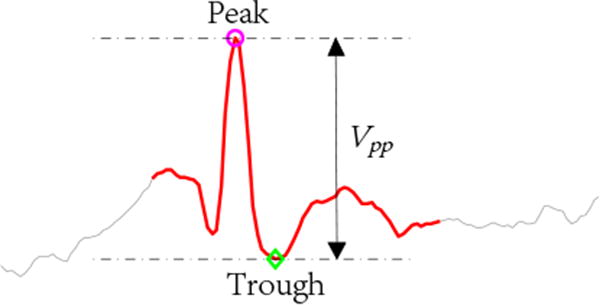
The peak-to-trough value Vpp of a spike.
Figure 13.
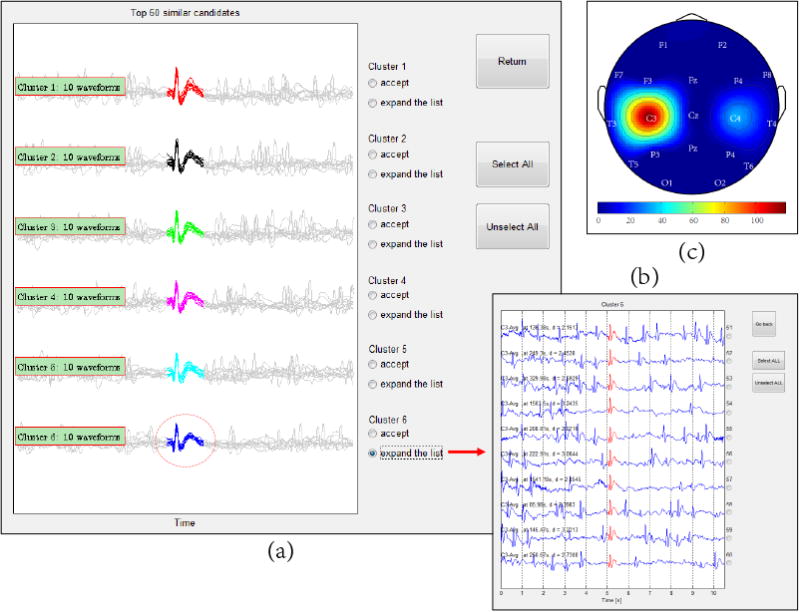
Modules for displaying candidate spikes to the user and collecting assessments from the user: (a) GUI where the top 60 candidate waveforms are displayed in clusters. The waveforms in each cluster are overlaid, since these waveforms are usually very similar. (b) Expanded list of candidate waveforms from a single cluster. (c) Spike density visualized on a topographic map.
3. The NeuroBrowser System
The current implementation of NeuroBrowser includes a MATLAB-based graphical user interface (GUI) designed for review of scalp EEG and rapid waveform annotation. NeuroBrowser consists of an EEG viewer, and three modules for providing candidate spikes to the user and collecting assessments from the user.
3.1. EEG viewer
As the name suggests, NeuroBrowser allows the user to display and navigate through EEG recordings (Fig. 12). NeuroBrowser offers various options to navigate rapidly along the time axis and to vary the display window duration. One can move forward and backward at a fixed step of 5 seconds (with inter-frame overlap) or 10 seconders (without overlap). One can also apply the time slider at the bottom of the GUI to swiftly-shift to any time point. An option is available for the user to navigate by spike events, such that the nearest spike annotated in time (“previous” or “next”) is displayed in the center of the screen.
Figure 12.
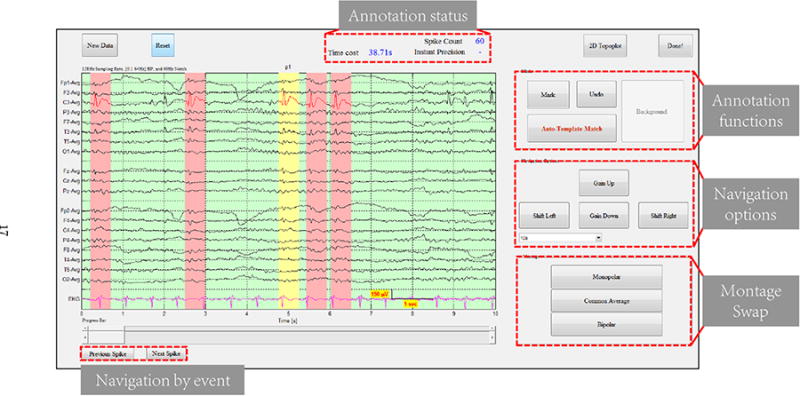
Screenshot of the viewer GUI of NeuroBrowser. The EEG recordings are displayed with existing markers if any; Spikes are labeled in red with pink background. Manual annotation can easily be done by left clicking on the target (right clicking to un-select). The current manually selected template is labeled in red with yellow background.
The gold standard for interpreting EEG in clinical practice is expert visual inspection. To support annotation, we have integrated functions for manual annotation into the EEG viewer. Selection/deletion of waveforms can be easily done by left/right clicking. Montage swap buttons enable easy switching among the three most commonly used referential schemes, i.e., mono-polar, common-average, and bipolar montage, catering to the needs of neurophysiologists to display EEG in different formats.
The main algorithm for rapid waveform annotation is activated by clicking the button labeled “Auto-Template Match”. NeuroBrowser utilizes the most recently annotated spike as the template, and executes the Trillion algorithm for rapid DTW searching. After processing the results (Fig. 10), the top 60 similar candidate waveforms are identified and ready for user assessment. In this assessment, the user is required to indicate which of these candidates are true spikes. Finally, spikes approved by the user are automatically indicated in the EEG by colored bars.
3.2. Modules for user input collection
To display the candidate spikes identified by DTW-based matching, and to collect assessments from the user, NeuroBrowser utilizes three sub-GUIs, as illustrated in Fig. 13. One sub-GUI shows the top 60 candidate waveforms in clusters (see Fig. 13a). The candidates are sorted into 6 clusters, according to the peak-to-trough value Vpp, with 10 waveforms per cluster. The waveforms in each cluster are overlaid, since these waveforms are usually very similar. The user can assess the waveforms cluster-by-cluster at a glance, and potentially accept an entire cluster as true spikes.
If the user wishes to see the waveforms in a cluster in more detail, NeuroBrowser allows the user to expand a cluster as shown in Fig. 13b, providing a list of the individual waveforms with detailed information to support the assessments, including both temporal and spatial coordinates, and 10s of context EEG. Another module displays the spike density on a topographic map (see Fig. 13c), showing the brain regions that exhibit spikes.
4. Results
We conducted annotation experiments to assess how much the NeuroBrowser system speeds up spike annotation. Two clinical neurophysiologists from MGH and one EEG expert from NTU were asked to annotate 5 EEG records under 2 different scenarios: (i) manual annotation, and (ii) annotation assisted by NeuroBrowser. The time needed for exhaustively annotating all spikes in each EEG was recorded, and summarized in Table 3. As can be seen from Table 3, on average NeuroBrowser is able to reduce the time spent on annotating spikes by approximately 70%.
Table 3.
Annotation experiments.
| Spike Number | Time cost [min] | Efficiency measures | |||||
|---|---|---|---|---|---|---|---|
| EEG | User | Manual | DTW-TM | Manual | DTW-TM | Time saved [%] | Speed-up [%] |
| S1 | Expert1 | 833 | 890 | 53.2 | 8.3 | 84.4% | 640.6% |
| Expert2 | 947 | 1048 | 23.0 | 12.0 | 47.7% | 191.2% | |
| Expert3 | 940 | 934 | 38.0 | 5.5 | 85.6% | 692.2% | |
| S2 | Expert1 | 390 | 388 | 58 | 11.3 | 80.6% | 515.5% |
| Expert2 | 800 | 737 | 23.3 | 17.4 | 25.4% | 134.0% | |
| Expert3 | 383 | 391 | 22.7 | 4.8 | 79.0% | 475.3% | |
| S3 | Expert1 | 182 | 179 | 15.4 | 6.8 | 55.8% | 226.5% |
| Expert2 | 183 | 177 | 17.9 | 13.4 | 25.3% | 133.8% | |
| Expert3 | 159 | 173 | 15.4 | 3.7 | 75.8% | 413.7% | |
| S4 | Expert1 | 1689 | 1719 | 108.4 | 11.5 | 89.4% | 940.2% |
| Expert2 | 1582 | 1601 | 26.9 | 5.5 | 79.6% | 491.2% | |
| Expert3 | 1802 | 1777 | 61.8 | 5.5 | 91.1% | 1122.3% | |
| S5 | Expert1 | 292 | 301 | 18.9 | 3.4 | 81.3% | 535.3% |
| Expert2 | 850 | 874 | 23.0 | 10.8 | 53.2% | 213.5% | |
| Expert3 | 304 | 323 | 17.5 | 1.2 | 93.1% | 1447.1% | |
| Average | 69.8% | 554.8% | |||||
Though the time savings achievable with NeuroBrowser is our focus, the existence of significant variability among experts in the number of spikes detected for the case in Table 3 deserves comment. This variability is expected as different experts may have different thresholds for choosing the spikes. As mentioned above, the inter-rater agreement is imperfect (Wilson and Emerson, 2002). Due to the lack of a universal definition, spike detection is ultimately to some extent subjective and dependent on experience. The agreement rate for spikes can be only around 60% between electroencephalographers (well-trained) for certain cases (Wilson and Emerson, 2002). Nevertheless, in clinical practice, the exact number of spikes turns to be rarely important. In the majority of cases, physicians are most concerned with whether or not spikes are present/absent in a given patients EEG. This determination is critical to making a confident diagnosis of epilepsy and to prescribing appropriate treatment (van Donselaar et al., 1992; Fountain and Freeman, 2006; Pillai and Sperling, 2006).
We apply 4 different measures (see Fig. 14) to assess manual vs. semi-automated annotation for these 5 subjects: (i) total time for annotation, (ii) the number of clicks required for acquiring spikes, (iii) the number of spikes obtained from each application of template matching, and (iv) precision (a.k.a. acceptance rate) for each application of template matching.
Figure 14.
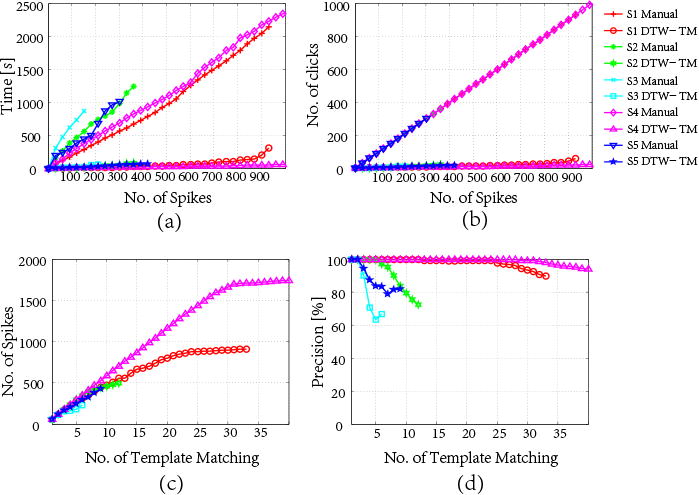
Illustration of time savings of semi-automated annotation on 5 EEG recordings, based on one expert-EEG rater's annotations: (a) time vs. number of spikes; (b) number of clicks vs. number of spikes; (c) number of spikes vs. number of DTW template matching performed; and (d) precision vs. number of DTW template matching performed.
NeuroBrowser dramatically improves annotation speed for each EEG record compared to manual annotation. To illustrate how this time saving is realized, detailed performance curves are shown in Fig. 14 for one of the three expert annotators. Fig. 14a shows substantially less time is required in all 5 cases to perform a complete annotation. As can be seen from Fig. 14b, the curves for manual annotation are all linear and overlapping with a constant increment at one spike per click. By contrast, semi-automated annotation with NeuroBrowser requires much fewer user operations to annotate the same number of spikes. Rather than one spike at a time, NeuroBrowser enables spike annotation in batches.
As shown in Fig. 14c and 14d, at the beginning of the annotation the precision is 100% for each application of template matching; this means that all 60 candidate spikes are accepted by the user. Performance starts to deteriorate when the EEG record is almost entirely annotated, since then only a few unannotated spikes remain in the EEG recording. As a result, not all recommendations are true spikes, leading to smaller spike increment and lower precision. Nevertheless, the precision does not drop below 65%, and hence performance remains acceptable.
5. Discussion and Conclusion
In this study, we developed NeuroBrowser, an integrated system for rapid waveform annotation. As demonstrated in our numerical results, in comparison with conventional manual EEG annotation, NeuroBrowser is able to save EEG experts approximately 70% on average of the time spent in annotating spikes. Currently, although automated spike detection systems exist on the market, none of them are well validated and universally accepted. Past attempts to create automated spike detection systems have failed primarily due to the intense labor and costs required to gather a sufficiently large and diverse collection of spikes as training examples, and the lack of rigorous validation on large numbers of prospectively collected EEGs, leading to physician mistrust of and failure to adopt published algorithms. That is probably why visual inspection and manual annotation remain the “gold standard” in clinical practice.
NeuroBrowser employs a suite of signal processing algorithms to enable semi-automated EEG analysis. A core component of NeuroBrowser is the Trillion algorithm, which enables, ultrafast template matching under Dynamic Time Warping (Rakthanmanon et al., 2012). The insensitivity of DTW-based similarity search to small dilations and stretches of the time axis, characteristic of variation in many natural signals, allows highly reliable retrieval of waveforms similar to a user-selected example waveform. While the algorithm is currently tailored to annotation of spikes, it can easily be generalized to other waveforms and signal types.
Great attempts have been made to detect spikes by general classifications such as mimetic, linear predictive and template based methods. Many current spike detection algorithms (see Table 1) apply multiple methods with various emphases. Unfortunately, none of them are universally accepted or tested on a significantly large dataset of patents and spikes. To date, no algorithmic approach has overcome these challenges to yield expert-level detection of spikes primarily due to: (i) the intense labor and expense required to gather a sufficiently large and diverse collection of examples of spikes as training examples; and (ii) the lack of rigorous validation on large numbers of prospectively collected EEGs, leading to physician mistrust of and failure to adopt published algorithms.
As illustrated in Table 1, the largest number of patients that were used to validate the related literature is 521 patients in (Black et al., 2000), however, with the total spike count unknown, while in this study we have constructed a huge database of 19,000+ spikes from 100 patient EEG recordings with NeuroBrowser. Each EEG was cross-annotated by 3 neurologists at MGH, and we only consider spikes that are accepted by at least 2 neurologists.
On the other hand, among all these methods with a known spike count, the spike count ranges from 23–2,973, which is far more less than our number. To our knowledge, this is the largest database of expert-annotated spike waveforms established to date. A large database of this type is crucial for training fully automated systems for complex and transient waveform analysis. With this database in hand, we are working to project in the future to develop a general-purpose spike detector.
Highlights.
An integrated system NeuroBrowser is proposed for EEG review and rapid annotation.
NeuroBrowser lies on ultrafast template matching to accelerate the task of annotation.
NeuroBrowser saves EEG experts approximately 70% on average in time efficiency.
Acknowledgments
This work is supported in part by Singapore Ministry of Education (MOE) Tier 1 grants M4010982.040 and M4011102.040 (JJ and JD); NIH-NINDS K23 NS090900, Rappaport Foundation, Andrew David Heitman Neuroendovascular Research Fund (MBW); and NIH-NINDS R01 NS062092 (SSC). We are grateful to Dr. Andrew James Cole and Dr. Catherine J. Chu at Massachusetts General Hospital for the collaboration and assistance in performing the studies described above.
References
- Acir N, Güzeliş C. Automatic spike detection in eeg by a two-stage procedure based on support vector machines. Computers in Biology and Medicine. 2004;34(7):561–575. doi: 10.1016/j.compbiomed.2003.08.003. [DOI] [PubMed] [Google Scholar]
- Alon J, Athitsos V, Yuan Q, Sclaroff S. A unified framework for gesture recognition and spatiotemporal gesture segmentation. Pattern Analysis and Machine Intelligence, IEEE Transactions on. 2009;31(9):1685–1699. doi: 10.1109/TPAMI.2008.203. [DOI] [PubMed] [Google Scholar]
- Black MA, Jones RD, Carroll GJ, Dingle AA, Donaldson IM, Parkin PJ. Real-time detection of epileptiform activity in the EEG: a blinded clinical trial. Clinical EEG and Neuroscience. 2000;31(3):122–130. doi: 10.1177/155005940003100304. [DOI] [PubMed] [Google Scholar]
- Chadwick NA, McMeekin DA, Tan T. Classifying eye and head movement artifacts in EEG signals; In Digital Ecosystems and Technologies Conference (DEST), 2011 Proceedings of the 5th IEEE International Conference on; 2011. pp. 285–291. [Google Scholar]
- Chatrian G, Bergamini L, Dondey M, Klass D, Lennox-Buchthal M, Petersen I. A glossary of terms most commonly used by clinical electroencephalographers. Electroencephalogr Clin Neurophysiol. 1974;37(5):538–548. doi: 10.1016/0013-4694(74)90099-6. [DOI] [PubMed] [Google Scholar]
- Ding H, Trajcevski G, Scheuermann P, Wang X, Keogh E. Querying and mining of time series data: experimental comparison of representations and distance measures. Proceedings of the VLDB Endowment. 2008;1(2):1542–1552. [Google Scholar]
- Dümpelmann M, Elger C. Visual and automatic investigation of epileptiform spikes in intracranial EEG recordings. Epilepsia. 1999;40(3):275–285. doi: 10.1111/j.1528-1157.1999.tb00704.x. [DOI] [PubMed] [Google Scholar]
- Encyclopedia of Surgery. Electroencephalography. Encyclopedia of Surgery. 2014 http://www.surgeryencyclopedia.com/Ce-Fi/Electroencephalography.html.
- Epilepsy Foundation of America. About Epilepsy: The Basics. Epilepsy Foundation. 2014 http://www.epilepsy.com/learn/about-epilepsy-basics.
- Feucht M, Hoffmann K, Steinberger K, Witte H, Benninger F, Arnold M, Doering A. Simultaneous spike detection and topographic classification in pediatric surface eegs. NeuroReport. 1997;8(9):2193–2197. doi: 10.1097/00001756-199707070-00021. [DOI] [PubMed] [Google Scholar]
- Fountain NB, Freeman JM. EEG is an essential clinical tool: pro and con. Epilepsia. 2006;47(s1):23–25. doi: 10.1111/j.1528-1167.2006.00655.x. [DOI] [PubMed] [Google Scholar]
- Gabor AJ, Seyal M. Automated interictal EEG spike detection using artificial neural networks. Electroencephalography and clinical Neurophysiology. 1992;83(5):271–280. doi: 10.1016/0013-4694(92)90086-w. [DOI] [PubMed] [Google Scholar]
- Goelz H, Jones RD, Bones PJ. Wavelet analysis of transient biomedical signals and its application to detection of epileptiform activity in the EEG. CLINICAL ELECTROENCEPHALOGRAPHY-CHICAGO- 2000;31(4):181–191. doi: 10.1177/155005940003100406. [DOI] [PubMed] [Google Scholar]
- Gotman J, Wang LY. State dependent spike detection: validation. Electroencephalography and clinical neurophysiology. 1992;83(1):12–18. doi: 10.1016/0013-4694(92)90127-4. [DOI] [PubMed] [Google Scholar]
- Hellmann G. Multifold features determine linear equation for automatic spike detection applying neural nin interictal ECoG. Clinical neurophysiology. 1999;110(5):887–894. doi: 10.1016/s1388-2457(99)00040-1. [DOI] [PubMed] [Google Scholar]
- Hostetler WE, Doller HJ, Homan RW. Assessment of a computer program to detect epileptiform spikes. Electroencephalography and clinical neurophysiology. 1992;83(1):1–11. doi: 10.1016/0013-4694(92)90126-3. [DOI] [PubMed] [Google Scholar]
- Ji Z, Sugi T, Goto S, Wang X, Ikeda A, Nagamine T, Shibasaki H, Nakamura M. An automatic spike detection system based on elimination of false positives using the large-area context in the scalp EEG. Biomedical Engineering, IEEE Transactions on. 2011;58(9):2478–2488. doi: 10.1109/TBME.2011.2157917. [DOI] [PubMed] [Google Scholar]
- Jing J, Dauwels J, Cash SS, Westover MB. SpikeGUI: Software for rapid interictal discharge annotation via template matching and online machine learning; In Engineering in Medicine and Biology Society (EMBC), 2014 36th Annual International Conference of the IEEE IEEE; 2014. [DOI] [PMC free article] [PubMed] [Google Scholar]
- Keogh E, Ratanamahatana CA. Exact indexing of dynamic time warping. Knowledge and information systems. 2005;7(3):358–386. [Google Scholar]
- Keogh E, Wei L, Xi X, Vlachos M, Lee SH, Protopapas P. Supporting exact indexing of arbitrarily rotated shapes and periodic time series under euclidean and warping distance measures. The VLDB JournalThe International Journal on Very Large Data Bases. 2009;18(3):611–630. [Google Scholar]
- Keogh EJ, Pazzani MJ. Scaling up dynamic time warping for datamining applications; In Proceedings of the sixth ACM SIGKDD international conference on Knowledge discovery and data mining, pages; 2000. pp. 285–289. ACM. [Google Scholar]
- Kim SW, Park S, Chu WW. An index-based approach for similarity search supporting time warping in large sequence databases; In Data Engineering, 2001 Proceedings 17th International Conference on; 2001. pp. 607–614. IEEE. [Google Scholar]
- Liu YC, Lin CCK, Tsai JJ, Sun YN. Model-based spike detection of epileptic EEG data. Sensors. 2013;13(9):12536–12547. doi: 10.3390/s130912536. [DOI] [PMC free article] [PubMed] [Google Scholar]
- Lodder SS, van Putten MJ. A self-adapting system for the automated detection of inter-ictal epileptiform discharges. PloS one. 2014;9(1) doi: 10.1371/journal.pone.0085180. [DOI] [PMC free article] [PubMed] [Google Scholar]
- Müller M. Dynamic time warping. Information retrieval for music and motion. 2007:69–84. [Google Scholar]
- Niedermeyer E, da Silva FL. Electroencephalography: basic principles, clinical applications, and related fields. Lippincott Williams & Wilkins; 2005. [Google Scholar]
- Oikonomou VP, Tzallas AT, Fotiadis DI. A kalman filter based methodology for eeg spike enhancement. Computer methods and programs in biomedicine. 2007;85(2):101–108. doi: 10.1016/j.cmpb.2006.10.003. [DOI] [PubMed] [Google Scholar]
- Olejniczak P. Neurophysiologic basis of eeg. Journal of clinical neurophysiology. 2006;23(3):186–189. doi: 10.1097/01.wnp.0000220079.61973.6c. [DOI] [PubMed] [Google Scholar]
- Özdamar Ö, Kalayci T. Detection of spikes with artificial neural networks using raw eeg. Computers and Biomedical Research. 1998;31(2):122–142. doi: 10.1006/cbmr.1998.1475. [DOI] [PubMed] [Google Scholar]
- Park HS, Lee YH, Kim NG, Lee DS, Kim SI. Detection of epileptiform activities in the eeg using neural network and expert system. Studies in health technology and informatics. 1997;52:1255–1259. [PubMed] [Google Scholar]
- Pietilä T, Vapaakoski S, Nousiainen U, Värri A, Frey H, Häkkinen V, Neuvo Y. Evaluation of a computerized system for recognition of epileptic activity during long-term EEG recording. Electroencephalography and clinical neurophysiology. 1994;90(6):438–443. doi: 10.1016/0013-4694(94)90134-1. [DOI] [PubMed] [Google Scholar]
- Pillai J, Sperling MR. Interictal EEG and the diagnosis of epilepsy. Epilepsia. 2006;47(s1):14–22. doi: 10.1111/j.1528-1167.2006.00654.x. [DOI] [PubMed] [Google Scholar]
- Racette BA, Holtzman DM, Dall TM, Drogan O. Supply and demand analysis of the current and future us neurology workforce. Neurology. 2014;82(24):2254–2255. doi: 10.1212/WNL.0000000000000509. [DOI] [PubMed] [Google Scholar]
- Rakthanmanon T, Campana B, Mueen A, Batista G, Westover B, Zhu Q, Zakaria J, Keogh E. Searching and mining trillions of time series subsequences under dynamic time warping; In Proceedings of the 18th ACM SIGKDD international conference on Knowledge discovery and data mining, pages; 2012. pp. 262–270. ACM. [DOI] [PMC free article] [PubMed] [Google Scholar]
- Ramabhadran B, Frost JD, Jr, Glover JR, Ktonas PY. An automated system for epileptogenic focus localization in the electroencephalogram. Journal of clinical neurophysiology. 1999;16(1):59–68. doi: 10.1097/00004691-199901000-00006. [DOI] [PubMed] [Google Scholar]
- Sakoe H, Chiba S. Dynamic programming algorithm optimization for spoken word recognition. Acoustics, Speech and Signal Processing, IEEE Transactions on. 1978;26(1):43–49. [Google Scholar]
- Sakurai Y, Yoshikawa M, Faloutsos C. Ftw: fast similarity search under the time warping distance. In Proceedings of the twenty-fourth ACM SIGMOD-SIGACT-SIGART symposium on Principles of database systems, pages. 2005:326–337. ACM. [Google Scholar]
- Sankar R, Natour J. Automatic computer analysis of transients in EEG. Computers in biology and medicine. 1992;22(6):407–422. doi: 10.1016/0010-4825(92)90040-t. [DOI] [PubMed] [Google Scholar]
- Senhadji L, Dillenseger JL, Wendling F, Rocha C, Kinie A. Wavelet analysis of eeg for three-dimensional mapping of epileptic events. Annals of biomedical engineering. 1995;23(5):543–552. doi: 10.1007/BF02584454. [DOI] [PMC free article] [PubMed] [Google Scholar]
- van Donselaar CA, Schimsheimer RJ, Geerts AT, Declerck AC. Value of the electroencephalogram in adult patients with untreated idiopathic first seizures. Archives of Neurology. 1992;49(3):231–237. doi: 10.1001/archneur.1992.00530270045017. [DOI] [PubMed] [Google Scholar]
- Webber W, Litt B, Wilson K, Lesser R. Practical detection of epileptiform discharges (EDs) in the EEG using an artificial neural network: a comparison of raw and parameterized EEG data. Electroencephalography and clinical Neurophysiology. 1994;91(3):194–204. doi: 10.1016/0013-4694(94)90069-8. [DOI] [PubMed] [Google Scholar]
- Wilson SB, Emerson R. Spike detection: a review and comparison of algorithms. Clinical Neurophysiology. 2002;113(12):1873–1881. doi: 10.1016/s1388-2457(02)00297-3. [DOI] [PubMed] [Google Scholar]
- Wilson SB, Turner CA, Emerson RG, Scheuer ML. Spike detection ii: automatic, perception-based detection and clustering. Clinical neurophysiology. 1999;110(3):404–411. doi: 10.1016/s1388-2457(98)00023-6. [DOI] [PubMed] [Google Scholar]
- Witte H, Eiselt M, Patakova I, Petranek S, Griessbach G, Krajca V, Rother M. Use of discrete hilbert transformation for automatic spike mapping: a methodological investigation. Medical and Biological Engineering and Computing. 1991;29(3):242–248. doi: 10.1007/BF02446705. [DOI] [PubMed] [Google Scholar]
- Xu G, Wang J, Zhang Q, Zhang S, Zhu J. A spike detection method in eeg based on improved morphological filter. Computers in biology and medicine. 2007;37(11):1647–1652. doi: 10.1016/j.compbiomed.2007.03.005. [DOI] [PubMed] [Google Scholar]
- Yi BK, Jagadish H, Faloutsos C. Efficient retrieval of similar time sequences under time warping; Data Engineering, 1998 Proceedings, 14th International Conference on; 1998. pp. 201–208. IEEE. [Google Scholar]
- Zhang Y, Glass JR. An inner-product lower-bound estimate for dynamic time warping; In Acoustics, Speech and Signal Processing (ICASSP), 2011 IEEE International Conference on; 2011. pp. 5660–5663. IEEE. [Google Scholar]
- Zinke A, Mayer D. Iterative multi scale dynamic time warping. Universität Bonn, CG-2006/1 2006 [Google Scholar]


