Abstract
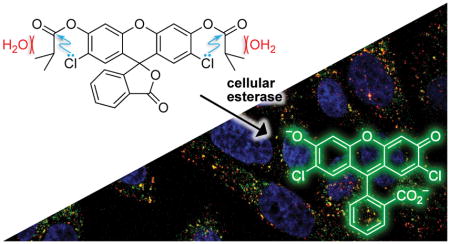
Fluorogenic probes are invaluable tools for spatiotemporal investigations within live cells. In common fluorogenic probes, the intrinsic fluorescence of a small-molecule fluorophore is masked by esterification until entry into a cell, where endogenous esterases catalyze the hydrolysis of the masking groups, generating fluorescence. The susceptibility of masking groups to spontaneous hydrolysis is a major limitation of these probes. Previous attempts to address this problem have incorporated auto-immolative linkers at the cost of atom economy and synthetic adversity. Here, we report on a linker-free strategy that employs adventitious electronic and steric interactions in easy-to-synthesize probes. We find that X···C=O n→π* interactions and acyl group size are optimized in 2′,7′-dichlorofluorescein diisobutyrate. This probe is relatively stable to spontaneous hydrolysis but is a highly reactive substrate for esterases both in vitro and in cellulo, yielding a bright, photostable fluorophore with utility in biomolecular imaging.
Graphical Abstract
INTRODUCTION
Fluorogenic probes with specific responses to physiological events or environmental conditions are invaluable for deciphering complex biological processes.1 Masked probes are a class of fluorogenic probes in which a pendant functional group attenuates the fluorescence of a fluorophore.2 Fluorescence is restored upon removal of the masking group by an enzyme-catalyzed or uncatalyzed chemical reaction. In cell biological applications, masking groups are frequently designed to serve as substrates for esterases,3 phosphatases,4 azoreductases,5 or cytochrome P450s.6 Caged fluorophores (which are also known as photoactivatable fluorophores) are related but are activated instead by illumination at specific wavelengths.7
Fluorogenic probes that are substrates for esterases are of special interest because they can be activated by an endogenous intracellular enzyme.8 Conjugation of fluorogenic esterase-activated probes to biomolecules can provide detailed spatiotemporal information about biomolecular uptake and localization in live cells.3a,9 These biomolecule–probe conjugates are, however, typically internalized by endocytic vesicles and can be exposed therein to acidity as low as pH 4.5,10 making insensitivity to low pH essential to probe function.
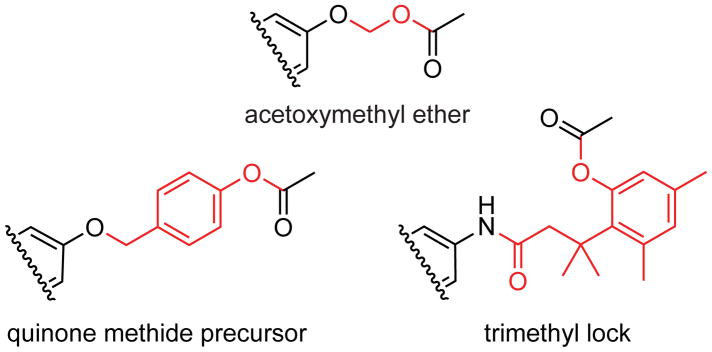
Halogenation of xanthene dyes is a reliable strategy for altering spectroscopic properties and tuning dye pKa to match those desired for biological applications. Oregon green, which is a fluorescein derivative in common use, is fluorinated at the 2′ and 7′ positions.11 Although fluorogenic probes based on fluorinated and chlorinated scaffolds are available from commercial vendors, little is known about the effects of halogenation on probe stability. Prior work with fluorinated deriva Schemetives demonstrated improved photostability, but accompanied by the accelerated spontaneous loss of masking groups.12 In contrast, a report of an unusually stable chlorinated probe13 suggested that halogens other than fluorine merit attention. With fluorinated Oregon green, destabilization of the masked substrate was thought to stem from inductive effects resulting in lowered pKa of the conjugate acid of the fluorescein leaving group.8d Accordingly, design strategies for stable fluorogenic esterase probes have relied heavily on interjecting self-immolative linkers with a higher pKa between the low pKa fluorophore and the site of enzymatic cleavage (Scheme 1).12 Platforms for such auto-immolative linkers include the acetoxymethyl (AM) ether,8d,12 quinone methides,14 and the trimethyl lock.3a,15 The beneficial stability provided by auto-immolative linkers does, however, come at the expense of a longer synthetic route to add atoms that are, ultimately, unnecessary.
Scheme 1.
Auto-immolative linkers (red) inserted between fluorophores and esterase targets to enhance stability.
The AM ether linker has a small size and facile synthetic accessibility compared to other auto-immolative linkers.8d Still, AM ether masking groups are installed on fluorescein by O-alkylation, which often yields undesirable ether–ester mixed byproducts from O-alkylation of the 2-carboxyl group.16 Addition of a 6-amido group for bioconjugation exacerbates the problem by shifting the equilibrium away from the “closed” lactone form of a fluorescein derivative and towards the “open” quinoid form. Accordingly, we sought a simple “linker-free” probe.
Here, we combine electronic and steric effects to create linker-free fluorogenic probes with high hydrolytic stability, enzymatic reactivity, and photostability. We begin by characterizing the effects of ortho-halogenation to identify an optimal substitution pattern. Then, we identify an ideal acyl masking group after searching for a high rate of enzyme-catalyzed unmasking along with a low rate of spontaneous hydrolysis. The ensuing probe is small and readily accessible, and has superior photostability and enzymatic unmasking kinetics in vitro and in cellulo relative to auto-immolative probes.
RESULTS AND DISCUSSION
Tuning Acyl Probe Stability with Halogenation
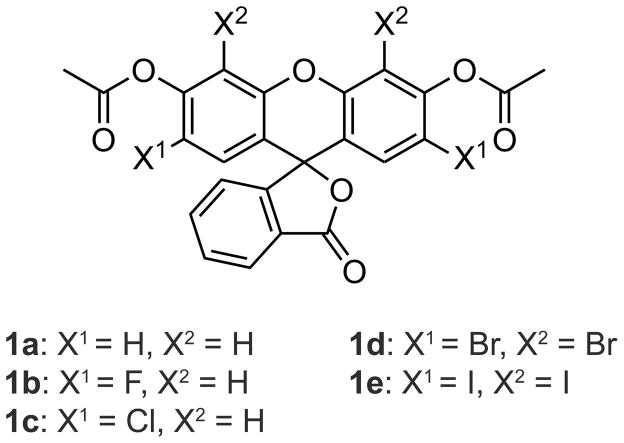
Previous reports have hinted at a role for halogenation in probe stability.8d,13 We pursued this strategy, synthesizing halogenated fluorescein diacetate probes 1a–e to characterize ortho-halogen effects (Scheme 2).17
Scheme 2.
Halogenated fluorescein diacetate probes.
We began by assessing the spectrophotometric properties of the unmasked probes. The product of the extinction coefficient and the quantum yield (ε × Φ) accounts for both the amount of light absorbed by a fluorophore and its quantum efficiency. This product is directly proportional to the brightness of the dye. By this measure, the hydrolysis of chlorinated probe 1c provides the brightest fluorophore.
Next, we assessed spontaneous hydrolysis by incubating each compound in either a simple buffer or a mammalian cell culture medium. The observed rates of spontaneous hydrolysis for probes 1a–e varied with ortho substituents in the order F > H > Cl > Br > I (Figure 1). Moreover, probes 1c–e exhibited increased stability relative to fluorinated probe 1b, despite their low pKa values (Table 1), suggesting that inductive electron-withdrawal is not the dominant contributor to probe stability with larger halogen substituents.
Figure 1.
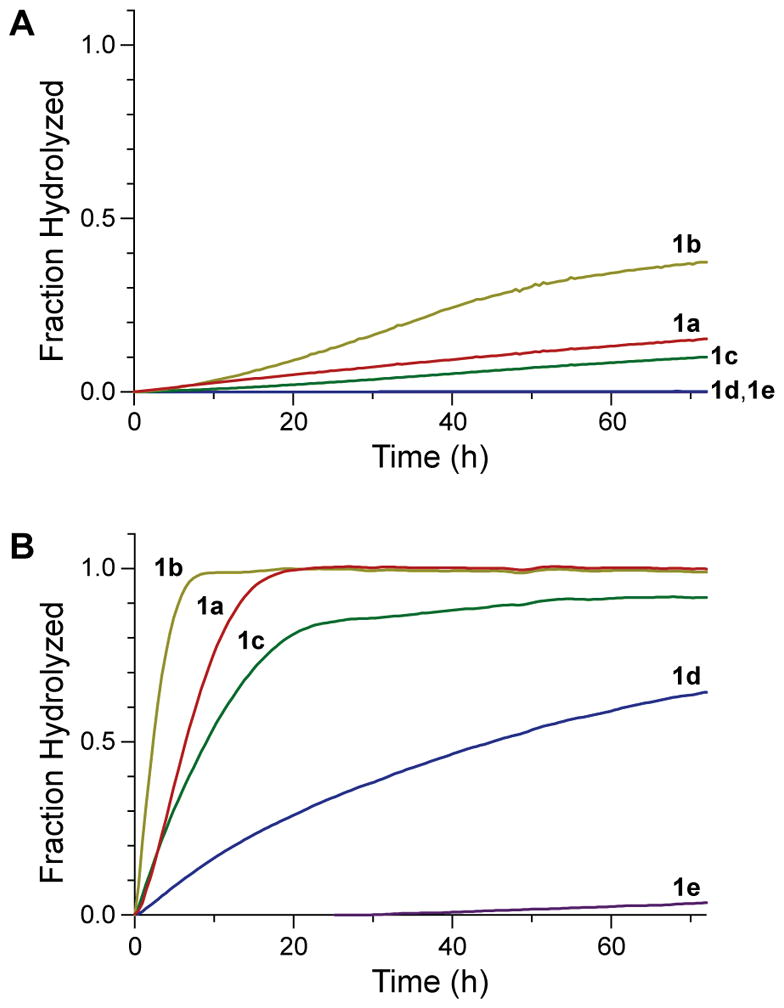
Graphs showing the time-course for the spontaneous hydrolysis of probes 1a–e as measured by the generation of fluorescence. (A) Hydrolysis in 10 mM HEPES–NaOH buffer, pH 7.3. (B) Hydrolysis in OptiMEM cell culture medium supplemented with FBS (10% v/v).
Table 1.
Spectroscopic attributes and pKa values of unmasked halogenated fluorescein diacetate probes.
We hypothesized that the resistance of probe 1c to hydrolysis was due to stabilization by a donor–acceptor interaction. Specifically, donation of a lone-pair of electrons (n) from an ortho-halo group into the antibonding orbital of the adjacent carbonyl group (π*)—an n→π* interaction21—could decrease the electrophilicity of the carbonyl group by raising the energy of its π* orbital.22 In addition, an intimate interaction with a halo group would shield one face of the acyl group from nucleophilic attack by water.
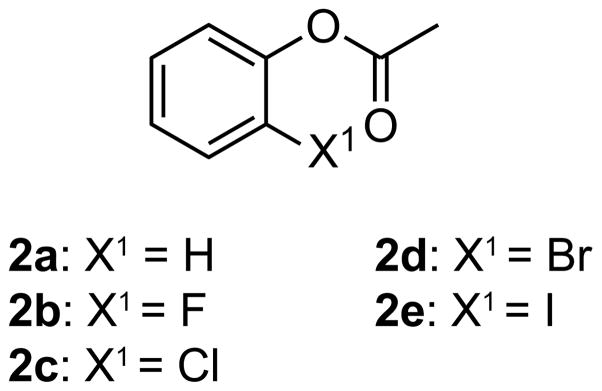
To characterize the interaction between the halo and acyl groups in 1a–e at higher resolution, we synthesized o-halophenyl acetates 2a–e (Scheme 3). Infrared carbonyl stretching frequencies can report on electronic effects on carbonyl groups,23 including n→π* interactions.24 We found that the introduction of ortho halogens induced modest hypsochromic shifts in the carbonyl stretching frequencies of 2a–e with magnitudes in the order: Cl > Br > F > I > H, whereas the hypsochromic shifts observed in 1a–e followed the order: Br > F ~ Cl ~ I > H (Table 2). The observed hypsochromic shifts in 2a–e follow a pattern similar to that of known rate constants for the hydrolysis of o-halophenyl acetates.25 Still, hypsochromic shifts of 1a–e and 2a–e did not follow a pattern based simply on electron-withdrawal. Accordingly, we turned to quantum mechanical calculations to evaluate the origin of the anomalous hypsochromic shifts and their implication in the observed hydrolysis trends.
Scheme 3.
Halogenated model compounds.
Table 2.
Carbonyl stretching frequencies, donor–acceptor geometries and interaction energies, and hydrolytic stabilities of compounds 1a–e and 2a–e.
| Probe | νC=O (cm−1)a | dX···C (Å)b | θX···C=O (°)b | En→π* (kcal/mol)b | ΔEX,C=O (kcal/mol)b | t1/2 (h)c |
|---|---|---|---|---|---|---|
| 1a | 1766 | 3.06 | 80.9 | — | 0.20 | 4.7 |
| 1b | 1774 | 2.97 | 77.0 | 0.22 | 0.85 | 1.8 |
| 1c | 1774 | 3.25 | 84.7 | 0.54 | 0.98 | 11 |
| 1d | 1776 | 3.50d, 3.55e | 91.0d, 92.1e | 0.25d, 0.33e | 0.46d, 0.54e | 33 |
| 1e | 1774 | 3.62d, 3.65e | 91.0d, 92.1e | 0.40d, 0.44e | 0.81d, 1.01e | >2,000 |
| 2a | 1766 | 3.41 | 85.1 | — | 0.11 | ND |
| 2b | 1770 | 3.27 | 85.9 | 0.22 | 0.19 | ND |
| 2c | 1774 | 3.00 | 85.8 | 0.51 | 1.10 | ND |
| 2d | 1772 | 3.13 | 87.6 | 0.52 | 1.17 | ND |
| 2e | 1767 | 3.59 | 91.1 | 0.51 | 1.03 | ND |
Measured with FT-IR spectroscopy.
Calculated for each X···C=O interaction in the optimized geometry.
Experimental half-life for spontaneous hydrolysis in OptiMEM containing FBS (10% v/v).
Data for 4′,5′-halo substituents.
Data for 2′,7′-halo substituents.
ND, not determined.
We used second-order perturbation theory calculations provided by Natural Bond Orbital (NBO) analysis26 to assess possible n→π* interactions in compounds 2a–e. The stabilizing effects of n→π* interactions were pivotal for each compound but could not provide the sole explanation for the observed trends. The zenith in n→π* interaction energies (En→π*) occurs when X = Cl (Figure 2), suggesting that increasing the size of the halogen plays dichotomous roles. Every favorable n→π* interaction is counteracted, at least partially, by unfavorable Pauli repulsion between the lone pair and π bonding orbital—a factor that is of increasing importance for larger halogen atoms. The steric exchange energy (ΔEX,C=O), which is the energetic penalty associated with the overlap of the lone pair and π bonding orbital, is substantial only in compounds bearing larger halo substituents: Cl (1c and 2c), Br (1d and 2d), and I (1e and 2e). Hence, we proceeded to assess in greater detail how n)(π Pauli repulsion contributes to the reactivity of the acyl masking groups in compounds 2a–e.
Figure 2.
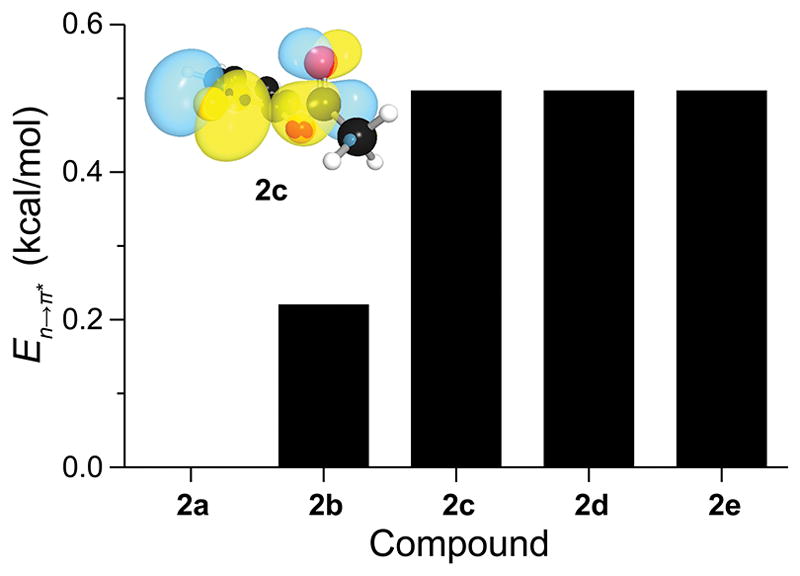
Graph showing the strength of n→π* interactions in compounds 2a–e as calculated with second-order perturbation theory. Data are listed in Table 1. Insert: NBO orbital rendering of n→π* interactions in 2-chlorophenyl acetate (2c).
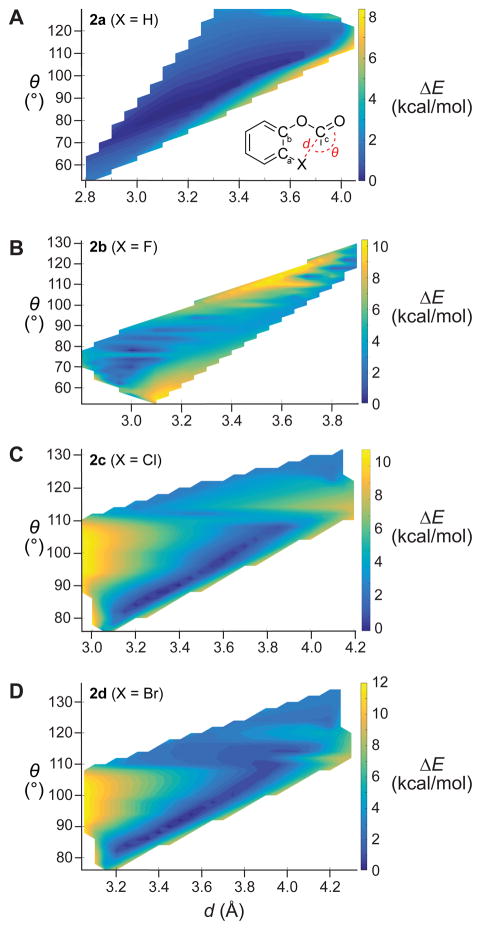
Potential energy surfaces can provide valuable insight into the interplay between n→π* interactions and n)(π Pauli repulsion.22,27 Favorable interactions dominate when the dX···C distance and θX···C=O angle between the halo and carbonyl groups provide sufficient orbital overlap for n→π* donation, generating a trough in the potential energy surface. This surface is manicured further by unfavorable steric interactions [e.g., n)(π Pauli repulsion] when the value of d is too small for a particular value of θ (Figure S1).
To provide additional information, we calculated potential energy surfaces for compounds 2a–d by scanning the Ca–Cb–O–Cc dihedral angle (Figure 3). The dominant feature in these surfaces is a trough in which n→π* interactions are favorable and steric repulsion is minimal. The most productive angle formed between an attacking nucleophile and carbonyl group for the formation of a tetrahedral intermediate is the Bürgi–Dunitz trajectory.28 Due to the covalent nature of n→π* interactions, energies are minimized near the Bürgi–Dunitz trajectory. Moving along the Bürgi–Dunitz trajectory (~107°), the unfavorable n)(π interaction dominates until d ≈ 3.6 and 3.8 Å for X = Cl and Br, respectively (Figures 3C and 3D), which recapitulates the length of the C–X bond. When X = F (Figure 3B), the small van der Waals radii and weak overlap of 2p orbitals restrict favorable conformations to relatively small values of d and θ. In the absence of halo substituents, the surface has a singular trough (Figure 3A), unaltered by significant changes in steric repulsion. Thus, the observed trend in carbonyl stretching frequencies (Table 1) is a balance between n→π* interactions, n)(π Pauli repulsion, and through-bond inductive and resonance effects. These findings, in conjunction with spectroscopic attributes (Table 1), anoint 2′,7′-dichlorofluorescein-based probes as having an optimal combination of stability and brightness.
Figure 3.
Calculated potential energy surfaces generated by scanning the Ca–Cb–O–Cc dihedral angle of compounds 2a–d. Minimal energies (blue) follow a trough that correlates with favorable n→π* interactions for a given X···Cc distance (d) and X···Cc=O angle (θ).
Optimization of the Acyl Masking Group
Encouraged by the attributes endowed by 2′,7′-dichlorination, we suspected that tuning the sterics of the acyl mask group could enhance probe stability. In particular, an ideal acyl masking group could provide steric hindrance to spontaneous hydrolysis without slowing the rate of enzymatic cleavage.29 Accordingly, we synthesized a small library of fluorogenic probes with various acyl masking groups (Scheme 4). Then, we assessed their susceptibility to spontaneous hydrolysis and enzymatic unmasking in vitro.
Scheme 4.
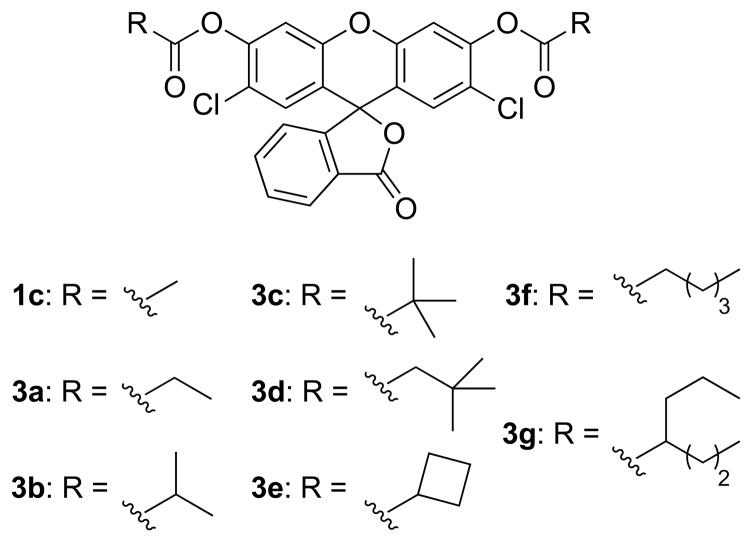
Acylated 2′,7′-dichlorofluorescein probes.
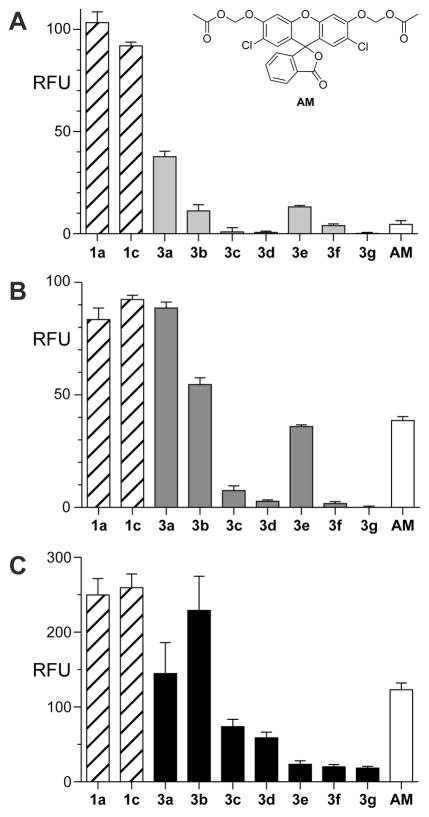
As expected, the combination of steric and n→π* stabilization in probes 3a–g reduced the rate of spontaneous hydrolysis significantly (Figure 4A). Nevertheless, the bulkier acyl groups in probes 3c–g also diminished the rate of enzymatic hydrolysis in vitro (Figure 4B). The isobutyryl masking groups in probe 3b provided the best combination of increased stability (~10-fold greater than that of fluorescein diacetate) and rapid enzymatic unmasking.
Figure 4.
Graphs showing the effect of acyl groups on the hydrolytic stability of 2′,7′-dichlorofluorescein probes in vitro and in cellulo. (A) Spontaneous hydrolysis after a 24-h incubation in OptiMEM containing FBS (10% v/v). Raw data are shown in Figure S2B. Inset: structure of compound AM. (B) Hydrolysis by pig liver esterase in 1 h. Raw data are shown in Figure S2C. (C) Hydrolysis by intracellular esterases in live HeLa cells. Data were quantified from images in Figure 5. RFU: relative fluorescence units.
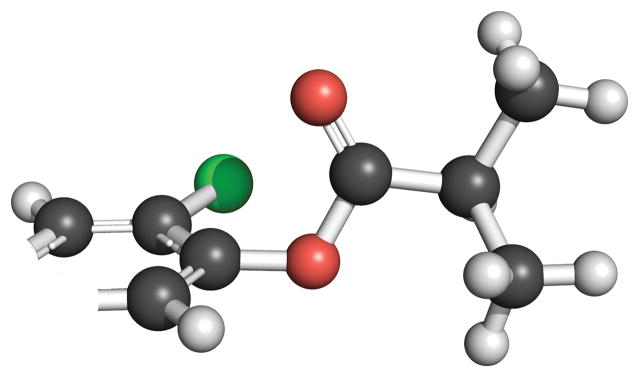
The resistance of probe 3b to spontaneous hydrolysis likely arises from a combination of electronic and steric effects. In its optimized geometry, one face of its ester carbonyl group is shielded from solvent water by an n→π* interaction with the ortho-chloro group (Scheme 5). The other face is shielded by a methyl group. These effects might be less detrimental to enzyme-catalyzed hydrolysis.
Scheme 5.
Optimized geometry of the butyryl ester moiety in probe 3b.
We evaluated the steady-state kinetic parameters for esterase-catalyzed hydrolysis of the probes (Figure S3). Although the probes undergo two step hydrolysis, full fluorescence is generated only after release of the second ester group. Accordingly, hydrolysis data can be reliably fit to the Michaelis–Menten equation to obtain apparent kinetic parameters. Chlorinated probes tended to interact more strongly with the enzymic active site than did unmodified or fluorinated probes (Table S1). The additional steric bulk in butyryl probe 3b had only a modest effect on the rate of enzymatic hydrolysis compared to acetyl probe 1c. Optimized acyl probe 3b, with apparent kcat/KM = 1.8 × 10⁶ M−1s−1 and KM = 4.6 μM, outperformed probes with auto-immolative linkers (Table S1).
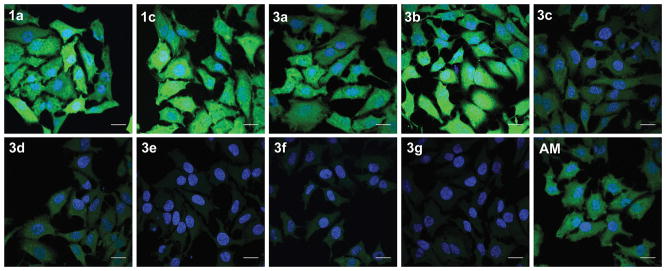
Human esterases often exhibit higher substrate specificity than does pig liver esterase.30 Accordingly, we sought to corroborate in vitro kinetic data with in cellulo data to ensure probe-applicability in human cells. Confocal images of live HeLa cells incubated with probes 3a–g confirmed the trends observed in vitro (Figures 4C and 5). Additionally, probe 3b showed enhanced rates of enzyme-catalyzed unmasking compared to the analogous AM ether probe (AM). Finally, we monitored the fluorescence of the 2′,7′-dichlorofluorescein scaffold in live cells under constant illumination and found that probes based on this scaffold have superior photostability (Figure S4).
Figure 5.
In cellulo hydrolysis of fluorogenic probes 1a, 1c, 3a–g, and AM. HeLa cells were incubated with a probe (5 μM) for 15 min, counterstained with Hoechst 33392, and imaged by confocal microscopy. Quantitation shows that cells incubated with 1c or 3b had comparable levels of fluorescence signal generation (Figure 5). Scale bars: 25 μm.
CONCLUSIONS
We have described a new strategy for stabilizing esterase-activated fluorogenic probes. An n→π* interaction between an ortho-halogen and pendant acyl group in 2′,7′-fluorescein diacetate deters spontaneous hydrolysis. n)(π Pauli repulsion from larger halo groups limits the benefit that can be gained from this n→π* interaction, and an optimum is achieved with chloro-substitution. Spontaneous hydrolysis is deterred further with little effect on esterase-catalyzed cleavage when the esters derive from isobutyric acid rather than acetic acid. Thus, 2′,7′-dichlorofluorescein diisobutyrate is a simple linker-free probe derived by optimizing electronic and steric effects.
EXPERIMENTAL SECTION
General Information
Phenyl acetate (2a), 2-iodophenyl acetate (2e), and all other commercial chemicals were from Sigma–Aldrich (St. Louis, MO), Fischer Scientific (Hampton, NH), or Alfa Aesar (Haverhill, MA) and were used without further purification. Porcine liver esterase (PLE) was from Sigma–Aldrich.
Chemical reactions were monitored by thin-layer chromatography (TLC) using EMD 250-μm silica gel 60-F254 plates and visualization with UV illumination or KMnO4-staining. Flash chromatography was performed with a Biotage Isolera automated purification system using pre-packed SNAP KP silica gel columns.
All procedures were performed in air at ambient temperature (~22 °C) and pressure (1.0 atm) unless specified otherwise. The phrase “concentrated under reduced pressure” refers to the removal of solvents and other volatile materials using a rotary evaporator at water aspirator pressure (<20 torr) while maintaining a water-bath temperature below 40 °C. Residual solvent was removed from samples at high vacuum (<0.1 torr), which refers to the vacuum achieved by mechanical belt-drive oil pump.
All fluorogenic probes and fluorescent molecules were dissolved in spectroscopic grade DMSO and stored as frozen stock solutions. For all applications, DMSO stock solutions were diluted such that the DMSO concentration did not exceed 1% v/v.
Instrumentation
Absorbance data were acquired with an Agilent Cary 60 UV-vis spectrometer. Hydrolysis kinetics were measured with a Tecan Infinite M1000 plate reader. All other fluorescence data were acquired with a PTI QuantaMaster spectrofluorometer. 1H and 13C NMR spectra were acquired on Bruker Spectrometers at the National Magnetic Resonance Facility at Madison (NMRFAM) operating at 500 MHz for 1H and 125 MHz for 13C. Mass spectrometry was performed with a Q Exactive™ Plus electrospray ionization quadrupole-ion trap (ESI–QIT-MS) mass spectrometer at the Mass Spectrometry Facility in the Department of Chemistry at the University of Wisconsin–Madison. IR spectra were acquired with a Micro FT-IR spectrometer at the Materials Science Center of the University of Wisconsin–Madison. Microscopy images were acquired with a Nikon Eclipse Ti inverted confocal microscope at the Biochemistry Optical Core of the University of Wisconsin–Madison.
Optical Spectroscopy
UV–visible and fluorescence spectra were recorded by using 1-cm path length, 4-mL quartz cuvettes or 1-cm path length, 1-mL quartz microcuvettes. Analyte solutions were stirred with a magnetic stir bar. Quantum yields were determined by referencing probe solutions to fluorescein (λex = 495 nm; Φ = 0.95) in 0.1 M NaOH(aq).
FT-IR spectra were recorded on compounds solvated with a minimum quantity of dichloromethane or dimethyl sulfoxide, and sandwiched between two sodium chloride windows. FT-IR spectra were collected with 128 scans at 1200–3500 cm−1 and a resolution of 2 cm−1. A background spectrum was taken of the solvent alone every 20 min. Plates were washed with acetone (3×) after recording the spectrum of each compound.
Spontaneous Probe Hydrolysis
Probe stocks were diluted to a final concentration of 5 μM in 300 μL of either 10 mM HEPES–NaOH buffer, pH 7.3, or OptiMEM containing FBS (10% v/v). Fluorescence was measured with a plate reader (Costar 96 well clear bottom, bottom measurement mode) at 30-min intervals for 72 h. Hydrolysis data were fitted to single-phase decay curves with GraphPad Prism software.
PLE-Catalyzed Probe Hydrolysis
PLE (168 kDa, ≥15 units/mg solid) was suspended in 10 mM HEPES–NaOH buffer, pH 7.3, and diluted to appropriate concentrations before use in protein LoBind tubes from Eppendorf. Initial rate measurements for each probe were acquired and the resulting data was fit to the Michaelis–Menten equation in GraphPad Prism software to obtain apparent kinetic parameters for the enzyme-catalyzed unmasking of probes.
Cell Culture and Live Cell Imaging
HeLa cells were from American Type Culture Collection (Manassas, VA) and were maintained according to recommended procedures. Gibco brand Dulbecco’s Modified Eagle Medium (DMEM), fetal bovine serum (FBS), trypsin (0.25% w/v), OptiMEM, and Dulbecco’s PBS (DPBS) were from Thermo Fisher Scientific (Waltham, MA). HeLa cells were grown in DMEM supplemented with FBS (10% v/v), penicillin (100 units/mL), and streptomycin (100 μg/mL). For all imaging experiments, 8-well microscopy slides from Ibidi (Madison, WI) were seeded with HeLa cells (105 cells/mL) 24 h before use. All imaging experiments were performed in live cells without fixation. ImageJ software from the National Institutes of Health (Bethesda, MD) was used for all image processing, signal quantification, and colocalization measurements.31
In Cellulo Probe Hydrolysis
HeLa cells in 8-well microscopy slides were incubated with 5 μM probe for 15 min, and counterstained with Hoechst 33342 (2 μg/mL) for 10 min at 37 °C. Cells were washed twice and imaged with a confocal microscope. Background-subtracted cell fluorescence signal was quantified in each image.
Photobleaching
HeLa cells in 8-well microscopy slides were incubated with 5 μM of 1a, 1b, or 1c for 15 min, and counterstained with Hoechst 33342 (2 μg/mL) for 10 min at 37 °C. The cells were washed twice and imaged with a confocal microscope using a 488-nm filter set. Images were acquired every 2 min with continuous, constant-intensity illumination between acquisitions. Normalized fluorescence signal was quantified with ImageJ software and plotted in Figure S4.
Computational Procedures
Geometry optimization calculations were performed with Gaussian 09, revision D.01 with the functional M06-2X and 6–311+g(2d,p) basis set.32 Frequency calculations were performed to ensure that the optimized structure was at a true minimum. All calculations were performed in water with the integral formalism polarizable continuum model (IEFPCM implicit solvent model as implemented in Gaussian 09). Potential-energy surfaces were generated by varying the Ca–Cb–O–Cc dihedral using a relaxed scan. All calculations performed on systems containing iodine were done by using the Stuttgart relativistic electron core potential for treating iodine, whereas the 6–311+g(2d,p) basis set was used for all other atoms. NBO calculations were performed with NBO 6.0.26 The pairwise steric exchange energy (ΔEX,C=O) between the lone pair of a halo group and the π orbital of a carbonyl group was calculated using natural steric analysis as implemented in NBO 6.0. All energies include zero-point corrections.
2′,7′-Dichlorofluorescein
4-Chlororesorcinol (14.4 g, 99.6 mmol) and phthalic anhydride (7.3 g, 49.3 mmol) were dissolved in MeSO3H (50 mL), and the resulting solution was heated at 90 °C for 24 h. After cooling to room temperature, the reaction mixture was added slowly to 1 L of stirred ice water. The resulting suspension was filtered and triturated with cold water to afford 2′,7′-dichlorofluorescein as a yellow solid (18.1 g, 90.7% yield). 1H NMR (500 MHz, (CD3)2SO, δ): 11.08 (s, 2H), 8.01 (d, J = 7.7 Hz, 1H), 7.82 (t, J = 7.7 Hz, 1H), 7.75 (t, J = 7.6 Hz, 1H), 7.34 (d, J = 7.7 Hz, 1H), 6.91 (s, 2H), 6.66 (s, 2H). 13C NMR (125 MHz, (CD3)2SO, δ): 168.3, 155.1, 151.5, 150.1, 135.9, 130.5, 128.2, 125.9, 125.1, 124.0, 116.3, 110.5, 103.7, 81.5. HRMS (ESI–QIT) m/z: [M + H]+ Calcd for C20H11Cl2O5 400.9979; Found 400.9982.
Diesters 1a–e and 3a–h, and Esters 2b–d
To a suspension of phenol or fluorescein derivative (0.15 mmol, 1 equiv) in DCM (2.0 mL) were added 4-dimethylaminopyridine (15 μmol, 0.1 equiv) and pyridine (0.33 mmol, 2.2 equiv). Acyl chloride (0.33 mmol, 2.2 equiv) was added dropwise, and the resulting solution was stirred for 1 h or until completion of the reaction. After dilution with water and extraction with DCM, the combined organic extracts were washed with saturated aqueous NH4Cl and brine, dried with MgSO4(s), and concentrated under reduced pressure. Purification by column chromatography on silica gel (0–40% v/v EtOAc in hexanes) afforded the title compounds as white solids or clear oils.
Characterization data for fluorescein diacetate (1a) and 2′,7′-difluorofluorescein diacetate (1b) were in accord with those reported previously.12
2′,7′-Dichlorofluorescein Diacetate (1c)
Off-white solid (68.6 mg, 94.2% yield). 1H NMR (500 MHz, CDCl3, δ): 8.08 (d, J = 7.6 Hz, 1H), 7.73 (dd, J = 26.5, 1.0 Hz, 2H), 7.22 (d, J = 7.6 Hz, 1H), 7.16 (s, 2H), 6.87 (s, 2H), 2.38 (s, 6H). 13C NMR (125 MHz, CDCl3, δ): 168.7, 168.1, 151.9, 149.8, 148.6, 136.0, 130.8, 129.1, 125.8, 125.8, 124.2, 122.8, 117.8, 112.9, 80.6, 20.8. HRMS (ESI–QIT) m/z: [M + H]+ Calcd for C24H15Cl2O7 485.0190; Found 485.0196.
Eosin Y diacetate (1d)
White solid (40.6 mg, 37% yield). 1H NMR (500 MHz, CDCl3, δ): 8.13 (dd, J = 7.5, 1.0 Hz, 1H), 7.82 (t, J = 7.2 Hz, 1H), 7.77 (dt, J = 7.5, 3.8 Hz, 1H), 7.28 (d, J = 7.3 Hz, 1H), 7.07 (s, 2H), 2.48 (s, 6H). 13C NMR (125 MHz, CDCl3, δ): 171.0, 169.5, 151.1, 150.6, 138.8, 133.7, 132.6, 128.7, 127.9, 126.7, 121.9, 115.4, 111.1, 82.8, 23.3. HRMS (ESI–QIT) m/z: [M + H]+ Calcd for C24H13Br4O7 728.7389; Found 728.7390.
Erythrosin B Diacetate (1e)
White solid (44.2 mg, 32% yield). 1H NMR (500 MHz, CDCl3, δ): 8.09 (d, J = 7.7 Hz, 1H), 7.78 (m, 1H), 7.72 (t, J = 7.4 Hz, 1H), 7.22 (m, 3H), 2.46 (s, 4H). 13C NMR (125 MHz, CDCl3, δ): 168.4, 166.9, 154.0, 152.0, 137.4, 137.3, 136.1, 130.9, 125.9, 125.2, 124.1, 119.5, 84.4, 83.1, 21.4. HRMS (ESI–QIT) m/z: [M + H]+ Calcd for C24H13I4O7, 920.6835; Found 920.6837.
2-Fluorophenyl Acetate (2b)
Clear oil (9 mg, 39% yield). 1H NMR (500 MHz, CDCl3, δ): 7.22–7.07 (m, 1H), 2.35 (s, 1H). 13C NMR (125 MHz, CDCl3, δ): 168.5 (s), 154.2 (d, JC–F = 249 Hz), 138.2 (d, JC–F = 13.0 Hz), 127.2 (d, JC–F = 7.2 Hz), 124.6 (d, JC–F = 3.9 Hz), 123.8 (d, JC–F = 0.8 Hz), 116.8 (d, JC–F = 18.6 Hz), 20.6 (s). HRMS (ESI–QIT) m/z: [M + H]+ Calcd for C8H8FO2, 155.0503; Found, 155.0502.
2-Chlorophenyl Acetate (2c)
Clear oil (7.9 mg, 31% yield). 1H NMR (500 MHz, CDCl3, δ): 7.46 (dd, J = 8.0, 1.6 Hz, 1H), 7.33–7.27 (m, 1H), 7.20 (td, J = 7.7, 1.6 Hz, 1H), 7.15 (dd, J = 8.0, 1.6 Hz, 1H), 2.37 (s, 3H). 13C NMR (125 MHz, CDCl3, δ): 168.5, 146.9, 130.3, 127.7, 127.0, 126.8, 123.7, 20.6. HRMS (ESI–QIT) m/z: [M + H]+ Calcd for C8H8ClO2 171.0207; Found 171.0206
2-Bromophenyl Acetate (2d)
Clear oil (9.4 mg, 29% yield). 1H NMR (500 MHz, CDCl3, δ): 7.46 (dd, J = 8.0, 1.6 Hz, 1H), 7.33–7.27 (m, 1H), 7.20 (td, J = 7.7, 1.6 Hz, 1H), 7.15 (dd, J = 8.0, 1.6 Hz, 1H), 2.37 (s, 3H). 13C NMR (125 MHz, CDCl3, δ): 168.7, 148.4, 133.5, 128.7, 127.6, 123.9, 116.4, 21.0. HRMS (ESI–QIT) m/z: [M + NH4] + Calcd for C8H11NBrO2 231.9968; Found 231.9965.
2′,7′-Dichlorofluorescein Dipropionate (3a)
White solid (66.2 mg, 86% yield). 1H NMR (500 MHz, CDCl3, δ): 8.08 (d, J = 7.6 Hz, 1H), 7.73 (dtd, J = 31.0, 7.5, 0.9 Hz, 2H), 7.22 (d, J = 7.6 Hz, 1H), 7.16 (s, 2H), 6.87 (s, 2H), 2.67 (q, J = 7.5 Hz, 4H), 1.31 (t, J = 7.6 Hz, 6H). 13C NMR (125 MHz, CDCl3, δ): 171.6, 168.7, 152.0, 149.9, 148.7, 135.9, 130.8, 129.0, 125.8, 125.8, 124.1, 122.8, 117.7, 112.9, 80.6, 27.6, 9.1. HRMS (ESI–QIT) m/z: [M + H]+ Calcd for C26H19Cl2O7 513.0502; Found 513.0503.
2′,7′-Dichlorofluorescein Diisobutyrate (3b)
White solid (60.1 mg, 74% yield). 1H NMR (500 MHz, CDCl3, δ): 8.08 (d, J = 7.6 Hz, 1H), 7.74 (tdd, J = 15.0, 11.0, 4.1 Hz, 2H), 7.22 (d, J = 7.6 Hz, 1H), 7.14 (s, 2H), 6.87 (s, 2H), 2.96–2.79 (m, 2H), 1.36 (dd, J = 7.0, 4.0 Hz, 12H). 13C NMR (125 MHz, CDCl3, δ): 174.1, 168.6, 152.0, 149.8, 148.6, 135.8, 130.7, 128.9, 125.7, 125.7, 124.0, 122.7, 117.5, 112.7, 80.5, 34.2, 18.9, 18.9. HRMS (ESI–QIT) m/z: [M + H]+ Calcd for C28H23Cl2O7 541.0815; Found 541.0815.
2′,7′-Dichlorofluorescein Dipivalate (3c)
White solid (73.5 mg, 86% yield). 1H NMR (500 MHz, CDCl3, δ): 8.08 (d, J = 7.5 Hz, 1H), 7.72 (dtd, J = 29.1, 7.4, 1.0 Hz, 2H), 7.20 (d, J = 7.6 Hz, 1H), 7.13 (s, 2H), 6.87 (s, 2H), 1.40 (s, 18H). 13C NMR (125 MHz, CDCl3, δ): 175.6, 168.6, 152.0, 149.8, 148.8, 135.8, 130.6, 128.9, 125.7, 125.7, 124.0, 122.8, 117.4, 112.7, 80.6, 39.4, 27.1. HRMS (ESI–QIT) m/z: [M + H]+ Calcd for C30H27Cl2O7 569.1128; Found 569.1128.
2′,7′-Dichlorofluorescein Di-tert-butylacetate (3d)
White solid (76.2 mg, 85% yield). 1H NMR (500 MHz, CDCl3, δ): 8.08 (d, J = 7.6 Hz, 1H), 7.73 (dtd, J = 23.7, 7.4, 1.0 Hz, 2H), 7.20 (d, J = 7.5 Hz, 1H), 7.14 (s, 2H), 6.88 (s, 2H), 2.53 (s, 4H), 1.16 (s, 16H). 13C NMR (125 MHz, CDCl3, δ): 169.3, 168.6, 152.0, 149.7, 148.5, 135.8, 130.6, 129.0, 125.7, 125.6, 124.0, 122.7, 117.5, 112.7, 80.5, 47.3, 31.1, 29.6. HRMS (ESI–QIT) m/z: [M + H]+ Calcd for C32H31Cl2O7 597.1441; Found 597.1438.
2′,7′-Dichlorofluorescein Dicyclobutyrate (3e)
White solid (78 mg, 92% yield). 1H NMR (500 MHz, CDCl3, δ): 8.08 (d, J = 7.6 Hz, 1H), 7.79–7.68 (m, 2H), 7.22 (d, J = 7.6 Hz, 1H), 7.15 (s, 2H), 6.87 (s, 2H), 3.52–3.41 (m, 2H), 2.55–2.45 (m, 4H), 2.43–2.32 (m, 4H), 2.15–1.97 (m, 4H). 13C NMR (125 MHz, CDCl3, δ): 172.5, 168.7, 152.1, 149.9, 148.7, 135.9, 130.8, 129.0, 125.8, 125.8, 124.2, 122.9, 117.6, 112.9, 80.7, 38.0, 25.5, 25.4, 18.6. HRMS (ESI–QIT) m/z: [M + H]+ Calcd for C30H23Cl2O7 565.0815; Found 565.0817.
2′,7′-Dichlorofluorescein Dihexanoate (3f)
White solid (56.5 mg, 63% yield) 1H NMR (500 MHz, CDCl3, δ): 8.08 (d, J = 7.5 Hz, 1H), 7.78–7.68 (m, 2H), 7.22 (d, J = 7.6 Hz, 1H), 7.15 (s, 2H), 6.87 (s, 2H), 2.63 (t, J = 7.5 Hz, 4H), 1.78 (dd, J = 14.9, 7.4 Hz, 4H), 1.46–1.34 (m, 8H), 0.93 (t, J = 7.0 Hz, 6H). 13C NMR (125 MHz, CDCl3, δ): 171.0, 168.7, 152.0, 149.9, 148.7, 135.9, 130.8, 129.1, 125.8, 125.8, 124.2, 122.8, 117.6, 112.90, 80.6, 34.1, 31.3, 24.6, 22.4, 14.0. HRMS (ESI–QIT) m/z: [M + H]+ Calcd for C32H31Cl2O7 597.1441; Found 597.1441.
2′,7′-Dichlorofluorescein Di-2-propylvalerate (3g)
White solid (68.5 mg, 70% yield). 1H NMR (500 MHz, CDCl3, δ): 8.09 (d, J = 7.5 Hz, 1H), 7.74 (tdd, J = 14.9, 10.8, 4.2 Hz, 2H), 7.21 (d, J = 7.6 Hz, 1H), 7.11 (s, 2H), 6.88 (s, 2H), 2.73–2.64 (m, 2H), 1.84–1.76 (m, 4H), 1.63–1.56 (m, 5H), 1.51–1.43 (m, 8H), 0.97 (td, J = 7.3, 2.2 Hz, 12H). 13C NMR (125 MHz, CDCl3, δ): 173.6, 168.8, 152.1, 149.8, 148.6, 135.9, 130.8, 129.1, 125.8, 125.7, 124.1, 122.8, 117.6, 112.9, 80.6, 45.4, 34.6, 34.5, 20.8, 20.8, 14.1 HRMS (ESI–QIT) m/z: [M + H]+ Calcd for C36H39Cl2O7 653.2067; Found 653.2067.
2′,7′-Dichlorofluorescein diacetoxymethyl ether (AM)
Ag2O (145 mg, 0.63 mmol), 2′,7′-dichlorofluorescein (0.25 mmol), and powdered activated 4-Å molecular sieves (208 mg) were added to an oven-dried round-bottom flask. Anhydrous CH3CN (4.0 mL) was added, and the resulting suspension was stirred under N2(g) for 5 min. To this mixture was added bromomethyl acetate (0.1 mL, 1.0 mmol) dropwise, and the resulting mixture was stirred under N2(g) for 48 h. The reaction mixture was then diluted with DCM and filtered through a pad of Celite®. Purification by column chromatography on silica gel (0–40% v/v EtOAc in hexanes with constant 40% v/v DCM as cosolvent) afforded the title compound as a white solid (53.2 mg, 39% yield). 1H NMR (500 MHz, CDCl3, δ): 8.08 (d, J = 7.4 Hz, 1H), 7.72 (td, J = 7.4, 1.1 Hz, 2H), 7.21–7.14 (m, 1H), 7.09 (s, 2H), 6.79 (s, 2H), 5.86 (dd, J = 8.4, 6.5 Hz, 4H), 2.19 (s, 6H). 13C NMR (125 MHz, CDCl3, δ): 169.6, 168.8, 154.1, 151.9, 150.4, 135.7, 130.6, 129.4, 126.3, 125.7, 123.9, 119.7, 113.9, 104.1, 85.4, 81.2, 21.0. HRMS (ESI–QIT) m/z: [M + H]+ Calcd for C26H19Cl2O9 545.0401; Found 545.0400.
Supplementary Material
Acknowledgments
We are grateful to Dr. C. L. Jenkins for her critical review of the manuscript. This work was supported by grant R01 GM044783 to R.T.R. (NIH). W.C. was supported by an NSF Graduate Research Fellowship. B.G. was supported by an Arnold O. Beckman Postdoctoral Fellowship. This work used data acquired at the National Magnetic Resonance Facility at Madison, which is supported by Grant P41 GM103399 (NIH). The work also made use of a Thermo Q Exactive™ Plus mass spectrometer (NIH grant S10 OD020022), Phoenix Cluster at the UW–Madison HPC center (NSF grant CHE-0840494), and Micro FT-IR spectrometer (NSF grant DMR-1121288).
Footnotes
Notes
The authors declare no competing financial interest.
The Supporting Information is available free of charge on the ACS Publications website at DOI: 10.1021/acs.joc.xxxxxxx.
Table S1, Figures S1–S4, 1H NMR, 13C NMR, and IR spectra, and computational data.
References
- 1.(a) Lavis LD, Raines RT. ACS Chem Biol. 2008;3:142–155. doi: 10.1021/cb700248m. [DOI] [PMC free article] [PubMed] [Google Scholar]; (b) Chan J, Dodani SC, Chang CJ. Nat Chem. 2012;4:973–984. doi: 10.1038/nchem.1500. [DOI] [PMC free article] [PubMed] [Google Scholar]
- 2.(a) Grimm JB, Heckman LM, Lavis LD. Prog Mol Biol Transl Sci. 2013;113:1–34. doi: 10.1016/B978-0-12-386932-6.00001-6. [DOI] [PubMed] [Google Scholar]; (b) Lavis LD, Raines RT. ACS Chem Biol. 2014;9:855–866. doi: 10.1021/cb500078u. [DOI] [PMC free article] [PubMed] [Google Scholar]
- 3.(a) Lavis LD, Chao TY, Raines RT. ACS Chem Biol. 2006;1:252–260. doi: 10.1021/cb600132m. [DOI] [PMC free article] [PubMed] [Google Scholar]; (b) Lavis LD, Chao TY, Raines RT. Chem Bio Chem. 2006;7:1151–1154. doi: 10.1002/cbic.200500559. [DOI] [PMC free article] [PubMed] [Google Scholar]
- 4.(a) Levine MN, Raines RT. Anal Biochem. 2011;418:247–252. doi: 10.1016/j.ab.2011.07.021. [DOI] [PMC free article] [PubMed] [Google Scholar]; (b) Park J, Kim Y. Bioorg Med Chem Lett. 2013;23:2332–2335. doi: 10.1016/j.bmcl.2013.02.063. [DOI] [PubMed] [Google Scholar]
- 5.Chevalier A, Mercier C, Saurel L, Orenga S, Renard PY, Romieu A. Chem Commun. 2013;49:8815–8818. doi: 10.1039/c3cc44798g. [DOI] [PubMed] [Google Scholar]
- 6.Yatzeck MM, Lavis LD, Chao TY, Chandran SS, Raines RT. Bioorg Med Chem Lett. 2008;18:5864–5866. doi: 10.1016/j.bmcl.2008.06.015. [DOI] [PMC free article] [PubMed] [Google Scholar]
- 7.Heckman LM, Grimm JB, Schreiter ER, Kim C, Verdecia MA, Shields BC, Lavis LD. Angew Chem, Int Ed. 2016;55:8363–8366. doi: 10.1002/anie.201602941. [DOI] [PMC free article] [PubMed] [Google Scholar]
- 8.(a) Cohen JD, Husic HD. FASEB J. 1991;5:A1511–A1511. [Google Scholar]; (b) Karlsson HJ, Westman G. Tetrahedron. 2000;56:8939–8944. [Google Scholar]; (c) Shan GM, Hammock BD. Anal Biochem. 2001;299:54–62. doi: 10.1006/abio.2001.5388. [DOI] [PubMed] [Google Scholar]; (d) Tallman KR, Beatty KE. Chem Bio Chem. 2015;16:70–75. doi: 10.1002/cbic.201402548. [DOI] [PMC free article] [PubMed] [Google Scholar]; (e) Tallman KR, Levine SR, Beatty KE. ACS Chem Biol. 2016;11:1810–1815. doi: 10.1021/acschembio.6b00233. [DOI] [PMC free article] [PubMed] [Google Scholar]
- 9.Levine MN, Hoang TT, Raines RT. Chem Biol. 2013;20:614–618. doi: 10.1016/j.chembiol.2013.03.016. [DOI] [PMC free article] [PubMed] [Google Scholar]
- 10.Sorkin A, von Zastrow M. Nat Rev Mol Cell Biol. 2002;3:600–614. doi: 10.1038/nrm883. [DOI] [PubMed] [Google Scholar]
- 11.Sun WC, Gee KR, Klaubert DH, Haugland RP. J Org Chem. 1997;62:6469–6475. [Google Scholar]
- 12.Lavis LD, Chao TY, Raines RT. Chem Sci. 2011;2:521–530. doi: 10.1039/C0SC00466A. [DOI] [PMC free article] [PubMed] [Google Scholar]
- 13.Chyan W, Zhang DY, Lippard SJ, Radford RJ. Proc Natl Acad Sci USA. 2014;111:143–148. doi: 10.1073/pnas.1310583110. [DOI] [PMC free article] [PubMed] [Google Scholar]
- 14.Hakamata W, Tamura S, Hirano T, Nishio T. ACS Med Chem Lett. 2014;5:321–325. doi: 10.1021/ml400398t. [DOI] [PMC free article] [PubMed] [Google Scholar]
- 15.Levine MN, Raines RT. Chem Sci. 2012;3:2412–2420. doi: 10.1039/C2SC20536J. [DOI] [PMC free article] [PubMed] [Google Scholar]
- 16.(a) Ouyang H, Vander Velde DG, Borchardt RT, Siahaan TJ. J Peptide Res. 2002;59:183–195. doi: 10.1034/j.1399-3011.2002.1o983.x. [DOI] [PubMed] [Google Scholar]; (b) Yang YZ, Babiak P, Reymond JL. Helv Chim Acta. 2006;89:404–415. [Google Scholar]
- 17.(a) Hammett LP. Trans Faraday Soc. 1938;34:156–166. [Google Scholar]; (b) McDaniel DHB, Herbert C. J Am Chem Soc. 1954;77:3756–3764. [Google Scholar]; (c) Hansch C, Leo A, Hoekman DH. Exploring QSAR: Fundamentals and Applications in Chemistry and Biology. American Chemical Society; Washington, DC: 1995. [Google Scholar]; (d) Santiago CB, Milo A, Sigman MS. J Am Chem Soc. 2016;138:13424–13430. doi: 10.1021/jacs.6b08799. [DOI] [PubMed] [Google Scholar]
- 18.Smith SA, Pretorius WA. Water SA. 2002;28:395–402. [Google Scholar]
- 19.Zhang XF, Zhang JL, Liu LM. J Fluoresc. 2014;24:819–826. doi: 10.1007/s10895-014-1356-5. [DOI] [PubMed] [Google Scholar]
- 20.Batistela VR, Pellosi DS, de Souza FD, da Costa WF, Santin SMD, de Souza VR, Caetano W, de Oliveira HPM, Scarminio IS, Hioka N. Spectrochim Acta, Part A. 2011;79:889–897. doi: 10.1016/j.saa.2011.03.027. [DOI] [PubMed] [Google Scholar]
- 21.Choudhary A, Kamer KJ, Raines RT. J Org Chem. 2011;76:7933–7937. doi: 10.1021/jo201389d. [DOI] [PMC free article] [PubMed] [Google Scholar]
- 22.Choudhary A, Fry CG, Kamer KJ, Raines RT. Chem Commun. 2013;49:8166–8168. doi: 10.1039/c3cc44573a. [DOI] [PMC free article] [PubMed] [Google Scholar]
- 23.(a) Jones RN, Spinner E. Can J Chem. 1958;36:1020–1027. [Google Scholar]; (b) Bistoni G, Rampino S, Scafuri N, Ciancaleoni G, Zuccaccia D, Belpassi L, Tarantelli F. Chem Sci. 2016;7:1174–1184. doi: 10.1039/c5sc02971f. [DOI] [PMC free article] [PubMed] [Google Scholar]
- 24.Singh SK, Mishra KK, Sharma N, Das A. Angew Chem, Int Ed. 2016;55:7801–7805. doi: 10.1002/anie.201511925. [DOI] [PubMed] [Google Scholar]
- 25.Nishioka T, Fujita T, Kitamura K, Nakajima M. J Org Chem. 1975;40:2520–2525. [Google Scholar]
- 26.Glendening ED, Badenhoop JK, Reed AE, Carpenter JE, Bohmann JA, Morales CM, Weinhold F. NBO 6.0. Madison, WI: 2012. [Google Scholar]
- 27.Jakobsche CE, Choudhary A, Raines RT, Miller SJ. J Am Chem Soc. 2010;132:6651–6653. doi: 10.1021/ja100931y. [DOI] [PMC free article] [PubMed] [Google Scholar]
- 28.Bürgi HB, Dunitz JD, Lehn JM, Wipff G. Tetrahedron. 1974;30:1563–1572. [Google Scholar]
- 29.(a) Calloway NT, Choob M, Sanz A, Sheetz MP, Miller LW, Cornish VW. Chem Bio Chem. 2007;8:767–774. doi: 10.1002/cbic.200600414. [DOI] [PubMed] [Google Scholar]; (b) Bender DM, Peterson JA, McCarthy JR, Gunaydin H, Takano Y, Houk KN. Org Lett. 2008;10:509–511. doi: 10.1021/ol702892e. [DOI] [PubMed] [Google Scholar]
- 30.Tian L, Yang YL, Wysocki LM, Arnold AC, Hu A, Ravichandran B, Sternson SM, Looger LL, Lavis LD. Proc Natl Acad Sci USA. 2012;109:4756–4761. doi: 10.1073/pnas.1111943109. [DOI] [PMC free article] [PubMed] [Google Scholar]
- 31.French AP, Mills S, Swarup R, Bennett MJ, Pridmore TP. Nat Protoc. 2008;3:619–628. doi: 10.1038/nprot.2008.31. [DOI] [PubMed] [Google Scholar]
- 32.Frisch MJ, Trucks GW, Schlegel HB, Scuseria GE, Robb MA, Cheeseman JR, Scalmani G, Barone V, Mennucci B, Petersson GA, Nakatsuji H, Caricato M, Li X, Hratchian HP, Izmaylov AF, Bloino J, Zheng G, Sonnenberg JL, Hada M, Ehara M, Toyota K, Fukuda R, Hasegawa J, Ishida M, Nakajima T, Honda Y, Kitao O, Nakai H, Vreven T, Montgomery JA, Jr, Peralta JE, Ogliaro F, Bearpark M, Heyd JJ, Brothers E, Kudin KN, Staroverov VN, Kobayashi R, Normand J, Raghavachari K, Rendell A, Burant JC, Iyengar SS, Tomasi J, Cossi M, Rega N, Millam JM, Klene M, Knox JE, Cross JB, Bakken V, Adamo C, Jaramillo J, Gomperts R, Stratmann RE, Yazyev O, Austin AJ, Cammi R, Pomelli C, Ochterski JW, Martin RL, Morokuma K, Zakrzewski VG, Voth GA, Salvador P, Dannenberg JJ, Dapprich S, Daniels AD, Farkas Ö, Foresman JB, Ortiz JV, Cioslowski J, Fox DJ. Gaussian 09, Revision D.01. Gaussian, Inc; Wallingford, CT: 2009. [Google Scholar]
Associated Data
This section collects any data citations, data availability statements, or supplementary materials included in this article.


