

Abstract
Circulating tumor cells (CTCs) shed from tumor sites and represent the molecular characteristics of the tumor. Besides genetic and transcriptional characterization, it is important to profile a panel of proteins with single-cell precision for resolving CTCs’ phenotype, organ-of-origin, and drug targets. We describe a new technology that enables profiling multiple protein markers of extraordinarily rare tumor cells at the single- cell level. This technology integrates a microchip consisting of 15000 60 pL-sized microwells and a novel beads-on-barcode antibody microarray (BOBarray). The BOBarray allows for multiplexed protein detection by assigning two independent identifiers (bead size and fluorescent color) of the beads to each protein. Four bead sizes (1.75, 3, 4.5, and 6 μm) and three colors (blue, green, and yellow) are utilized to encode up to 12 different proteins. The miniaturized BOBarray can fit an array of 60 pL- sized microwells that isolate single cells for cell lysis and the subsequent detection of protein markers. An enclosed 60 pL-sized microchamber defines a high concentration of proteins released from lysed single cells, leading to single-cell resolution of protein detection. The protein markers assayed in this study include organ-specific markers and drug targets that help to characterize the organ-of-origin and drug targets of isolated rare tumor cells from blood samples. This new approach enables handling a very small number of cells and achieves single-cell, multiplexed protein detection without loss of rare but clinically important tumor cells.
Circulating tumor cells (CTCs) are tumor cells that shed from tumor sites and enter into blood circulation. CTCs represent the molecular characteristics of the tumor and are generally believed a real-time “liquid biopsy” for cancer patients.1 CTCs are extraordinarily rare in a few milliliter of blood samples, down to a single cell, requiring single-cell resolution for molecular analysis. Genetic and transcriptional profiling of single CTCs has been reported.2–4 However, techniques for quantitatively profiling multiple proteins (e.g., organ-specific markers, proliferative markers, drug targets, and drug resistance-associated markers) with a single CTC resolution have not yet been achieved.1 The most common method is the immunofluorescence staining in which cells are fixed and stained with fluorescent antibodies, but is usually limited to 3–4 membrane and intracellular proteins.5 Fluorescent flow cytometry is the dominant workhorse in the field of single-cell protein quantification, featured with high throughput and high level of multiplexing, but is limited by inability to deal with a very low number of cells.6,7 Love and co-workers have developed the microengraving technique in which a large array of microwells isolate individual cells and quantify three secreted proteins by antibodies immobilized in the microwells.8–10 Therefore, it is greatly needed to develop a technology for single-cell, multiplexed detection of membrane and intracellular proteins in isolated CTC population that has a very small number of cells and also contains “contaminating” leukocytes.
In the past five years, we have developed a microfluidics-based single cell barcode chip (SCBC) technology to simultaneously detect a dozen of functional proteins released from a single cell, including secreted, membrane, and intracellular proteins.11,12 The SCBC platform utilizes a large number of 1 nL sized microchambers to isolate single cells for protein measurement and a miniaturized, spatially encoded antibody microarray that enables multiplexed protein detection. A theoretical model was also developed to establish a new signaling network model that promoted understanding of the regulation mechanism based on single-cell proteomic data obtained from the SCBC platform.13 Further, Fan et al. modified the spatially encoded antibody microarray with multiplex fluorescence labeling and then successfully achieved codetection of 45 secreted proteins at the single cell level.14 However, for functional proteins with low copy numbers, a 1 nL sized microchamber defines a low concentration of proteins that are released from single cells upon lysis, leading to difficulty in reliable protein detection. For this reason, a reduction of microchamber size from 1 nL to 60 pL leads to an increase of protein concentration by ∼16× and a decrease of protein diffusion time that greatly enhance the limit of detection of low abundant functional proteins. However, a 60 pL sized microchamber cannot accommodate the spatially encoded antibody barcode that we developed before, requiring a new approach to create miniaturized antibody microarray with enhanced density.
In this study, a beads-on-barcode antibody microarray (BOBarray) has been created to achieve multiplexed protein detection by assigning two independent identifiers (bead size and fluorescent color) to each protein. Four bead sizes (1.75, 3, 4.5, and 6 μm) and three colors (blue, green, and yellow) are utilized to encode up to 12 different proteins. The miniaturized BOBarray can fit an array of 60 pL sized microchambers that isolate single cells for cell lysis and the subsequent detection of proteins, including organ-specific markers and drug targets. These protein markers help to characterize the organ-of-origin and drug targets of isolated CTCs from peripheral blood samples of cancer patients. The number of 60 pL sized microwells on the microchip for protein assay is 15000 in this study, much higher than that of cells in the isolated CTC population. For this reason, this new approach enables handling a very small number of cells and achieves single-cell, multiplexed protein detection without loss of rare but clinically important tumor cells.15
Experimental Section
Cell Lines and Reagents
HCT116, A549, H1975, H1650, and HCC827 cell lines were purchased from the cell bank of Chinese Academy of Sciences. HCT116 cells were routinely maintained in ATCC-formulated McCoy’s 5A modified medium containing 10% (v/v) fetal bovine serum (FBS) in humidified atmosphere of 5% CO2 and 95% air at 37 °C. A549, H1650, H1975, and HCC827 cells were routinely maintained in RPMI 1640 medium supplemented with 10% (v/v) FBS. Size- and color-encoded Fluoresbrite Carboxylate beads (see Table S1) and PolyLink Protein Coupling Kit were purchased from Polyscience, Inc. Antibody pairs used in single-cell assays were listed in Table S2. Alexa Fluor 647 Antibody Labeling Kit was purchased from Life Technologies. Biotinylated antibodies (anti-EpCAM and anti-EGFR) were purchased from R&D Systems. Streptavidin-coated magnetic beads (0.8 μm) were purchased from Solulink. The 0.1% (w/v) PLL solution was purchased from Sigma-Aldrich. PLL-coated glass slides were obtained from Thermo Fisher Scientific. Three sets of optical filter modules (365 nm/410 nm, 440 nm/485 nm, 530 nm/565 nm) were purchased from Chroma Technology Corp.
Fabrication of the Microwell Array Chip
The microwell chip was fabricated in poly(dimethylsiloxane) (PDMS) using standard microfabrication soft-lithographic techniques. A replicate for molding the PDMS was obtained by patterning a silicon wafer using photoresist SU-8 2050. The PDMS prepolymer (Sylgard 184) was mixed in a ratio of 10:1, and subsequently casted on this lithographically patterned replicate. After curing at 80 °C for 2 h, the PDMS component was separated from the replicate.
Fabrication of the BOBarray
A fresh PLL barcode is patterned through the microchannel-guided flowing on a PLL- coated glass slide with fresh PLL stripes of 20 μm wide and 30 μm spacing.11 Following blocking with 1% BSA/PBS, a mixture of color- and size-encoded, antibody-conjugated beads are incubated with the PLL barcode to create a surface-immobilized bead assembly with a barcode pattern. After washing off the excess beads, a microwell chip that each microwell has a diameter of 40 μm is applied to remove the beads outside the microwells and therefore create an array of 20 μm × 40 μm bead-assembled barcodes. Each bead-assembled barcode stripe consists of all antibody-conjugated, size, and color-encoded beads and can be accommodated in 60 pL sized microwells (diameter: 50 μm; height: 30 μm).
Single-Cell, Multiplexed Protein Detection of Rare Tumor Cells
A cell suspension containing <1500 cells was applied onto a microwell chip containing 15000 microwells. Images of each microwell were recorded using a CCD camera and used later for cell counting. After removal of PBS in the microwells by a water-adsorbing paper, cold, concentrated cell lysis buffer (2×, cell signaling) with protease inhibitor (Roche) was added onto the microwell chip. Excess lysis buffer was carefully removed by a piece of parafilm. A glass slide coated with BOBarray was placed face-down on top of the microwell chip, and compression was applied using clamps to avoid contamination between microwells. The clamped chip was placed on the ice with gentle shaking for 10 min, followed by incubation for 1 h at room temperature to allow the capture of released protein by bead-bearing antibodies. The glass slide was then separated from the microwell chip, washed with 1% BSA/PBS and incubated with a 200 μL cocktail containing Alexa-Fluor 647-modified detection antibodies to complete the sandwich-based immunoassay.
Isolation of Rare Tumor Cells from Blood Samples
Blood samples were obtained from healthy donors in Shanghai Municipal Hospital of Traditional Chinese Medicine with informed consent. A total of 200 cultured tumor cells were spiked into 1 mL of whole blood that was collected into EDTA- contained vacutainer tubes. The spike-in blood sample was centrifuged at 200 g for 5 min to remove the platelet-rich plasma. The cell pellet was resuspended in Hank’s balanced salt solution (HBSS) to generate a new 2 mL cell suspension and then actively incubated with a mixture of EpCAM-coated and EGFR-coated immunomagnetic beads (0.8 μm) for 1 h. The cell suspension was diluted with HBSS to 10 mL and then processed through a herringbone chip preblocked with 3% BSA and 10% normal goat serum at the flow rate of 20 mL/h. An array of magnets was placed on the chip to capture magnetic bead-coated tumor cells. After a wash (20 mL/h, 2 min) with HBSS to remove nonspecifically bound blood cells, magnets were retracted and tumor cells were released and collected in a ∼200 μL of solution.16,17
Data Processing and Analysis
A fluorescence microscope equipped with a motorized stage is utilized to automatically take images for the entire chip. Bright field and phase contrast images are used to identify the bead size and microwell address. Fluorescence images taken under Bright Blue (BB), Yellow Green (YG), and Yellow Orange (YO) channels are used to identify the color code and location of each bead, while images taken under Cy5 (red) channel are used for quantifying the protein signal as well as the internal positive control. Since different proteins may have different limit of detection and dynamic range, the exposure time and gain are carefully optimized. We develop an image processing and data extraction program with a feature recognition algorithm. The algorithm recognizes each individual bead in a microwell, reads its size, color, and the protein signal that are recorded by fluorescence microscope. The average signal for each protein in each microwell is computed. Statistical analysis was performed with GraphPad Prism 5.0. The differences between group means were evaluated with Student t test.
Results and Discussion
Working Principle of the BOBarray Platform
In the BOBarray scheme, the beads for detecting a specific functional protein are assigned to an explicit size and color, thus, allowing each protein to be identified by two independent variables (bead size and color). Four bead sizes (1.75, 3, 4.5, and 6 μm) and three different fluorescent colors (blue, green, and yellow) are utilized to encode 12 proteins (Figure 1A). The key enabling technology is the large-scale patterning of high quality BOBarray that fits an array of 60 pL sized microwells. As shown in Figure S1, a fresh poly-L-lysine (PLL) barcode with 20 μm wide and 30 μm spacing is patterned through the microchannel-guided flowing on a PLL-coated glass slide.11–13 Following blocking with 1% BSA/PBS, a mixture of color- and size-encoded, antibody-conjugated beads are incubated with the fresh PLL barcode to create a surface-immobilized bead assembly in the format of a barcode. After washing off excess beads, a microwell chip that each microwell has a diameter of 40 μm is applied to remove the beads outside the microwells and therefore create an array of 20 μm × 40 μm bead-assembled barcodes. Each bead-assembled barcode stripe consists of all antibody-conjugated, size and color-encoded beads and can be accommodated in 60 pL sized microwells (diameter: 50 μm; height: 30 μm). Since the number of microwells is significantly higher than the cells to be analyzed, each microwell contains at most one cell based on the Poisson distribution. Concentrated lysis buffer is added on the microwell chip that is then sealed against a glass slide coated with BOBarray. Bead-bearing antibodies capture proteins released from lysed single cells, followed by addition of Alexa-Fluor 647-modified detection antibodies to complete the sandwich-based immunoassay (Figure 1B,C). For signal readout and data analysis, bright field and phase contrast images are used to identify the bead size and microwell address. Fluorescence images taken under Bright Blue (BB, blue), Yellow Green (YG, green), and Yellow Orange (YO, yellow) channels are utilized to identify the color code and location of each bead, while images taken under Cy5 (red) channel are employed for quantifying the protein signal as well as the internal positive control. An algorithm is developed to recognize each individual bead in a microwell and reads its size, color, and the protein signal for further analysis.
Figure 1.
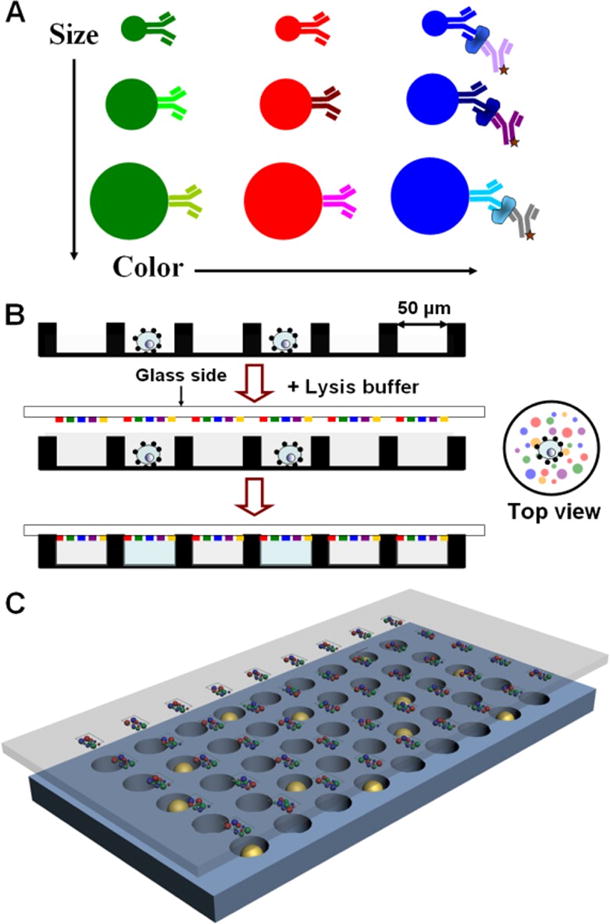
Strategy of BOBarray-based single-cell multiplexed protein detection. (A) Antibodies conjugated to size and color-encoded beads. Sizes of beads include 1.75, 3, 4.5, and and 6 μm with a CV lower than 7%. Color spectra are blue (Ex/Em: 360 nm/407 nm), green (Ex/Em: 441 nm/486 nm), and yellow (Ex/Em: 530 nm/546 nm). Proteins are measured by sandwich-based immunoassay. (B) Work flow BOBarray- based single-cell multiplexed protein detection. (C) Schematic representation of glass-bound BOBarray overlaid with an array of 60 pL sized microwells.
Fabrication and Validation of the BOBarray Platform
Figure 2A shows the large-scale BOBarray under fluorescence microscope and overlaid with microwell chip under bright field. A single 60 pL sized microwell integrated with BOBarray is shown in Figure 2B. The microwell chip has a total of 15000 microwells and is, obviously, expandable (Figure S2). When applying a small number of cells onto the microwell chip, each microwell contains at most one cell because of the Poisson distribution, as shown in Figure 2C. Single cells in the microwells can be lysed by adding concentrated lysis buffer on the chip, followed by sealing the microwells with a BOBarray- coated glass substrate. As shown in Figure S3, single cells are rapidly lysed in ~30 s and no crosstalk is observed between neighboring microwells. An algorithm is utilized to recognize each individual bead in the microwells and read its size and color for calculating the bead distribution among all microwells (Figures 2D and S4). The distributions follow the Gaussian distribution and centered at 12, 8, and 3 beads for 1.75, 3, and 4.5 μm beads, respectively, which can be tuned by adjusting the concentration of the bead solutions (Figure S4). For the 6 μm beads, they are usually not present in each microwell and utilized as the positive control for the assay.
Figure 2.
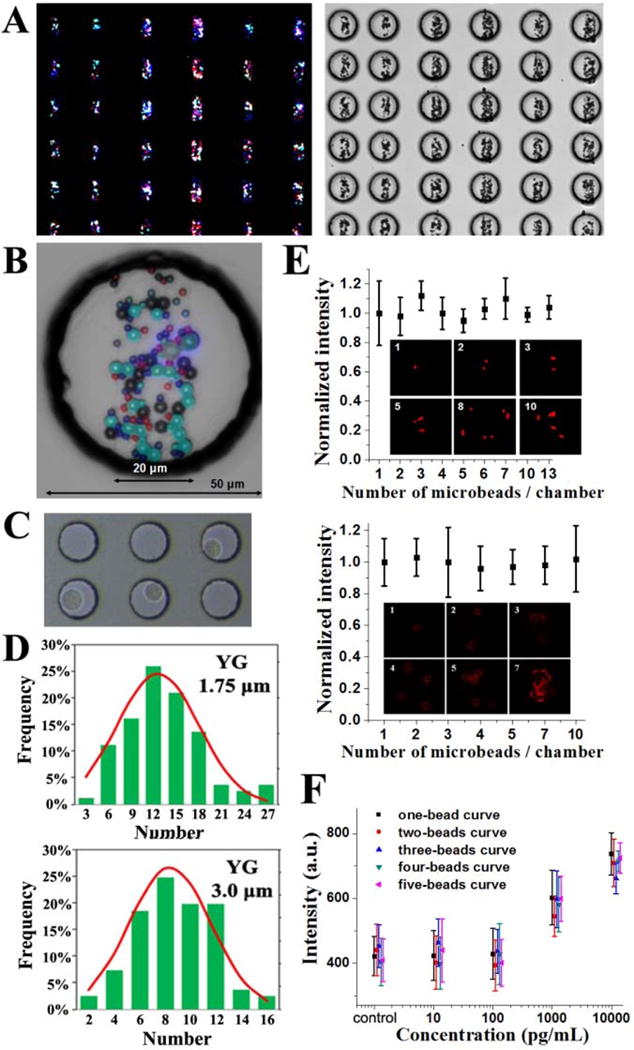
(A, B) Large-scale BOBarray under fluorescence microscope and overlaid with microwell chip under a bright field. (C) Isolated single cells in the microwells. (D) Distribution of the number of beads in the microwells. (E) Normalized intensity assayed from CK20 and EpCAM standard proteins with different numbers of beads per chamber. Error bars represent the standard deviation from at least eight replicate measurements. (F) BOBarray calibration curves of CK20 calculated from microwells with different numbers of beads. Error bars are contained within data points and represent at least 10 measurements.
Since the number of beads in each microwell is variable, it is important to investigate the relationship between the number of beads and averaged fluorescence intensity assayed from standard proteins. Figure 2E shows the protein fluorescence signals of the beads by incubating with 1 ng/mL CK20 and 10 ng/mL EpCAM standard proteins in the microwells. Anti- CK20 and anti-EpCAM antibodies are conjugated to 1.75 μm YO beads and 3 μm YG beads, respectively. The results show that the averaged fluorescence intensity is, statistically, invariable under a different number of beads in each microwell. Figure 2F shows the calibration curves of CK20 calculated from microchambers containing one, two, three, four and five beads, further demonstrating the irrelevance of average fluorescence intensity with the number of beads. For this reason, we are able to directly compare signals from microchambers with different number of beads. This greatly simplifies the data processing and results interpretation.
The one-bead calibration curve of EpCAM is established by using standard proteins with a series of concentrations, as shown in Figure 3A. A limit of detection is calculated to be around 1 ng/mL by extrapolating the background EpCAM concentration plus three standard deviations of the background using a four-parameter logistic fit. A total of 1 ng/mL of EpCAM in a 60 pL sized microwell corresponds to ~700 molecules (molecular weight of EpCAM standard protein:~54000). This assay is therefore capable of quantitating the number of EpCAM molecules on each cell. Three non-small cell lung cancer (NSCLC) cell lines are then profiled. As shown in Figure 3B, A549, H1650, and H1975 cells are calculated to have an average of ∼7700, ∼98000, and 290000 EpCAM molecules, respectively, which is close to the estimation in the previous study.18
Figure 3.
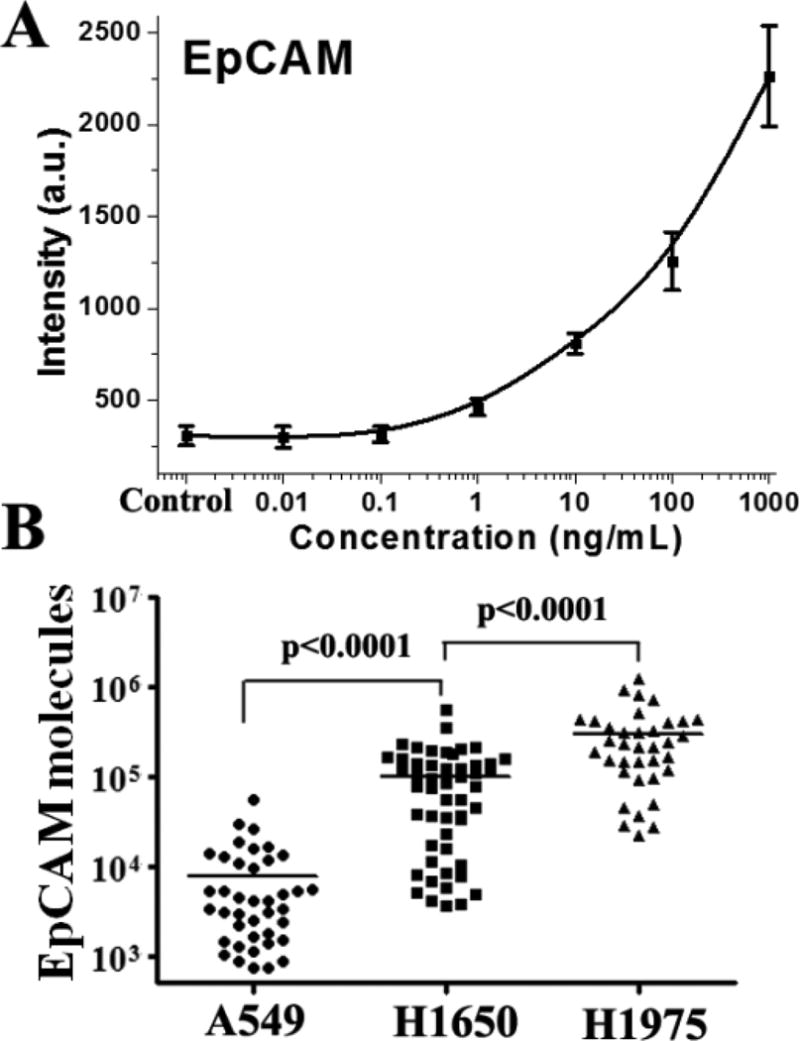
(A) A BOBarray calibration curve of EpCAM based on the measurements from one-bead microwells. Error bars are contained within data points and represent at least 10 measurements. (B) Measurement of EpCAM molecules of A549, H1650, and H1975 cells based on the calibration curve, microwell size, and the molecular weight of EpCAM standard protein. Means are shown in the figure.
Single-Cell Multiplexed Protein Detection of Rare Tumor Cells Isolated from Blood Samples
Characterization of CTC at the protein level includes organ-specific markers, proliferative markers, drug targets, and drug resistance-associated markers. For example, it has been found that organ-specific immunostaining profiles using multiple protein markers enable highly sensitive and specific determination of organ of primary tumor origin, which is useful for metastatic cancer with an unknown primary site.19 Obviously, these organ-specific markers can be applied to evaluate the origin of CTCs. Meanwhile, there are commercially available antibodies directly against the mutant proteins of driver oncogenes which have commercial targeted drugs, such as EGFR tyrosine kinase inhibitors (TKI). In this study, a panel of six protein markers are investigated for molecularly character- izing putative CTCs that are isolated from blood samples of cancer patients, including organ-specific markers (TTF-1, CK7, CK20), drug targets (EGFR L858R, EGFR E746_A750del, or del19), and the common leukocyte marker (CD45) as an exclusion marker. Standard proteins and cell lysates of cancer cell lines are utilized to validated the antibody pairs shown in Table S2 and the BOBarray technology. The cell lines used in this study include a colon cancer cell line HCT116 and three NSCLC cell lines H1975 (EGFR with L858R point mutation), H1650 (EGFR with E746_A750del) and HCC827 (EGFR amplification with E746_A750del). As shown in Figure 4A, the results show a CK7+/CK20−/TTF-1+/EGFR del19−/EGFR L858R+/CD45− phenotype of H1975 cells, a CK7+/CK20−/TTF-1+/EGFR del19−/EGFR L858R−/CD45− phenotype of H1650 cells and a CK7−/CK20+/TTF-1−/EGFR del19−/EGFR L858R−/CD45− phenotype of HCT116 cells, which is consistent with previous reports.19,20 It is noted that EGFR 19del is detected in HCC827 cells with an amplification of EGFR del19 rather than H1650 cells. The validation results demonstrate the specificity of antibody pairs used in this study.
Figure 4.
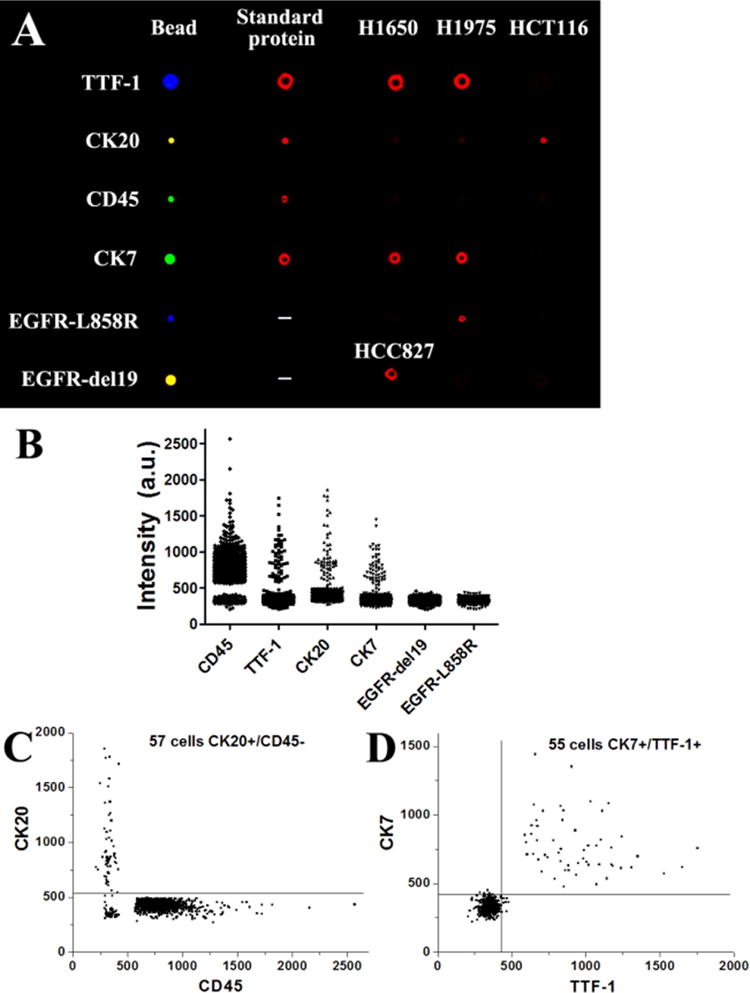
(A) Validation of antibody pairs with standard proteins and lysate of cancer cell lines. (B) Single-cell measurements of six target proteins in an isolated tumor cell population. Rare tumor cells were first were spiked in the blood sample taken from a healthy donor and then isolated by a microfluidics-based immunomagnetic technology. (C, D) Scatter plots of target proteins from the single-cell measurements.
For profiling a panel of proteins on CTCs, a microfluidics- based immunomagnetic technology we developed before16,17 is first employed to isolate rare tumor cells (see Experimental Section), followed by applying the cell suspension onto the microwell chip. With the guide of magnetic field, all magnetic bead-coated cells easily move into the microwells and are trapped in them, leading to little loss of rare tumor cells. Since the number of microwells is greatly larger than that of isolated tumor cells and “contaminating” leukocytes, each microwell contains 0 or 1 cell. On-chip cell lysis is then conducted, followed by sealing the microwells with a BOBarray- immobilized glass substrate to create enclosed microchambers for incubation of released proteins with bead-bound antibodies. For proof-of-principle demonstration, 100 A549 cells (lung cancer) and 100 HCT116 cells (colon cancer) were mixed and spiked in 1 mL of whole blood sample taken from a healthy donor. After on-chip isolation of tumor cells and BOBarray- based multiplexed protein assay, a total of 1109 single cells, including tumor cells and leukocytes, were finally analyzed on the microwell chip. Among the results of single-cell protein assays (Figure 4B), CD45, TTF-1, CK7, and CK20 exhibit two subpopulations. A CD45 versus CK20 scatter plot is shown in Figure 4C. The cutoff value of CK20 is defined by background signal plus 3 standard deviations of the background. Based on this cutoff value, 57 cells are found as a CD45-/CK20+/TTF-1−/CK7−/EGFR L858R+/EGFR del19− phenotype, characteristic for HCT116 cells. Likewise, 55 cells (Figure 4D) are found as a TTF-1+/CK7+/CD45−/CK20−/EGFR L858R+/EGFR del19− phenotype, consistent with the protein profile of A549 cells. A total of 982 cells are CD45+/CK20−/TTF-1−/CK7−/EGFR L858R+/EGFR del19− and therefore identified as leukocytes (Figure S5). There are also 15 cells exhibiting negative for all six target proteins. This experiment demonstrates that the BOBarray-based technology is able to identify rare tumor cells and determine their organ-of-origin from a cell mixture based on protein expression profiles and is compatible with technologies of CTC isolation.
Discussion
The highly flexible and scalable bead-based protein detection scheme has been extensively used in fundamental research and clinical diagnosis for analyzing various analytes in serum or bulk cell lysate. For example, Luminex’s xMAP technology uses color-coded beads to realize colorimetrically multiplexed protein detection. However, this method is limited by its low sensitivity and fails to realize single-cell resolution.21 Recently, single molecule assay (SiMoA), an ultrasensitive bead-based assay for protein quantification, has been developed and employed to detect PSA secretion at the single-cell level.22 SiMoA fails to achieve a large number of single-cell measurements with multiplexed protein detection. In this study, we describe a BOBarray-based method that enables thousands of single-cell multiplexed protein measurements. BOBarray-based method is a variant of planar antibody microarray in which size- and color-coded beads are utilized to achieve measurement of up to 12 proteins simultaneously. Importantly, the capability of 15000 single-cell assay enables detection of rare CTCs out of thousands of leukocytes at the protein level. Current CTC enrichment approaches usually lead to thousands of “contaminating” leukocytes in the isolated CTC population.
For CTC characterization, it is important to profile a panel of proteins with single-cell precision for resolving its phenotype, organ-of-origin and drug targets. Current methods for CTC characterization mostly rely on two or three protein markers such as epithelial markers (EpCAM, pan-CK) and leukocyte marker (CD45) by traditional immunostaining. This strategy fails to determine the malignancy, organ of origin, and drug targets of the putative CTCs. Besides tumor cells that shed from primary sites and enter into the circulation, recent evidence has shown that benign epithelial cells can also dissociate from diseased organs and are therefore present in the peripheral blood of patients with benign pancreas,23 colon,24 prostate,25 and lung disease.26 Meanwhile, circulating endothelial cells associated with tumor angiogenesis are reported to be present in the peripheral blood and to exhibit malignant cytomorphological features as well as epithelial and mesenchymal markers.27 For these reasons, it is important to determine the malignancy, organ-of-origin, and drug targets for putative CTCs to distinguish them from benign cells, especially those isolated from patients without clinically detectable tumors such as cancer patients after radical surgery. Utilization of a panel of protein markers is able to achieve this aim. First, it has been reported that a panel of organ-specific protein markers, including TTF-1, CK7, CK20, and so on, can be utilized to correctly predict the primary site in patients with metastatic adenocarcinoma of unknown origin, including colon, breast, ovary, lung, stomach, pancreas, and bile duct.19,28 Second, antibodies against mutant proteins of driver oncogenes, for example EGFR-L858R and EGFR del19 mutation in lung cancer, are now commercially available, which helps to determine the malignancy and drug targets for EGFR TKI. Third, besides genetic mutations, there are also targeted and immune therapies requiring detection of protein expression such as HER2 and PD-L1. The above three reasons justify the need of developing technologies for detection of a panel of protein markers for rare tumor cells at the single-cell level. For postoperative cancer patients without clinical detectable tumor by imaging methods, this technology characterize the malignancy, organ-of-origin and drug targets of putative CTCs for monitoring recurrence and guiding molecular targeted therapies.
BOBarray technology, together with the microwell chip, create a platform for single-cell multiplexed detection of target molecules based on specific antibodies. These target molecules include organ-specific proteins and mutant proteins that we demonstrate in this study, and can be expandable to metabolites associated with cellular metabolic signal regulation. Xue et al. simultaneously quantitated metabolites (c-AMP, c- GMP, GSH) and metabolism-related proteins in single cells based on substrate-coated antibody barcodes.29 For this reason, our platform has the potential to detect protein levels, mutations, and metabolism simultaneously at the single-cell level from rare tumor cells.
In this study, we have demonstrated the single-cell resolution of the BOBarray technology for multiplexed protein detection. However, other factors influencing the detection limit include the loss of target cells during steps of sample processing and on-chip measurement. We employ a microfluidics-based immunomagnetic method to isolate rare tumor cells directly from whole blood samples with a recovery rate at ∼60% with high cell viability.17 This method enables direct enrichment of CTCs from whole blood samples into a cell suspension containing <1500 contaminating leukocytes. Isolated tumor cells coated with magnetic beads are applied onto the microwell chip and rapidly move into microwells under the guide of magnetic field for downstream cell lysis and protein detection, leading to no loss of target tumor cells in this step. Overall, the BOBarray-based, on-chip multiplexed protein measurement of rare tumor cells has a detection limit of one cell, but for CTC enrichment, as low as five tumor cells are required for reliable CTC detection.
Conclusions
A beads-on-barcode antibody microarray (BOBarray) has been created to achieve multiplexed protein detection by assigning two independent identifiers (bead size and fluorescent color) to each protein. The miniaturized BOBarray can fit an array of 60 pL sized microchambers that isolate single cells for cell lysis and the subsequent detection of protein markers. The protein markers assayed in this study include organ-specific markers and drug targets that help to characterize the organ of origin and drug targets of isolated CTCs from blood samples of cancer patients. Importantly, this new approach enables handling a very small number of cells and achieves single-cell, multiplexed protein detection without loss of rare tumor cells.
Supplementary Material
Acknowledgments
The research was supported by National Natural Science Foundation of China (Grant Nos. 81371712 and 81373621). Q.H.S. is sponsored by Youth Program of the National 1000 Talents Project. W.W. is supported by NIH Grant 1U54 CA199090-01 and Phelps Family Foundation. L.Y. is supported by China Postdoctoral Science Foundation (Grant No. 2015M581604). Y.L.D. is supported by Natural Science Foundation of Shanghai (Grant No. 13ZR1456100).
Footnotes
Supporting Information
The Supporting Information is available free of charge on the ACS Publications website at DOI: 10.1021/acs.anal-chem.6b03086.
Antibodies and standard proteins used in this study. Size- and color-encoded Fluoresbrite Carboxylate beads. Fabrication of BOBarray. Single cells before and after lysis in microwells. Distribution of different beads in the microwells. Distribution of CD45 expression on leukocytes.
Author Contributions
Q.H.S., W.W., and Y.L. designed research. Y.L. contributed healthy donor’s blood samples. L.Y. performed single-cell protein detection experiments. Z.H.W. isolated rare tumor cells from the blood samples. Y.L.D. fabricated microwell chip. Q.H.S. and W.W. analyzed the data and wrote the manuscript. All authors reviewed the manuscript.
Notes
The authors declare no competing financial interest.
References
- 1.Krebs MG, Metcalf RL, Carter L, Brady G, Blackhall FH, Dive C. Nat Rev Clin Oncol. 2014;11:129–144. doi: 10.1038/nrclinonc.2013.253. [DOI] [PubMed] [Google Scholar]
- 2.Ramskold D, Luo S, Wang Y, Li R, Deng Q, Faridani O, Daniels GA, Khrebtukova I, Loring JF, Laurent LC. Nat Biotechnol. 2012;30:777–782. doi: 10.1038/nbt.2282. [DOI] [PMC free article] [PubMed] [Google Scholar]
- 3.Yu M, Ting DT, Stott SL, Wittner BS, Paul Ozsolak F, Ciciliano JC, Smas ME, Winokur D, Gilman AJ, Ulman MJ, Xega K, Contino G, Alagesan B, Brannigan BW, Milos PM, Ryan DP, Sequist LV, Bardeesy N, Ramaswamy S, Toner M, Maheswaran S, Haber DA. Nature. 2012;487:510–U130. doi: 10.1038/nature11217. [DOI] [PMC free article] [PubMed] [Google Scholar]
- 4.Ni X, Zhuo M, Su Z, Duan J, Gao Y, Wang Z, Zong C, Bai H, Chapman AR, Zhao J, Xu L, An T, Ma Q, Wang Y, Wu M, Sun Y, Wang S, Li Z, Yang X, Yong J, Su X-D, Lu Y, Bai F, Xie XS, Wang J. Proc Natl Acad Sci U S A. 2013;110:21083–21088. doi: 10.1073/pnas.1320659110. [DOI] [PMC free article] [PubMed] [Google Scholar]
- 5.Yu M, Stott S, Toner M, Maheswaran S, Haber DA. J Cell Biol. 2011;192:373–382. doi: 10.1083/jcb.201010021. [DOI] [PMC free article] [PubMed] [Google Scholar]
- 6.Irish JM, Hovland R, Krutzik PO, Perez OD, Bruserud Ø, Gjertsen BT, Nolan GP. Cell. 2004;118:217–228. doi: 10.1016/j.cell.2004.06.028. [DOI] [PubMed] [Google Scholar]
- 7.Sachs K, Perez O, Pe’er D, Lauffenburger DA, Nolan GP. Science. 2005;308:523–529. doi: 10.1126/science.1105809. [DOI] [PubMed] [Google Scholar]
- 8.Yamanaka YJ, Szeto GL, Gierahn TM, Forcier TL, Benedict KF, Brefo MSN, Lauffenburger DA, Irvine DJ, Love JC. Anal Chem. 2012;84:10531–10536. doi: 10.1021/ac302264q. [DOI] [PMC free article] [PubMed] [Google Scholar]
- 9.Han Q, Bradshaw EM, Nilsson B, Hafler DA, Love JC. Lab Chip. 2010;10:1391–1400. doi: 10.1039/b926849a. [DOI] [PMC free article] [PubMed] [Google Scholar]
- 10.Han Q, Bagheri N, Bradshaw EM, Hafler DA, Lauffenburger DA, Love JC. Proc Natl Acad Sci U S A. 2012;109:1607–1612. doi: 10.1073/pnas.1117194109. [DOI] [PMC free article] [PubMed] [Google Scholar]
- 11.Shi Q, Qin L, Wei W, Geng F, Fan R, Shin YS, Guo D, Hood L, Mischel PS, Heath JR. Proc Natl Acad Sci U S A. 2012;109:419–424. doi: 10.1073/pnas.1110865109. [DOI] [PMC free article] [PubMed] [Google Scholar]
- 12.Ma C, Fan R, Ahmad H, Shi Q, Comin-Anduix B, Chodon T, Koya RC, Liu C-C, Kwong GA, Radu CG. Nat Med. 2011;17:738–743. doi: 10.1038/nm.2375. [DOI] [PMC free article] [PubMed] [Google Scholar]
- 13.Wei W, Shi Q, Remacle F, Qin L, Shackelford DB, Shin YS, Mischel PS, Levine R, Heath JR. Proc Natl Acad Sci U S A. 2013;110:E1352–E1360. doi: 10.1073/pnas.1303060110. [DOI] [PMC free article] [PubMed] [Google Scholar]
- 14.Lu Y, Xue Q, Eisele MR, Sulistijo ES, Brower K, Han L, Amir E-AD, Pe’er D, Miller-Jensen K, Fan R. Proc Natl Acad Sci U S A. 2015;112:E607–E615. doi: 10.1073/pnas.1416756112. [DOI] [PMC free article] [PubMed] [Google Scholar]
- 15.Wei W, Shin YS, Ma C, Wang J, Elitas M, Fan R, Heath JR. Genome Med. 2013;5:75. doi: 10.1186/gm479. [DOI] [PMC free article] [PubMed] [Google Scholar]
- 16.Zhang Y, Tang Y, Sun S, Wang Z, Wu W, Zhao X, Czajkowsky DM, Li Y, Tian J, Xu L, Wei W, Deng Y, Shi Q. Anal Chem. 2015;87:9761–9768. doi: 10.1021/acs.analchem.5b01901. [DOI] [PubMed] [Google Scholar]
- 17.Wang Z, Wu W, Wang Z, Tang Y, Deng Y, Xu L, Tian J, Shi Q. Analyst. 2016;141:3621. doi: 10.1039/c5an02554k. [DOI] [PubMed] [Google Scholar]
- 18.Pecot CV, Bischoff FZ, Mayer JA, Wong KL, Pham T, Bottsford-Miller J, Stone RL, Lin YG, Jaladurgam P, Roh JW, Goodman BW, Merritt WM, Pircher TJ, Mikolajczyk SD, Nick AM, Celestino J, Eng C, Ellis LM, Deavers MT, Sood AK. Cancer Discovery. 2011;1:580–586. doi: 10.1158/2159-8290.CD-11-0215. [DOI] [PMC free article] [PubMed] [Google Scholar]
- 19.Dennis JL, Hvidsten TR, Wit EC, Komorowski J, Bell K, Downie I, Mooney J, Verbeke C, Bellamy C, Keith WN, Olien KA. Clin Cancer Res. 2005;11:3766–3772. doi: 10.1158/1078-0432.CCR-04-2236. [DOI] [PubMed] [Google Scholar]
- 20.Sikandar SS, Pate KT, Anderson S, Dizon D, Edwards RA, Waterman ML, Lipkin SM. Cancer Res. 2010;70:1469–1478. doi: 10.1158/0008-5472.CAN-09-2557. [DOI] [PMC free article] [PubMed] [Google Scholar]
- 21.Yu X, Hartmann M, Wang Q, Poetz O, Schneiderhan- Marra N, Stoll D, Kazmaier C, Joos TO. PLoS One. 2010;5:e13125. doi: 10.1371/journal.pone.0013125. [DOI] [PMC free article] [PubMed] [Google Scholar]
- 22.Schubert SM, Walter SR, Manesse M, Walt DR. Anal Chem. 2016;88:2952–2957. doi: 10.1021/acs.analchem.6b00146. [DOI] [PubMed] [Google Scholar]
- 23.Rhim AD, Thege FI, Santana SM, Lannin TB, Saha TN, Tsai S, Maggs LR, Kochman ML, Ginsberg GG, Lieb JG, Chandrasekhara V, Drebin JA, Ahmad N, Yang YX, Kirby J, Stanger BZ. Gastroenterology. 2014;146:647–651. doi: 10.1053/j.gastro.2013.12.007. [DOI] [PMC free article] [PubMed] [Google Scholar]
- 24.Pantel K, Deneve E, Nocca D, Coffy A, Vendrell JP, Maudelonde T, Riethdorf S, Alix-Panabieres C. Clin Chem. 2012;58:936–940. doi: 10.1373/clinchem.2011.175570. [DOI] [PubMed] [Google Scholar]
- 25.Murray NP, Reyes E, Badinez L, Orellana N, Fuentealba C, Olivares R, Porcell J, Duenas R. J Oncol. 2013;2013:1–5. doi: 10.1155/2013/281291. [DOI] [PMC free article] [PubMed] [Google Scholar]
- 26.Ilie M, Hofman V, Long-Mira E, Selva E, Vignaud JM, Padovani B, Mouroux J, Marquette CH, Hofman P. PLoS One. 2014;9:e111597. doi: 10.1371/journal.pone.0111597. [DOI] [PMC free article] [PubMed] [Google Scholar]
- 27.Cima I, Kong SL, Sengupta D, Tan IB, Phyo WM, Lee D, Hu M, Iliescu C, Alexander I, Goh WL, Rahmani M, Suhaimi NAM, Vo JH, Tai JA, Tan JH, Chua C, Ten R, Lim WJ, Chew MH, Hauser CAE, van Dam RM, Lim WY, Prabhakar S, Lim B, Koh PK, Robson P, Ying JY, Hillmer AM, Tan MH. Sci Transl Med. 2016;8:345ra89. doi: 10.1126/scitranslmed.aad7369. [DOI] [PubMed] [Google Scholar]
- 28.Dennis JL, Hvidsten TR, Wit EC, Komorowski J, Bell AK, Downie I, Mooney J, Verbeke C, Bellamy C, Keith WN, Olien KA. Clin Cancer Res. 2005;11:3766–3772. doi: 10.1158/1078-0432.CCR-04-2236. [DOI] [PubMed] [Google Scholar]
- 29.Xue M, Wei W, Su YP, Kim J, Shin YS, Mai WX, Nathanson DA, Heath JR. J Am Chem Soc. 2015;137:4066–4069. doi: 10.1021/jacs.5b00944. [DOI] [PMC free article] [PubMed] [Google Scholar]
Associated Data
This section collects any data citations, data availability statements, or supplementary materials included in this article.