

Abstract
Objective
Neurofilament light chains (NfL) are unique to neuronal cells, are shed to the cerebrospinal fluid (CSF), and are detectable at low concentrations in peripheral blood. Various diseases causing neuronal damage have resulted in elevated CSF concentrations. We explored the value of an ultrasensitive single‐molecule array (Simoa) serum NfL (sNfL) assay in multiple sclerosis (MS).
Methods
sNfL levels were measured in healthy controls (HC, n = 254) and two independent MS cohorts: (1) cross‐sectional with paired serum and CSF samples (n = 142), and (2) longitudinal with repeated serum sampling (n = 246, median follow‐up = 3.1 years, interquartile range [IQR] = 2.0–4.0). We assessed their relation to concurrent clinical, imaging, and treatment parameters and to future clinical outcomes.
Results
sNfL levels were higher in both MS cohorts than in HC (p < 0.001). We found a strong association between CSF NfL and sNfL (β = 0.589, p < 0.001). Patients with either brain or spinal (43.4pg/ml, IQR = 25.2–65.3) or both brain and spinal gadolinium‐enhancing lesions (62.5pg/ml, IQR = 42.7–71.4) had higher sNfL than those without (29.6pg/ml, IQR = 20.9–41.8; β = 1.461, p = 0.005 and β = 1.902, p = 0.002, respectively). sNfL was independently associated with Expanded Disability Status Scale (EDSS) assessments (β = 1.105, p < 0.001) and presence of relapses (β = 1.430, p < 0.001). sNfL levels were lower under disease‐modifying treatment (β = 0.818, p = 0.003). Patients with sNfL levels above the 80th, 90th, 95th, 97.5th, and 99th HC‐based percentiles had higher risk of relapses (97.5th percentile: incidence rate ratio = 1.94, 95% confidence interval [CI] = 1.21–3.10, p = 0.006) and EDSS worsening (97.5th percentile: OR = 2.41, 95% CI = 1.07–5.42, p = 0.034).
Interpretation
These results support the value of sNfL as a sensitive and clinically meaningful blood biomarker to monitor tissue damage and the effects of therapies in MS. Ann Neurol 2017;81:857–870
The clinical course of multiple sclerosis (MS) is highly variable, ranging from rapidly reversible episodes of impairment to severe disability within months after disease onset. Focal inflammation, chronic diffuse neuronal damage, and failure of repair or compensation all contribute to the development of permanent disability.1 Biomarkers reflecting tissue damage and allowing the monitoring of subclinical disease activity are highly desirable for assessment of therapeutic response and prediction of disability in both clinical studies and management of individual patients.2
Together with the medium and heavy subunits, neurofilament light chain (NfL) represents one of the scaffolding proteins of the neuronal cytoskeleton and is released in the extracellular space following axonal damage.3 NfL levels are increased in the cerebrospinal fluid (CSF) of MS patients as well as in degenerative and traumatic neurological diseases (eg, dementia, amyotrophic lateral sclerosis, and spinal cord injury).4, 5, 6, 7, 8, 9 CSF NfL levels are further increased during relapses and are positively associated with magnetic resonance imaging (MRI) lesion load and disability scores in MS.10, 11, 12 Noteworthy, CSF NfL levels have also been shown to be a marker of treatment response in this disease.13, 14, 15, 16, 17 However, lumbar punctures are relatively invasive procedures, limiting the value of CSF NfL in routine clinical settings.
A commercially available enzyme‐linked immunosorbent assay (ELISA; UmanDiagnostics, Umeå, Sweden) can be used to measure CSF NfL, but is not recommended for blood measurements. Using an electrochemiluminescence (ECL)‐based assay, we have found increased serum NfL (sNfL) concentrations in clinically isolated syndrome (CIS) and MS patients.11, 12, 18, 19 However, these studies were limited by the still relatively low sensitivity of the assay.20 A novel single‐molecule array (Simoa) assay has shown 126‐ and 25‐fold higher sensitivity than the ELISA and ECL assays, respectively.20, 21 This high sensitivity allows a more accurate quantification of the low sNfL concentrations expected in healthy controls (HC) and can help to better differentiate abnormal from normal values. Recent studies using this assay have shown that sNfL levels are increased in patients suffering from acute brain damage or chronic neurodegenerative disorders.22, 23, 24
This study had several aims: (1) to obtain a pilot estimate of the distribution of sNfL concentrations in HC and to investigate the potential influence of age and gender; (2) to compare paired sNfL and CSF NfL levels in MS patients; (3) to investigate the association between sNfL and number of T2 and contrast‐enhancing lesions in brain and spinal cord; (4) to investigate the association between sNfL and clinical features, including occurrence of relapses, worsening of disability, and treatment status; and (5) to test whether elevated sNfL levels can predict later disease activity and disability worsening.
Subjects and Methods
Clinical Settings, Patient Selection, and Sample Collection
Lugano Cohort
A cross‐sectional cohort (n = 142) was recruited between 2004 and 2015 at the Neurocenter of Southern Switzerland (Lugano, Switzerland), where paired serum and CSF samples are prospectively collected and stored as part of the diagnostic workup.25 Inclusion criteria were: (1) a diagnosis of CIS, relapsing–remitting MS (RRMS), primary progressive MS (PPMS), secondary progressive MS (SPMS), or radiologically isolated syndrome (RIS)26; (2) availability of serum and preferably also paired CSF samples at time of diagnosis; (3) availability of demographic and clinical data at time of diagnosis; and (4) availability of brain and preferably also spinal cord magnetic resonance images acquired as part of the diagnostic workup at time of diagnosis. All brain and spinal MRI included in the analysis were performed with a standardized protocol and using 1.5T and 3T scanners (Siemens Sonata and Siemens Skyra, Erlangen, Germany).27
Swiss Multiple Sclerosis Cohort Study Cohort
A longitudinal cohort (n = 246) was recruited between 2009 and 2016 at the Neurologic Clinic and Policlinic, University Hospital Basel (Switzerland), as part of the Swiss Multiple Sclerosis Cohort Study (SMSC), a prospective observational study in which demographic, neuroimaging, and clinical data as well as serum samples are collected every 6 or 12 months. Standardized clinical assessments with functional system score and Expanded Disability Status Scale (EDSS) calculation are performed by certified raters (http://www.neurostatus.net/).28, 29 All samples are collected within 8 days from the clinical visit and stored at −80°C following standardized procedures.25 Criteria for inclusion in this study were: (1) a diagnosis of CIS, RRMS, PPMS, or SPMS; (2) at least 2 but preferably 3 available serum samples collected at baseline and at follow‐up (FU) visits 1 and 2; (3) start of disease‐modifying treatment (DMT) or switch to a different DMT shortly after baseline sample and before first FU sample (this only for CIS and RRMS patients); and (4) availability of demographic and clinical data at time of sample collection including information on relapses and disability scores as measured by standardized assessment of the EDSS.
HC
Serum samples from 254 HC were collected between 2004 and 2007 in the Neurologic Clinic and Policlinic, University Hospital Basel, as part of the international cohort study GeneMSA (Genetic MS Associations).30 A 1‐year FU serum sample was available for 87 HC. Inclusion criteria were age = 18 to 70 years and no diagnosis of MS as well as no known cases of MS in the family.
Standard Protocol Approvals, Registrations, and Patient Consent
The study received ethical approval by independent ethics committees of the participating centers; all patients provided written, informed consent. The SMSC is registered with ClinicalTrials.gov (NCT02433028).
CSF and sNfL Measurements
We developed and validated a Simoa NfL assay using the capture monoclonal antibody (mAB) 47:3 and the biotinylated detector mAB 2:1 from UmanDiagnostics,31 transferred onto the Simoa platform. mAB 47:3 was buffer exchanged and diluted to 0.3mg/ml. Paramagnetic beads (4 × 10⁶; Quanterix Corporation, Lexington, MA) were buffer exchanged and activated using 0.5mg/ml 1‐ethyl‐3‐(3‐dimethylaminopropyl) carbodiimide (Quanterix), followed by a 30‐minute incubation at room temperature (RT; HulaMixer; Thermo Fisher Scientific, Waltham, MA). During a 2‐hour incubation at RT (HulaMixer) the diluted capture mAB was conjugated with the washed and activated beads. Subsequently, the beads were washed and blocked. After 3 washes, the conjugated beads were suspended and stored at 4°C. Biotinylated mAB 2:1 was obtained from UmanDiagnostics and stored at 4°C pending analysis.
The assay was run on a Simoa HD‐1 instrument (Quanterix) using a 2‐step Assay Neat 2.0 protocol; 100μl of calibrator/sample (diluent: Tris‐buffered saline [TBS], 0.1% Tween 20, 1% milk powder, 400μg/ml Heteroblock [Omega Biologicals, Bozeman, MT]), 25μl conjugated beads (diluent: TBS, 0.1% Tween 20, 1% milk powder, 300μg/ml Heteroblock), and 20μl of mAB 2:1 (0.1μg/ml; diluent: TBS, 0.1% Tween 20, 1% milk powder, 300μg/ml Heteroblock) were incubated for 47 cadences (1 cadence = 45 seconds). After washing, 100μl of streptavidin‐conjugated β‐galactosidase (150pM; Quanterix) was added, followed by a 7‐cadence incubation and a wash. Prior to reading, 25μl Resorufin β‐D‐galactopyranoside (Quanterix) was added. Calibrators (neat) and samples (serum: 1:4 dilution; CSF: 1:10 dilution) were measured in duplicates. Bovine lyophilized NfL was obtained from UmanDiagnostics. Calibrators ranged from 0 to 2,000pg/ml for serum and from 0 to 10,000pg/ml for CSF measurements. Batch prepared calibrators were stored at −80°C.
Intra‐ and interassay variability of the assay was evaluated with 3 native serum and 3 native CSF samples in 22 and 12 consecutive runs on independent days, respectively. For serum, the mean coefficients of variation (CVs) of duplicate determinations for concentration were 5.6% (13.3pg/ml, sample 1), 6.9% (22.5pg/ml, sample 2), and 5.3% (236.5pg/ml, sample 3). In CSF, the mean intra‐assay CVs were 2.5% (572.6pg/ml, sample 1), 0.7% (1,601.8pg/ml, sample 2), and 3.8% (6,110.2pg/ml, sample 3). Interassay CVs for serum were 11.3% (sample 1), 9.3% (sample 2), and 6.4% (sample 3). In CSF, interassay CVs were 10.1% (sample 1), 6.2% (sample 2), and 15.5% (sample 3). We used the concentration of the lowest calibrator fulfilling acceptance criteria (accuracy = 80–120%, CV of duplicate determination ≤ 20%) as an estimate of the analytical sensitivity.32 The analytical sensitivity was 0.32pg/ml. All samples produced signals above the analytical sensitivity of the assay. Few samples with intra‐assay CVs > 20% were repeat measured. Recovery rates ([concentration of spiked sample − concentration of native sample]/spiked concentration × 100) were tested in 4 serum and 4 CSF samples from HC spiked with 5, 50, and 200pg/ml and 500 and 2,000pg/ml of NfL, respectively. The mean recovery after spiking was 107% for serum and 121% for CSF. Parallelism and linearity of the assay for serum and CSF were confirmed by serial dilution experiments.32
Statistics
Categorical variables were described by counts and percentages, continuous and ordinal variables by median and interquartile ranges (IQRs). For all analyses, NfL levels were log‐transformed to meet the normal assumption. The distribution of sNfL in HC and its association with age was modeled by means of Generalized Additive Models for Location, Scale, and Shape (GAMLSS) using a Box‐Cox t distribution according to Rigby and Stasinopoulos,33 and cubic splines and percentile curves were obtained. To quantify the variability, bootstrapping was applied by drawing 100 random samples from the HC. From each sample, the percentile curves were estimated and the final reference percentiles across different ages represent averages over the 100 replicates together with the bootstrap confidence intervals (CIs).
In the cross‐sectional Lugano cohort, linear regression models were used to investigate the associations with log sNfL. Linear generalized estimating equation (GEE) models were similarly used to investigate associations with log sNfL in the SMSC cohort with repeated measurements. In all linear models with log sNfL as the dependent variable, regression coefficients (denoted with “β” throughout this work) were back‐transformed to the original scale and therefore reflect multiplicative effects (ie, an estimate of 1.05 means an increase of approximately 5% in sNfL).
In GEE models, different correlation structures were investigated and model selection was performed based on quasi‐likelihood under the independence model criterion (QIC).34 Based on expert input and signals observed in the graphical analysis, several interaction terms were investigated, and the final model was selected based on the QIC. To investigate the course of sNfL after treatment initiation, a linear GEE was used with time under treatment and baseline sNfL as additional covariates in the multivariate model, thereby excluding treatment status. This analysis was performed on all samples after treatment start.
Patients' sNfL levels were finally categorized based on the percentiles derived from the HC samples. Clinically meaningful events (relapses, annualized relapse rate [ARR], or EDSS worsening, both before and after sample collection) were then tested for association with sNfL levels above versus below various percentile cutoffs using GEE models. These analyses were performed for the percentile curves from each of the 100 bootstrap replicates. The 100 results were integrated into a final result using Rubin's rule. Therefore, the final results not only incorporate the standard errors of the GEE models but also take into account the uncertainty of the reference percentile curves. EDSS worsening was defined as an increase in EDSS since previous SMSC visit of ≥1.5 points from an EDSS score of 0.0, ≥1.0 point from an EDSS score of 1.0 to 5.5, or ≥0.5 point from an EDSS score ≥6.0 (median duration between visits = 6.4 months, IQR = 5.2–11.7). GEEs using a Poisson distribution were used to compare the incidence of relapses between percentile categories and calculate incidence rate ratios (IRRs) with 95% CIs. The models were tested for overdispersion,35 and the null hypothesis of equidispersion was not violated in any model. As a sensitivity analysis, negative binomial mixed effect models were used. However, these models tended to not converge further, supporting the use of a Poisson distribution. GEE models were similarly used to model binary outcomes (eg, presence vs absence of relapses and presence vs absence of EDSS increase) and estimate odds ratios (ORs) with 95% CIs. For all models, model‐predicted means (marginal means) and 95% CIs were calculated using the lsmeans package36 and predicted odds were converted to probabilities (p = odds / [1 + odds]). All analyses in which NfL was used to predict past and future clinical events were performed on a subset of the data excluding samples within 30 days after a relapse. As a sensitivity analysis, all analyses were repeated using all samples (ie, without removing samples shortly after a relapse) and using only the last sample at which patients were under similar conditions using generalized linear models (data not shown). The quality of all models was investigated by visually inspecting residuals and quantile–quantile plots. All analyses were conducted using the statistical software R.37
Results
sNfL Levels in HC
Age, Gender, and Temporal Variation
Most HC were females (n = 173, 68.1%), and the median age was 44.3 (IQR = 36.4–52.4) years. The median sNfL concentration was 22.9 (IQR = 16.8–31.4) pg/ml, with no statistically significant difference between males and females (23.4 [IQR = 17.1–32.1] vs 22.8 [IQR = 16.6–30.3] pg/ml; β = 1.032, 95% CI = 0.910–1.171, p = 0.622). A positive association was instead observed between sNfL and age, with a 2.2% increase in sNfL for each additional year (β = 1.022, 95% CI = 1.018–1.026, p < 0.001). Accordingly, median sNfL slightly increased (by 1.8%) in the 87 HC with a second serum sample after a median FU time of 367 (IQR = 364–385) days (baseline: 27.3 [IQR = 20.3–35.2] pg/ml; FU: 27.8 [IQR = 22.1–36.3] pg/ml). There was no association between sNfL and storage time (β = 0.959, 95% CI = 0.906–1.016, p = 0.157 after age correction).
Reference Percentile Curves
The distribution of sNfL across different ages was modeled by using GAMLSS (see Subjects and Methods). The resulting 80th, 90th, 95th, 97.5th, and 99th sNfL percentiles are presented in Table 1.
Table 1.
Estimated sNfL Percentiles Including Bootstrap Confidence Intervals across Different Ages Calculated Based on sNfL from Healthy Control Samples
| sNfL Percentiles, pg/ml | |||||
|---|---|---|---|---|---|
| Age, yr | 80th | 90th | 95th | 97.5th | 99th |
| 30 | 20.9 (19.3–22.4) | 24.3 (22.3–26.3) | 27.9 (25.1–30.4) | 31.6 (27.6–35.7) | 37.2 (30.9–44.4) |
| 35 | 23.3 (21.9–24.9) | 27.1 (25.3–29.2) | 31.1 (28.6–34.0) | 35.2 (31.7–39.6) | 41.5 (35.8–49.4) |
| 40 | 26.0 (24.7–27.5) | 30.3 (28.6–32.3) | 34.7 (31.9–37.8) | 39.3 (35.4–44.0) | 46.3 (40.1–54.9) |
| 45 | 29.1 (27.7–30.7) | 33.9 (32.2–35.9) | 38.9 (36.1–41.9) | 44.1 (39.8–49.2) | 51.9 (44.8–61.5) |
| 50 | 32.7 (31.1–34.8) | 38.1 (35.9–40.3) | 43.6 (40.7–47.0) | 49.5 (44.7–55.4) | 58.3 (50.3–69.4) |
| 55 | 36.5 (34.2–39.2) | 42.5 (39.7–45.4) | 48.7 (45.4–52.5) | 55.2 (50.4–61.6) | 65.0 (56.2–77.3) |
| 60 | 40.5 (37.7–44.0) | 47.2 (43.6–51.0) | 54.0 (49.6–58.8) | 61.3 (55.4–68.1) | 72.1 (62.3–85.1) |
| 65 | 44.6 (41.0–49.1) | 52.0 (47.3–57.1) | 59.5 (53.4–65.8) | 67.5 (60.0–75.9) | 79.5 (68.2–93.4) |
| 70 | 48.8 (44.2–54.3) | 56.9 (51.1–63.4) | 65.1 (57.2–73.2) | 73.9 (64.3–84.0) | 87.0 (73.8–102.7) |
sNfL = serum neurofilament light chain.
sNfL Levels in the Lugano Cohort
Demographic and Clinical Variables
Serum and paired CSF samples were available in 142 and 132 patients. The median age was 37.9 (IQR = 29.8–47.8) years, and 92 (64.8%) were female. There were 48 (33.8%) CIS, 62 (43.7%) RRMS, 16 (11.3%) PPMS, 3 (2.1%) SPMS, and 13 (9.1%) RIS patients. Brain and spinal cord MRI data were available at time of sample collection for 142 and 124 individuals, respectively. The median time between sample collection and the acquisition of brain and spinal cord MRI images was 5.0 (IQR = 1.0–19.5) and 13.0 (IQR = 4.0–30.0) days, respectively.
Serum and CSF NfL
Median NfL in serum (35.9 [IQR = 22.1–61.7] pg/ml) was 42‐fold lower than that in CSF (1,521.1 [IQR = 814.1–2,888.1] pg/ml). There was a strong positive association between CSF NfL and sNfL levels, with a 10% increase in CSF leading to a 5.9% higher sNfL (log10[sNfL] = 0.0509 + 0.589 × log10[NfLCSF] p < 0.001; Pearson r = 0.77, 95% CI = 0.69–0.83, p < 0.001; Fig 1A).
Figure 1.
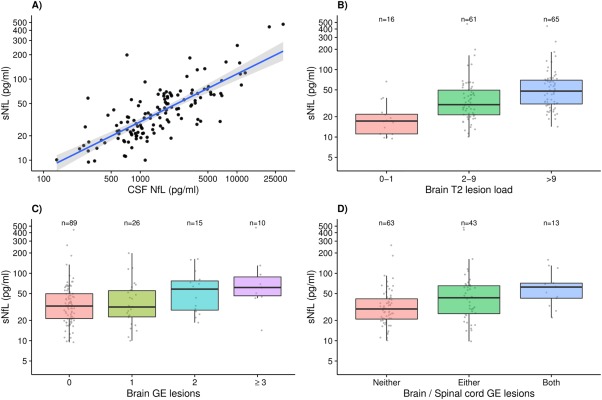
(A) Association between cerebrospinal fluid (CSF) neurofilament light chain (NfL) and serum neurofilament light chain (sNfL) levels in the Lugano cohort. A 10% increase in CSF NfL corresponds to an increase of approximately 5.9% in sNfL (β = 0.589, p < 0.001). Gray band: 95% confidence interval. (B) Association between brain T2 lesion load and sNfL levels in the Lugano cohort (2–9 vs 0–1: β = 1.849, p = 0.001; >9 vs 0–1: β = 2.524, p < 0.001). (C) Association between number of brain gadolinium‐enhancing (GE) lesions and sNfL levels in the Lugano cohort (1 vs 0: β = 1.077, p = 0.630; 2 vs 0: β = 1.551, p = 0.024; ≥3 vs 0: β = 2.138, p = 0.001). (D) Association between brain and spinal cord GE lesions and sNfL levels in the Lugano cohort (either brain or spinal vs neither: β = 1.461, p = 0.005; both brain and spinal vs neither: β = 1.902, p = 0.002).
sNfL in Patients and Controls and Associations with MRI
As in HC samples, sNfL was positively associated with age (β = 1.015, 95% CI = 1.006–1.025, p = 0.002), but not with gender (β = 1.165, 95% CI = 0.911–1.489, p = 0.226). There was no association between sNfL and storage time (β = 1.030, 95% CI = 0.977–1.086, p = 0.274, after age correction). All remaining analyses were corrected by including age as a covariate in the regression models. Patients had higher sNfL levels than HC (β = 1.914, 95% CI = 1.717–2.135, p < 0.001). In addition, sNfL progressively increased with increasing number of T2 and gadolinium‐enhancing (GE) lesions in both brain and spinal cord (Table 2 and Fig 1B, C). Median sNfL levels progressively increased from 29.6 (IQR = 20.9–41.8) pg/ml in patients with GE lesions in neither brain nor spinal cord, to 43.4 (IQR = 25.2–65.3) pg/ml in those with GE lesions in either brain or spinal cord, to 62.5 (IQR = 42.7–71.4) pg/ml in those with GE lesions in both brain and spinal cord (either vs neither: β = 1.461, 95% CI = 1.128–1.892, p = 0.005; both vs neither: β = 1.902, 95% CI = 1.278–2.830, p = 0.002; both vs either: β = 1.302, 95% CI = 0.861–1.969, p = 0.213; see Table 2 and Fig 1D).
Table 2.
sNfL Concentration and Associations with Different Clinical and Magnetic Resonance Imaging Variables in the Lugano Cohort
| Variable | Median (IQR)/No. (%) | sNfL, Median (IQR), pg/ml | β | 95% CI | p |
|---|---|---|---|---|---|
| Age, yr | 37.9 (29.8–47.8) | — | 1.015 | 1.006–1.025 | 0.002 |
| Gender | |||||
| F | 92 (64.8%) | 33.0 (21.5–55.3) | — | — | — |
| M | 50 (35.2%) | 44.2 (25.7–62.4) | 1.165 | 0.911–1.489 | 0.226 |
| Oligoclonal bands | |||||
| Negative | 13 (9.1%) | 26.8 (16.8–49.6) | — | — | — |
| Positive | 129 (90.9%) | 36.2 (22.7–61.9) | 1.114 | 0.740–1.676 | 0.606 |
| Brain T2 lesions | |||||
| 0–1 | 16 (11.3%) | 17.3 (11.1–21.8) | — | — | — |
| 2–9 | 61 (43.0%) | 30.2 (21.4–49.6) | 1.849 | 1.283–2.666 | 0.001 |
| >9 | 65 (45.7%) | 48.0 (30.9–69.7) | 2.524 | 1.744–3.653 | <0.001 |
| Brain GE lesions | |||||
| 0 | 89 (63.6%) | 32.7 (21.3–49.7) | — | — | — |
| 1 | 26 (18.6%) | 31.6 (22.6–55.3) | 1.077 | 0.797–1.456 | 0.630 |
| 2 | 15 (10.7%) | 58.3 (28.4–77.0) | 1.551 | 1.064–2.259 | 0.024 |
| ≥3 | 10 (7.1%) | 61.6 (46.4–89.1) | 2.138 | 1.362–3.355 | 0.001 |
| Spinal T2 lesions | |||||
| 0 | 31 (25.0%) | 26.4 (17.2–42.8) | — | — | — |
| 1 | 26 (21.0%) | 25.4 (18.5–42.5) | 0.819 | 0.574–1.167 | 0.271 |
| ≥2 | 67 (54.0%) | 44.0 (29.6–64.6) | 1.332 | 0.992–1.788 | 0.059 |
| Spinal GE lesions | |||||
| 0 | 95 (78.5%) | 32.4 (21.5–53.5) | — | — | — |
| 1 | 26 (21.5%) | 49.2 (30.9–66.0) | 1.467 | 1.091–1.974 | 0.013 |
| Brain/spinal GE lesions | |||||
| Neither | 63 (52.9%) | 29.6 (20.9–41.8) | — | — | — |
| Either | 43 (36.1%) | 43.4 (25.2–65.3) | 1.461 | 1.128–1.892 | 0.005 |
| Both | 13 (10.9%) | 62.5 (42.7–71.4) | 1.902 | 1.278–2.830 | 0.002 |
Age was included as additional variable in all models.
CI = confidence interval; F = female; GE = gadolinium‐enhancing; IQR = interquartile range; M = male; sNfL = serum neurofilament light chain.
sNfL Levels in the SMSC
Demographic, Clinical Variables, and Treatment Switches
Three and 2 serum samples were available for 227 and 19 patients, respectively (ie, total number of samples = 719). Most patients started or switched to a new DMT shortly after baseline sample (“starters”; n = 212, 86.2%), whereas 34 (13.8%) were patients with progressive MS who were either untreated or on continuous DMT (“nonstarters”). The median time between baseline sampling and DMT initiation in the starters group was 41 (IQR = 5.0–93.8) days. Demographic and clinical characteristics are shown in Table 3.
Table 3.
Descriptive Statistics of Demographic and Clinical Variables of the SMSC Patients at Baseline
| Variables | SMSC, n = 246 | SMSC Starters, n = 212 | SMSC Nonstarters, n = 34 |
|---|---|---|---|
| Age, yr | 42.2 (33.6–51.4) | 40.6 (32.8–48.8) | 54.5 (49.2–60.9) |
| Gender | |||
| F | 162 (65.9%) | 151 (71.2%) | 11 (32.4%) |
| M | 84 (34.1%) | 61 (28.8%) | 23 (67.6%) |
| Diagnosis at baseline | |||
| CIS | 14 (5.7%) | 14 (6.6%) | 0 (0.0%) |
| RRMS | 185 (75.2%) | 185 (87.3%) | 0 (0.0%) |
| SPMS | 27 (11.0%) | 11 (5.2%) | 16 (47.1%) |
| PPMS | 20 (8.1%) | 2 (0.9%) | 18 (52.9%) |
| Disease duration, yr | 7.4 (1.8–15.3) | 6.6 (1.6–14.3) | 15.3 (7.9–23.7) |
| EDSS | 3.0 (1.5–4.0) | 2.5 (1.5–3.5) | 4.8 (3.6–6.0) |
| DMT at baseline | |||
| Injectable DMTs | 77 (31.3%) | 73 (34.4%) | 4 (11.8%) |
| Natalizumab | 22 (8.9%) | 22 (10.4%) | 0 (0.0%) |
| Fingolimod | 9 (3.7%) | 9 (4.2%) | 0 (0.0%) |
| Azathioprine | 4 (1.6%) | 4 (1.9%) | 0 (0.0%) |
| Mitoxantrone | 6 (2.4%) | 3 (1.4%) | 3 (8.8%) |
| Dimethyl fumarate | 2 (0.8%) | 2 (0.9%) | 0 (0.0%) |
| Rituximab | 1 (0.4%) | 1 (0.5%) | 0 (0.0%) |
| Other | 4 (1.6%) | 0 (0.0%) | 4 (11.8%) |
| Untreated | 121 (49.2%) | 98 (46.2%) | 23 (67.6%) |
| Switch after baseline to | |||
| Fingolimod | — | 136 (64.2%) | — |
| Injectable DMTs | — | 39 (18.4%) | — |
| Natalizumab | — | 21 (9.9%) | — |
| Rituximab | — | 16 (7.5%) | — |
| Baseline to first follow‐up, days | 224.0 (188.0–368.0) | 217.0 (183.5–365.0) | 363.5 (335.2–377.2) |
| Baseline to second follow‐up, days | 540.0 (386.0–725.5) | 511.0 (383.5–700.8) | 731.0 (664.5–753.0) |
| Baseline to new DMT start, days | — | 41.0 (5.0–93.8) | — |
Values are median (interquartile range) or count (percentage). SMSC Starters = patients starting or switching to a new DMT after baseline sampling. SMSC Nonstarters = progressive multiple sclerosis patients who were either untreated or had not changed DMT.
CIS = clinically isolated syndrome; DMT = disease‐modifying treatment; EDSS = Expanded Disability Status Scale; F = female; M = male; PPMS = primary progressive multiple sclerosis; RRMS = relapsing–remitting multiple sclerosis; SMSC = Swiss Multiple Sclerosis Cohort Study; SPMS = secondary progressive multiple sclerosis.
Associations between sNfL and Demographic and Clinical Variables
The median sNfL level in the SMSC cohort was 29.4 (IQR = 20.1–45.2) pg/ml. Several variables were tested for association with sNfL in all patients (n = 246; Table 4). As in the HC and Lugano cohorts, sNfL levels were positively associated with age (β = 1.018, 95% CI = 1.012–1.024, p < 0.001) and no gender association was detected (see Table 4). Storage time was not significantly associated with sNfL (β = 1.048, 95% CI = 0.999–1.099, p = 0.057 after age correction). Disease duration was also significantly associated with sNfL (β = 1.011, 95% CI = 1.003–1.018, p = 0.004). However, this association disappeared when correcting for age (β = 1.001, 95% CI = 0.993–1.010, p = 0.755), whereas the age association was unchanged (β = 1.016, 95% CI = 1.008–1.023, p < 0.001). This implies disease duration as a proxy for age, and only the latter was therefore considered in following analyses. The age association was present and of similar strength in both CIS/RRMS and PPMS/SPMS patients (β = 1.015, 95% CI = 1.007–1.023, p < 0.001 and β = 1.015, 95% CI = 1.003–1.028, p = 0.016; Fig 2A). Both groups had higher sNfL than HC, even after correcting for age (CIS/RRMS: 27.2 [IQR = 19.2–57.2] pg/ml, β = 1.418, 95% CI = 1.288–1.560, p < 0.001; PPMS/SPMS: 41.4 [IQR = 32.1–57.2] pg/ml, β = 1.620, 95% CI = 1.417–1.851, p < 0.001; see Fig 2B). sNfL concentrations were higher in PPMS/SPMS as compared to CIS/RRMS (β = 1.450, 95% CI = 1.245–1.688, p < 0.001; after correcting for age: β = 1.205, 95% CI = 1.106–1.418, p = 0.029). Positive associations were also found in univariate analyses between sNfL and EDSS (β = 1.141, 95% CI = 1.106–1.178, p < 0.001; see Fig 2C), presence of a relapse within 60 days before sampling (β = 1.563, 95% CI = 1.303–1.874, p < 0.001), and recent EDSS worsening (β = 1.294, 95% CI = 1.090–1.536, p = 0.003). Noteworthy, sNfL levels were lower in DMT‐treated versus untreated patients (β = 0.717, 95% CI = 0.634–0.810, p < 0.001).
Table 4.
Univariate and Multivariate Models Testing Associations between Age, Gender, EDSS, Disease Course, Recent Relapses, Recent EDSS Worsening, and DMT Status and sNfL in the SMSC Cohort
| Univariate | Multivariate | ||||||
|---|---|---|---|---|---|---|---|
| Variable (sample No.) | sNfL, pg/ml [IQR] | β | 95% CI | p | β | 95% CI | p |
| Age (719) | — | 1.018 | 1.012–1.024 | <0.001 | 1.012 | 1.005–1.019 | <0.001 |
| Gender | |||||||
| F (474) | 29.1 [20.1–44.3] | — | — | — | — | — | — |
| M (245) | 30.9 [20.2–48.0] | 1.054 | 0.902–1.232 | 0.505 | 0.991 | 0.858–1.145 | 0.905 |
| EDSS (719) | — | 1.141 | 1.106–1.178 | <0.001 | 1.105 | 1.063–1.149 | <0.001 |
| Disease course | |||||||
| CIS/RRMS (581) | 27.2 [19.2–57.2] | — | — | — | — | — | — |
| PPMS/SPMS (138) | 41.4 [32.1–57.2] | 1.450 | 1.245–1.688 | <0.001 | 0.924 | 0.742–1.151 | 0.483 |
| Recent relapse, <60 days | |||||||
| No (643) | 28.9 [20.0–43.8] | — | — | — | — | — | — |
| Yes (76) | 39.3 [25.9–60.2] | 1.563 | 1.303–1.874 | <0.001 | 1.430 | 1.156–1.768 | <0.001 |
| Recent EDSS worsening | |||||||
| No (615) | 29.0 [20.1–43.9] | — | — | — | — | — | — |
| Yes (51) | 38.5 [27.8–64.0] | 1.294 | 1.090–1.536 | 0.003 | 1.119 | 0.962–1.303 | 0.146 |
| DMT | |||||||
| Untreated (162) | 38.0 [23.8–56.7] | — | — | — | — | — | — |
| DMT treated (557) | 27.0 [20.1–45.2] | 0.717 | 0.634–0.810 | <0.001 | 0.818 | 0.716–0.934 | 0.003 |
The number of samples for each variable is indicated within parentheses (eg, number of samples collected in patients under treatment at time of sampling = 557, number of samples collected in patients untreated at time of sampling = 162). Information on age, gender, EDSS, disease course, recent relapses, and DMT treatment was available for 719 (100%) sampling time points. No data were available for preceding EDSS scores at 53 (7.4%) sampling time points.
CI = confidence interval; CIS = clinically isolated syndrome; DMT = disease‐modifying treatment; EDSS = Expanded Disability Status Scale; F = female; M = male; PPMS = primary progressive multiple sclerosis; RRMS = relapsing–remitting multiple sclerosis; SMSC = Swiss Multiple Sclerosis Cohort Study; sNfL = serum neurofilament light chain; SPMS = secondary progressive multiple sclerosis.
Figure 2.
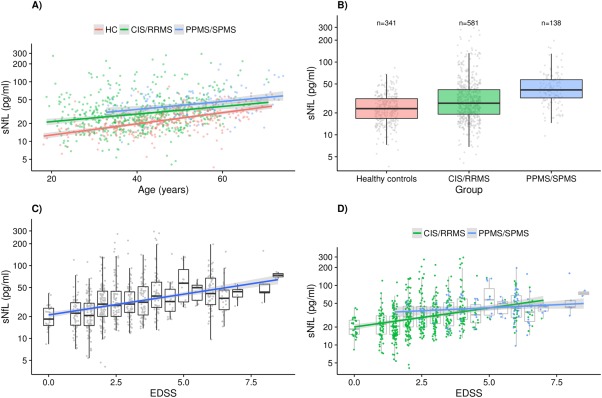
(A) Association between age and serum neurofilament light chain (sNfL) levels in healthy controls (HC), clinically isolated syndrome (CIS)/relapsing–remitting multiple sclerosis (RRMS) patients, and primary progressive multiple sclerosis (PPMS)/secondary progressive multiple sclerosis (SPMS) patients from the Swiss Multiple Sclerosis Cohort Study (SMSC) cohort. An increase of 1 year in age corresponds to an increase of approximately 2.2%, 1.5%, and 1.5% in sNfL in the 3 groups, respectively. Gray band: 95% confidence interval (CI). (B) sNfL in HC versus CIS/RRMS and SPMS/PPMS from the SMSC cohort. (C) Association between Expanded Disability Status Scale (EDSS) and sNfL levels in the SMSC cohort. A 1‐point EDSS increase corresponds to an sNfL increase of approximately 14.1%. Gray band: 95% CI. (D) Significant interaction between EDSS and disease course (CIS/RRMS vs PPMS/SPMS) in the association with sNfL in the SMSC cohort (interaction β = 0.904, interaction p = 0.021). Gray shading: 95% CI.
All following variables were then included in the same multivariate model: age, gender (female vs male), EDSS, disease course (CIS/RRMS vs PPMS/SPMS), presence of relapses within 60 days before sampling (yes vs no), recent EDSS worsening (yes vs no), and DMT treatment status (treated vs untreated). sNfL levels remained significantly associated with age, EDSS, presence of relapses within 60 days before sampling, and DMT treatment status (see Table 4). Disease course (CIS/RRMS vs PPMS/SPMS) did not survive as an independent factor. We tested potential interactions between variables of interest, and observed that the increase in sNfL per EDSS unit increase was lower in PPMS/SPMS than in CIS/RRMS patients (β = 1.024, 95% CI = 0.952–1.101 vs β = 1.133, 95% CI = 1.081–1.187, respectively; interaction p = 0.021; see Fig 2D, Supplementary Table 1).
Associations between sNfL and Time under New Treatment
Baseline sNfL levels were higher in patients starting natalizumab (50.8 [IQR = 20.8–77.0] pg/ml) and rituximab (51.0 [IQR = 29.1–71.4] pg/ml) than those initiating fingolimod (29.8 [IQR = 20.7–46.4] pg/ml) and injectable DMTs (28.1 [IQR = 18.0–43.2] pg/ml). sNfL levels at baseline were higher in all patient groups as compared to HC (p < 0.001 for all; Fig 3). We explored the association between time under treatment and sNfL during FU while correcting for baseline sNfL and other covariates. After adjustment, time since start of new treatment in years was negatively associated with FU sNfL (β = 0.900, 95% CI = 0.830–0.976, p = 0.011; see Fig 3, Supplementary Table 2). The decrease in sNfL with time since start of new treatment appeared similar across different DMTs, but numbers were too low to investigate differences further.
Figure 3.
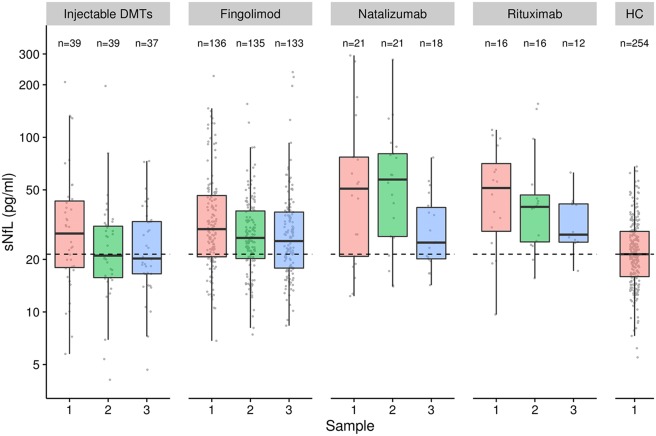
Baseline serum neurofilament light chain (sNfL) was higher in patients starting natalizumab (50.8pg/ml) and rituximab (51.0pg/ml) than in those initiating fingolimod (29.8pg/ml) and injectable disease‐modifying treatments (DMTs; 28.1pg/ml). sNfL levels decreased in patients starting injectable DMTs, fingolimod, natalizumab, or rituximab over time. HC = healthy controls.
sNfL and Previous and Future Disease Activity
Finally, we investigated whether high sNfL levels were associated with past and future clinical disease activity (relapses and EDSS worsening). To this purpose, we compared sNfL measurements from the SMSC against the age‐corrected percentile curves that were constructed based on HC samples. To have a more homogeneous population, this analysis was only performed in CIS/RRMS patients. Of a total of 581 samples, 287 (49.4%) samples had sNfL values above the 80th percentile, 228 (39.2%) above the 90th percentile, 171 (29.4%) above the 95th percentile, 135 (23.2%) above the 97.5th percentile, and 105 (18.1%) above the 99th percentile. The median FU time after sample collection was 3.1 (IQR = 2.0–4.0) years.
Previous Clinical Disease Activity (Relapses, ARR, and EDSS Worsening)
The probability of having experienced a relapse within 60 days before sampling was increased for sNfL measurements above versus below the 80th, 90th, 95th, 97.5th, and 99th percentiles (Fig 4A, Supplementary Table 3). Patients with sNfL above the 97.5th percentile had approximately 4.0‐fold odds of having experienced a relapse in the previous 60 days (OR = 3.89, 95% CI = 2.30–6.58, p < 0.001). The mean ARR during 1 and 2 years before sample collection was higher in patients with sNfL levels above these percentiles (see Fig 4A, Supplementary Table 3). The incidence of relapses 1 and 2 years before sample collection was approximately 1.5 to 2.0 times higher with sNfL levels above the 97.5th percentile (IRR = 2.08, 95% CI = 1.64–2.63, p < 0.001 and IRR = 1.39, 95% CI = 1.18–1.64, p < 0.001, respectively).
Figure 4.
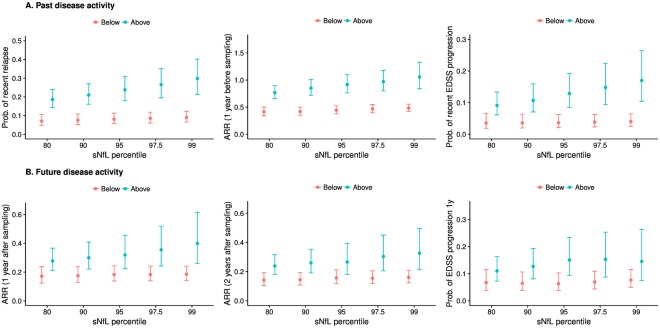
Model‐predicted means (marginal means) and model estimates including 95% confidence intervals from generalized estimating equation models. (A) Probability of a recent relapse (within 60 days before sampling), annualized relapse rate (ARR) in the 1 year before sampling, and probability of Expanded Disability Status Scale (EDSS) worsening since 6 to 12 months before sampling according to serum neurofilament light chain (sNfL) percentiles. (B) ARR in the 1 year after sampling, ARR in the 2 years after sampling, and probability of EDSS worsening within 1 year after sampling according to sNfL percentiles. There were 287 samples (49.4%) with sNfL values above the 80th percentile, 228 samples (39.2%) above the 90% percentile, 171 samples (29.4%) above the 95th percentile, 135 samples (23.2%) above the 97.5th percentile, and 105 (18.1%) above the 99th percentile.
The probability of having experienced worsening of the EDSS within 6 to 12 months before sampling was higher in patients with sNfL values above versus below the 90th, 95th, 97.5th, and 99th percentiles (see Fig 4A, Supplementary Table 3). Patients with sNfL above the 97.5th percentile had >4.0‐fold odds of having experienced EDSS worsening in the previous 6 to 12 months (OR = 4.36, 95% CI = 2.09–9.09, p < 0.001). Notably, there was a strikingly progressive probability of having experienced past relapses or EDSS worsening with increasing percentile categories.
Future Clinical Disease Activity (ARR and EDSS Worsening)
The mean ARR was increased during 1 and 2 years after the collection of samples with sNfL levels above the 80th, 90th, 95th, 97.5th, and 99th percentiles (see Fig 4B, Supplementary Table 4). The incidence of relapses was approximately 2.0 times higher both 1 and 2 years after the collection of samples with sNfL levels above the 97.5th percentile (IRR = 1.94, 95% CI = 1.21–3.10, p = 0.006 and IRR = 1.96, 95% CI = 1.22–3.15, p = 0.005). The proportion of patients experiencing EDSS worsening within 12 months after sampling gradually increased with increasing sNfL percentile category (from 6.7% for samples <80th percentile to approximately 15% for samples >97.5th percentile; OR = 2.41, 95% CI = 1.07–5.42, p = 0.034; see Fig 4B, Supplementary Table 4).
Discussion
Several candidate biomarkers have been proposed in MS,2 but their clinical relevance remains uncertain and none is currently accepted as a sensitive and reliable measure to monitor disease course in clinical practice. In 2 independent cohorts of patients, we provide evidence that measurement of sNfL has several features necessary to qualify as an urgently needed laboratory marker of neuronal damage in MS. sNfL levels are not only significantly higher in MS patients versus controls, they correlate with focal lesion presence and activity in both the brain and the spinal cord, as depicted by MRI but also with relevant static and dynamic clinical outcomes, that is, previous, concurrent, and future relapses and disability worsening.
Our results confirm and expand on previous studies20, 21 showing that NfL can be reliably measured in serum using the Simoa technology, even at very low concentrations (down to a few pg/ml). The observed increase of NfL levels in serum with age seen in both HC and patient cohorts mirrors the age association described for CSF NfL levels,38 and it is best explained by ongoing age‐related neuronal degeneration. We did not observe a difference in sNfL between genders. The tight positive association between CSF and sNfL levels highlights that serum levels closely reflect NfL release within the central nervous system, as already indicated by previous studies.19, 39, 40
Both patient cohorts included in this study had higher sNfL concentration than healthy individuals. This confirms what has been observed in CSF NfL studies4, 7, 10, 11, 12, 41, 42, 43, 44 and the results of a single previous investigation of CIS patients in which sNfL levels were measured using a less sensitive ECL assay.18 sNfL levels were also slightly higher in the Lugano than in the SMSC samples, likely because the former were collected as part of the diagnostic workup, which is frequently performed shortly after relapses. The close association of increased blood NfL levels with neuronal damage has been suggested in other neurological conditions, including ALS, neurodegenerative disorders, and acute brain and spinal cord injury.8, 22, 23, 24, 39, 40 In conjunction with findings in other neurological diseases, our results in MS strongly suggest that increased sNfL levels reflect ongoing neuronal damage irrespective of the underlying pathogenic mechanism.
The relation between neuronal damage and NfL concentration is also supported by the clear positive association between sNfL and focal inflammatory MRI lesions in both brain and spinal cord. We found gradually increased sNfL levels in patients with higher brain T2 and GE lesion counts. A similar significant association was found between sNfL and presence of spinal GE lesions and was most pronounced when GE lesions were present in both brain and spinal cord. Several studies have shown associations between CSF NfL and brain T2 and GE lesions.7, 12, 45 We have also previously shown weak associations between sNfL (as measured by the ECL assay) and brain T2 and GE lesions in CIS patients18 and in a small cohort of RRMS patients (n = 29).19 Our current results confirm and expand these findings in a larger cohort of patients and suggest that spinal cord damage also contributes to increased NfL concentrations in serum. This appears to be relevant, because spinal cord pathology is a key factor in the development of disability in MS.27, 46
We made use of the longitudinal SMSC cohort with repeated measurements to simultaneously analyze the association between several clinical variables and sNfL. In addition to age, both presence of a recent relapse and disability as measured by the EDSS were positively and independently associated with sNfL. This suggests sNfL levels may be related to both acute inflammatory damage and chronic diffuse neuronal loss leading to disability progression in its proper sense. Interestingly, the EDSS association was more evident in CIS/RRMS than in PPMS/SPMS patients, perhaps resembling the slower and gradual disability accumulation characterizing progressive MS. It may also be an indication that disease progression in this later stage of disease reflects both direct tissue damage and reduced/exhausted compensation capacity.
Of particular interest in the search for biomarkers reflecting therapeutic effects is that sNfL levels were significantly lower in DMT‐treated as compared to untreated patients, independently of all other variables. In CIS/RRMS patients, the decrease in sNfL levels correlated inversely with longer time since start of DMTs independent of recent relapses. Notably, treatment effects on CSF NfL levels have already been shown for fingolimod, natalizumab, and rituximab in MS patients.13, 14, 15, 16, 17, 47 Although this study was not primarily designed to investigate treatment effects, our results suggest that DMTs reduce sNfL levels, supporting their value for monitoring treatment response.
Patients with sNfL levels above different HC‐based percentiles had considerably higher risk of having experienced a recent relapse or EDSS worsening. sNfL measurements could therefore be used to indicate recent neuronal damage, and this could be particularly useful in case of “clinically silent disease” or when clinical changes are difficult to interpret. Moreover, high sNfL levels were also associated with a higher risk of future clinical relapses and EDSS worsening. This confirms findings from 2 relatively small studies suggesting that patients with higher CSF neurofilament levels have a worse long‐term disease outcome.48, 49 Taken together, these results support the potential use of sNfL as a prognostic marker of clinical disease course.
Our study has some limitations. Only a single standardized high‐resolution MRI scan was available as part of the clinical diagnostic workup of the Lugano cohort, and no lesion volume measurements were available in addition to the T2 lesion counts to test for association with sNfL. Second, the FU in the SMSC cohort was relatively short and did not allow an estimate of sNfL association with long‐term disease worsening or progression. The observational study design does not allow separation of potential treatment effects from regression to the mean phenomena in this relatively active cohort of patients. The percentile curves are currently based on a limited number of HC samples (n = 254), and we did not include information on comorbidities and vascular risk factors. This will need to be assessed in the future, as we move to application of this measure in individual patients. Finally, samples were stored in different facilities and for different storage periods, but collection procedures were standardized,25 and we did not observe an association between storage time and sNfL in either patient or control cohorts.
Based on the investigation of HC and 2 large independent samples of MS patients with the recently developed ultrasensitive sNfL assay, this study provides a number of important findings that further our understanding and support the value of sNfL levels as a biomarker of tissue damage in MS: (1) sNfL levels can be reliably and reproducibly measured in serum samples from MS patients; (2) in independent HC and patient cohorts, sNfL levels are positively associated with age but not gender; (3) sNfL levels closely reflect NfL concentration in the CSF of MS patients; (4) sNfL levels are increased in MS patients as compared to HC and positively associated with T2 and GE lesions in both brain and spinal cord; (5) sNfL levels are increased in patients with recent relapses or worsening of disability, are higher with increasing EDSS scores, and decrease with increasing duration of DMT; and (6) sNfL levels are associated with an increased risk of future relapses and EDSS worsening. These findings indicate that sNfL may have a role in assessing disease severity and worsening, as well as in monitoring the effect of DMT. Before sNfL is implemented in clinical practice, more data and research will be needed to establish reference ranges in the general population and sensitivity and specificity of NfL‐based predictions, by using larger cohorts of controls, and taking into account relevant comorbidities and treatment effects. Assay protocols will need to be standardized and validity of the assay will need to be tested across different centers.50 Ongoing investigations of samples obtained in the setting of prospective controlled clinical trials will help to further elucidate the utility of sNfL measurements in monitoring treatment effects.51
Author Contributions
Significant contribution to: conception and design of the study (G.D., C.B., Y.N., C.Z., C.G., J.K.), acquisition and analysis of data (G.D., C.B., P.B., S.S., K.B., H.Z., A.G., J.K.), participation in drafting a significant portion of the manuscript or figures (G.D., D.L., L.K., C.G., J.K.). All authors approved the final version of the manuscript. G.D., C.B., P.B., C.G., and J.K. contributed equally to the article. G.D., P.B., C.Z., L.K., C.G., and J.K. are members of the SMSC Group.
The Swiss MS Cohort Study (SMSC) Group: Jens Kuhle, MD, PhD; Johannes Lorscheider, MD; Özgür Yaldizli, MD; Tobias Derfuss, MD and Ludwig Kappos, MD (Neurologic Clinic and Policlinic, Departments of Medicine, Biomedicine and Clinical Research, University Hospital Basel, University of Basel, Basel, Switzerland). Giulio Disanto, MD, PhD; Chiara Zecca, MD and Claudio Gobbi, MD (Neurocentre of Southern Switzerland, Ospedale Civico, Lugano, Switzerland). Pascal Benkert, PhD (Clinical Trial Unit, University Hospital Basel, University of Basel, Basel, Switzerland). Lutz Achtnichts, MD and Krassen Nedeltchev, MD (Department of Neurology, Cantonal Hospital Aarau, Switzerland). Christian P Kamm, MD; Anke Salmen, MD and Andrew Chan, MD (Department of Neurology, Inselspital, Bern University Hospital and University of Bern, Bern, Switzerland). Patrice H Lalive, MD and Caroline Pot, MD (Department of Clinical Neurosciences, Geneva University Hospital and Faculty of Medicine, Geneva, Switzerland). Myriam Schluep, MD; Cristina Granziera, MD and Renaud Du Pasquier, MD (Department of Neurology, University Hospital of Lausanne (CHUV), Lausanne, Switzerland); Stefanie Müller, MD and Jochen Vehoff, MD (Department of Neurology, Cantonal Hospital St. Gallen, St. Gallen, Switzerland).
Potential Conflicts of Interest
Nothing to report.
Supporting information
Additional supporting information can be found in the online version of this article.
Supporting Information
Acknowledgment
This study received funding from the University of Basel, the Swiss Multiple Sclerosis Society, the Swiss National Research Foundation (320030_160221) and the Research Advisory Board of Ente Ospedaliero Cantonale. The SMSC is funded by the Swiss Multiple Sclerosis Society and by unrestricted grants from Biogen, Genzyme, Merck, Novartis, Roche, and Teva.
We thank Dr F. Keller for providing technical and material support to storage of serum and CSF samples.
Members of the Swiss Multiple Sclerosis Cohort Study Group are available in the Authors contribution section at the end of the article.
References
- 1. Friese MA, Schattling B, Fugger L. Mechanisms of neurodegeneration and axonal dysfunction in multiple sclerosis. Nat Rev Neurol 2014;10:225–238. [DOI] [PubMed] [Google Scholar]
- 2. Comabella M, Montalban X. Body fluid biomarkers in multiple sclerosis. Lancet Neurol 2014;13:113–126. [DOI] [PubMed] [Google Scholar]
- 3. Teunissen CE, Khalil M. Neurofilaments as biomarkers in multiple sclerosis. Mult Scler 2012;18:552–556. [DOI] [PubMed] [Google Scholar]
- 4. Malmestrom C, Haghighi S, Rosengren L, et al. Neurofilament light protein and glial fibrillary acidic protein as biological markers in MS. Neurology 2003;61:1720–1725. [DOI] [PubMed] [Google Scholar]
- 5. Norgren N, Rosengren L, Stigbrand T. Elevated neurofilament levels in neurological diseases. Brain Res 2003;987:25–31. [DOI] [PubMed] [Google Scholar]
- 6. Trentini A, Comabella M, Tintore M, et al. N‐acetylaspartate and neurofilaments as biomarkers of axonal damage in patients with progressive forms of multiple sclerosis. J Neurol 2014;261:2338–2343. [DOI] [PubMed] [Google Scholar]
- 7. Villar LM, Picon C, Costa‐Frossard L, et al. Cerebrospinal fluid immunological biomarkers associated with axonal damage in multiple sclerosis. Eur J Neurol 2014;22:1169–1175. [DOI] [PubMed] [Google Scholar]
- 8. Kuhle J, Gaiottino J, Leppert D, et al. Serum neurofilament light chain is a biomarker of human spinal cord injury severity and outcome. J Neurol Neurosurg Psychiatry 2014;86:273–279. [DOI] [PubMed] [Google Scholar]
- 9. Lu CH, Macdonald‐Wallis C, Gray E, et al. Neurofilament light chain: a prognostic biomarker in amyotrophic lateral sclerosis. Neurology 2015;84:2247–2257. [DOI] [PMC free article] [PubMed] [Google Scholar]
- 10. Kuhle J, Plattner K, Bestwick JP, et al. A comparative study of CSF neurofilament light and heavy chain protein in MS. Mult Scler 2013;19:1597–1603. [DOI] [PubMed] [Google Scholar]
- 11. Lycke JN, Karlsson JE, Andersen O, et al. Neurofilament protein in cerebrospinal fluid: a potential marker of activity in multiple sclerosis. J Neurol Neurosurg Psychiatry 1998;64:402–404. [DOI] [PMC free article] [PubMed] [Google Scholar]
- 12. Teunissen CE, Iacobaeus E, Khademi M, et al. Combination of CSF N‐acetylaspartate and neurofilaments in multiple sclerosis. Neurology 2009;72:1322–1329. [DOI] [PubMed] [Google Scholar]
- 13. Gunnarsson M, Malmestrom C, Axelsson M, et al. Axonal damage in relapsing multiple sclerosis is markedly reduced by natalizumab. Ann Neurol 2011;69:83–89. [DOI] [PubMed] [Google Scholar]
- 14. Kuhle J, Disanto G, Lorscheider J, et al. Fingolimod and CSF neurofilament light chain levels in relapsing‐remitting multiple sclerosis. Neurology 2015;84:1639–1643. [DOI] [PMC free article] [PubMed] [Google Scholar]
- 15. Novakova L, Axelsson M, Khademi M, et al. Cerebrospinal fluid biomarkers as a measure of disease activity and treatment efficacy in relapsing‐remitting multiple sclerosis. J Neurochem 2017;141:296–304. [DOI] [PubMed] [Google Scholar]
- 16. Novakova L, Axelsson M, Khademi M, et al. Cerebrospinal fluid biomarkers of inflammation and degeneration as measures of fingolimod efficacy in multiple sclerosis. Mult Scler 2017;23:62–71. [DOI] [PubMed] [Google Scholar]
- 17. de Flon FP, Gunnarsson M, Laurell K, et al. Reduced inflammation in relapsing‐remitting multiple sclerosis after therapy switch to rituximab. Neurology 2016;87:141–147. [DOI] [PubMed] [Google Scholar]
- 18. Disanto G, Adiutori R, Dobson R, et al. Serum neurofilament light chain levels are increased in patients with a clinically isolated syndrome. J Neurol Neurosurg Psychiatry 2015;87:126–129. [DOI] [PubMed] [Google Scholar]
- 19. Kuhle J, Barro C, Disanto G, et al. Serum neurofilament light chain in early relapsing remitting MS is increased and correlates with CSF levels and with MRI measures of disease severity. Mult Scler 2016;22:1550–1559. [DOI] [PubMed] [Google Scholar]
- 20. Kuhle J, Barro C, Andreasson U, et al. Comparison of three analytical platforms for quantification of the neurofilament light chain in blood samples: ELISA, electrochemiluminescence immunoassay and Simoa. Clin Chem Lab Med 2016;54:1655–1661. [DOI] [PubMed] [Google Scholar]
- 21. Gisslen M, Price RW, Andreasson U, et al. Plasma concentration of the neurofilament light protein (NFL) is a biomarker of CNS injury in HIV infection: a cross‐sectional study. EBioMedicine 2016;3:135–140. [DOI] [PMC free article] [PubMed] [Google Scholar]
- 22. Rohrer JD, Woollacott IO, Dick KM, et al. Serum neurofilament light chain protein is a measure of disease intensity in frontotemporal dementia. Neurology 2016;87:1329–1336. [DOI] [PMC free article] [PubMed] [Google Scholar]
- 23. Rojas JC, Karydas A, Bang J, et al. Plasma neurofilament light chain predicts progression in progressive supranuclear palsy. Ann Clin Transl Neurol 2016;3:216–225. [DOI] [PMC free article] [PubMed] [Google Scholar]
- 24. Shahim P, Gren M, Liman V, et al. Serum neurofilament light protein predicts clinical outcome in traumatic brain injury. Sci Rep 2016;6:36791. [DOI] [PMC free article] [PubMed] [Google Scholar]
- 25. Teunissen CE, Petzold A, Bennett JL, et al. A consensus protocol for the standardization of cerebrospinal fluid collection and biobanking. Neurology 2009;73:1914–1922. [DOI] [PMC free article] [PubMed] [Google Scholar]
- 26. Polman CH, Reingold SC, Banwell B, et al. Diagnostic criteria for multiple sclerosis: 2010 revisions to the McDonald criteria. Ann Neurol 2011;69:292–302. [DOI] [PMC free article] [PubMed] [Google Scholar]
- 27. Zecca C, Disanto G, Sormani MP, et al. Relevance of asymptomatic spinal MRI lesions in patients with multiple sclerosis. Mult Scler 2016;22:782–791. [DOI] [PubMed] [Google Scholar]
- 28. Disanto G, Benkert P, Lorscheider J, et al. The Swiss Multiple Sclerosis Cohort‐Study (SMSC): a prospective Swiss wide investigation of key phases in disease evolution and new treatment options. PLoS One 2016;11:e0152347. [DOI] [PMC free article] [PubMed] [Google Scholar]
- 29. Kurtzke JF. Rating neurologic impairment in multiple sclerosis: an expanded disability status scale (EDSS). Neurology 1983;33:1444–1452. [DOI] [PubMed] [Google Scholar]
- 30. Baranzini SE, Wang J, Gibson RA, et al. Genome‐wide association analysis of susceptibility and clinical phenotype in multiple sclerosis. Hum Mol Genet 2009;18:767–778. [DOI] [PMC free article] [PubMed] [Google Scholar]
- 31. Norgren N, Karlsson JE, Rosengren L, et al. Monoclonal antibodies selective for low molecular weight neurofilaments. Hybrid Hybridomics 2002;21:53–59. [DOI] [PubMed] [Google Scholar]
- 32. Valentin MA, Ma S, Zhao A, et al. Validation of immunoassay for protein biomarkers: bioanalytical study plan implementation to support pre‐clinical and clinical studies. J Pharm Biomed Anal 2011;55:869–877. [DOI] [PubMed] [Google Scholar]
- 33. Rigby RA, Stasinopoulos DM. Smooth centile curves for skew and kurtotic data modelled using the Box‐Cox power exponential distribution. Stat Med 2004;23:3053–3076. [DOI] [PubMed] [Google Scholar]
- 34. Pan W. Akaike's information criterion in generalized estimating equations. Biometrics 2001;57:120–125. [DOI] [PubMed] [Google Scholar]
- 35. Cameron AC, Trivedi PK. Regression‐based tests for overdispersion in the Poisson model. J Econom 1990;46:347–364. [Google Scholar]
- 36. Lenth RV. Least‐squares means: The R package lsmeans. J Stat Softw 2016;69:1–33. [Google Scholar]
- 37. R Core Team . R: a language and environment for statistical computing. Vienna, Austria: R Foundation for Statistical Computing, 2016. [Google Scholar]
- 38. Vagberg M, Norgren N, Dring A, et al. Levels and age dependency of neurofilament light and glial fibrillary acidic protein in healthy individuals and their relation to the brain parenchymal fraction. PLoS One 2015;10:e0135886. [DOI] [PMC free article] [PubMed] [Google Scholar]
- 39. Bacioglu M, Maia LF, Preische O, et al. Neurofilament light chain in blood and CSF as marker of disease progression in mouse models and in neurodegenerative diseases. Neuron 2016;91:56–66. [DOI] [PubMed] [Google Scholar]
- 40. Gaiottino J, Norgren N, Dobson R, et al. Increased neurofilament light chain blood levels in neurodegenerative neurological diseases. PLoS One 2013;8:e75091. [DOI] [PMC free article] [PubMed] [Google Scholar]
- 41. Khalil M, Enzinger C, Langkammer C, et al. CSF neurofilament and N‐acetylaspartate related brain changes in clinically isolated syndrome. Mult Scler 2013;19:436–442. [DOI] [PMC free article] [PubMed] [Google Scholar]
- 42. Modvig S, Degn M, Horwitz H, et al. Relationship between cerebrospinal fluid biomarkers for inflammation, demyelination and neurodegeneration in acute optic neuritis. PLoS One 2013;8:e77163. [DOI] [PMC free article] [PubMed] [Google Scholar]
- 43. Norgren N, Sundstrom P, Svenningsson A, et al. Neurofilament and glial fibrillary acidic protein in multiple sclerosis. Neurology 2004;63:1586–1590. [DOI] [PubMed] [Google Scholar]
- 44. Romme CJ, Bornsen L, Khademi M, et al. CSF inflammation and axonal damage are increased and correlate in progressive multiple sclerosis. Mult Scler 2013;19:877–884. [DOI] [PubMed] [Google Scholar]
- 45. Burman J, Zetterberg H, Fransson M, et al. Assessing tissue damage in multiple sclerosis: a biomarker approach. Acta Neurol Scand 2014;130:81–89. [DOI] [PubMed] [Google Scholar]
- 46. Schlaeger R, Papinutto N, Panara V, et al. Spinal cord gray matter atrophy correlates with multiple sclerosis disability. Ann Neurol 2014;76:568–580. [DOI] [PMC free article] [PubMed] [Google Scholar]
- 47. Romme CJ, Ratzer R, Bornsen L, et al. Natalizumab in progressive MS: results of an open‐label, phase 2A, proof‐of‐concept trial. Neurology 2014;82:1499–1507. [DOI] [PubMed] [Google Scholar]
- 48. Petzold A. The prognostic value of CSF neurofilaments in multiple sclerosis at 15‐year follow‐up. J Neurol Neurosurg Psychiatry 2015;86:1388–1390. [DOI] [PubMed] [Google Scholar]
- 49. Salzer J, Svenningsson A, Sundstrom P. Neurofilament light as a prognostic marker in multiple sclerosis. Mult Scler 2010;16:287–292. [DOI] [PubMed] [Google Scholar]
- 50. Teunissen CE, Malekzadeh A, Leurs C, et al. Body fluid biomarkers for multiple sclerosis—the long road to clinical application. Nat Rev Neurol 2015;11:585–596. [DOI] [PubMed] [Google Scholar]
- 51. Kuhle J, Barro C, Brachat A, et al. Blood neurofilament light chain levels are elevated in multiple sclerosis and correlate with disease activity. Paper presented at: 32nd Congress of the European Committee for Treatment and Research in Multiple Sclerosis; September 14–17, 2016; London, United Kingdom.
Associated Data
This section collects any data citations, data availability statements, or supplementary materials included in this article.
Supplementary Materials
Additional supporting information can be found in the online version of this article.
Supporting Information