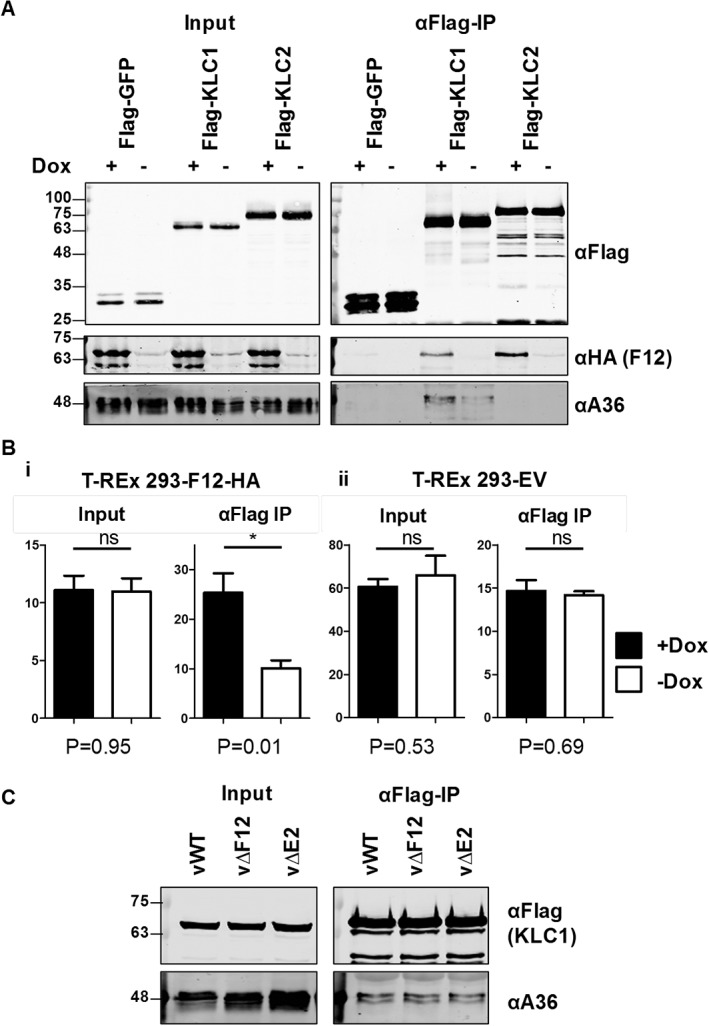
Figure 6.

Overexpression of F12 enhances association of A36 with KLC1. A, Co‐precipitation of A36 and KLC1 in the presence or absence of F12. The T‐REx‐293‐F12‐HA cell line was transfected with FLAG‐GFP, KLC1 or KLC2 and infected 32 h post‐transfection (hpt) with vΔF12 at 5 pfu/cell. At the time of infection cells were either induced by addition of doxycycline (final concentration 0.5 µg/ml), or left not induced as indicated. FLAG‐tagged proteins were immunoprecipitated from clarified cell lysates harvested 14 hpi and analysed by SDS‐PAGE and immunoblotting with the indicated antibodies. Clarified lysates (Input) were analysed in parallel. B, Quantification of A36 immunoblot band intensity. The experiment described in panel (A) was repeated with multiple replicates of each sample and anti‐A36 immunoblot band intensities were quantified by LI‐COR scanner (primary data and integrated intensity measurements are shown in Figure S1). Each graph represents the average of quadruplicate samples transferred to the same blotting membrane. Y‐axis values are in arbitrary units reflecting relative intensities of bands on the same blots. P‐Values calculated by student t test comparing each + Dox with each ‐ Dox sample are given underneath the graphs. Graphs are representative of 3 experiments carried out in the T‐REx 293‐F12‐HA cell line and 2 experiments in the T‐REx 293‐EV control cell line. C, Co‐precipitation of A36 and KLC1 from cells infected with WT VACV (vWT), or viruses lacking expression of either F12 (vΔF12) or E2 (vΔE2). HEK293T cells were transfected with FLAG‐KLC1 and infected with the above viruses 24 hpt at 5 pfu/cell. FLAG‐tagged proteins were immunoprecipitated from clarified cell lysates harvested 14 hpi and analysed by SDS‐PAGE and immunoblotting with the indicated antibodies. Clarified lysates (Input) were analysed in parallel.
