Abstract
Background and Aims:
Outcome prediction of critically ill patients is an integral part of care in an Intensive Care Unit (ICU). Acute Physiology and Chronic Health Evaluation (APACHE) scoring systems provide an objective means of mortality prediction in ICU. The aim of this study was to compare the performance of APACHE II and IV scoring system in our ICU.
Material and Methods:
All patients admitted to the ICU between January and June 2014 and who met the inclusion criteria were evaluated. APACHE II and IV score were calculated during the first 24 h of ICU stay based on the worst values. All patients were followed up till discharge from the hospital or death. Statistical analysis was performed using SPSS version 19.0. Discrimination of the model for mortality was assessed using receiver operating characteristic curve and calibration was assessed using the Hosmer-Lemeshow goodness-of-fit test.
Results:
Of a total 1268, 1003 patients were included in this study. The mean (±standard deviation) admission APACHE II score was 19.4 ± 8.9, and APACHE IV score was 59.1 ± 27.2. The APACHE scores were significantly higher among nonsurvivors than survivors (P < 0.001). The overall crude hospital mortality rate was 17.6%. APACHE IV had better discriminative power area under the ROC curve ([AUC] –0.82) than APACHE II (AUC-0.75). Both APACHE II and APACHE IV had poor calibration.
Conclusions:
APACHE IV showed better discrimination compared to APACHE II in our ICU population. Both APACHE II and APACHE IV had poor calibration. However, APACHE II calibrated better compared to APACHE IV.
Keywords: Acute Physiology and Chronic Health Evaluation, Intensive Care Unit, Intensive Care Unit scoring system, validation
Introduction
Prognostication of critically ill patients, in a systematic way, based on definite objective data is an integral part of the quality of care in Intensive Care Unit (ICU). Traditionally, ICU physicians have been able to differentiate survivors and nonsurvivors based on their clinical experience. The development of severity of illness scoring system has transformed the approach into a more objective and reliable process.[1] In addition to estimating the prognosis, the severity of illness scoring systems also help in resource allocation and compare the performance of ICUs.[2]
The predictive accuracy of the severity of illness scoring systems change over time.[3] The most commonly used scoring system in ICU-Acute Physiology and Chronic Health Evaluation II (APACHE II) was developed three decades back in 1985.[4] The advances in quality of care and emergence of newer treatment modalities over the past three decades have been immense and have significantly decreased the mortality rates in the ICUs making the older scoring systems more and more inaccurate.[3] The newest scoring system from the APACHE foundation the APACHE IV developed in 2006 attempted to improvize on the accuracy of outcome prediction. The accuracy of APACHE IV was attributed to the inclusion of 142 variables in the mortality equation with 115 various disease groups, which also leads to its complexity in the calculation.[3]
The APACHE IV model was found to have excellent discrimination and calibration in the USA population.[3] Parajuli et al.[5] found that discrimination was better for APACHE IV than APACHE II model; however, calibration was better for APACHE II than APACHE IV model in a study of 76 patients from a multidisciplinary ICU from Nepal. The APACHE IV revealed good discrimination but poor calibration in a subcontinent study from Korea by Lee et al.[6] and a study in Dutch ICUs by Brinkman et al.[7] However, no study was found comparing the performance of APACHE II and APACHE IV in Indian population. Direct comparison of both the scoring systems is essential to identify the advantages and reliability of the newer one over the older.
We aimed to compare the performance of APACHE IV with APACHE II in our ICU.
Material and Methods
This was a prospective observational study conducted in our ICU after obtaining institutional ethics committee approval. All adult patients admitted to our multidisciplinary ICU from January 1, 2014 to June 30, 2014 were included in our study. We excluded post-cardiac arrest patients and patients who stayed in the ICU for <24 h.
The APACHE II and APACHE IV scores were calculated in the first 24 h of admission to ICU. The worst values of vitals and laboratory parameters were considered for calculating the scores. The scores were calculated from the online calculator http://www.sfar.org/scores2/apache22.html for APACHE II and http://intensivecarenetwork.com/Calculators/Files/Apache4.html for APACHE IV. Patients were followed up till discharge from the hospital and outcomes of this patient were recorded.
Data capture
The data were captured from all patients who met the inclusion criteria during the study period. If a patient had multiple ICU admissions during the same hospital stay only the data from the first admission was considered for analysis.
Data captured included demographic variables such as age and sex, co-morbid conditions, prior treatment details, lead time of admission to hospital and ICU, worst vital parameters and laboratory values required to calculate the prognostic scores, use of mechanical ventilation, outcome measures captured included ventilator days, ICU length of stay and mortality.
Definitions
To validate each prognostic model, their discrimination and calibration were analyzed.
Discrimination is defined as the ability of the model to separate survivors from nonsurvivors and was assessed using the area under the receiver operating characteristic curve (AUC).[8] It is classified as excellent, very good, good, moderate, or poor according to the AUC values of 0.9-0.99, 0.8-0.89, 0.7-0.79, 0.6-0.69, and <0.6, respectively.[9]
Calibration is defined as the ability of a model to describe the mortality pattern in the data and is assessed using the Hosmer-Lemeshow goodness-of-fit test.[10] When the predicted mortality of the prognostic model differs significantly from the observed pattern, the calibration ability of this model is poor. The Hosmer-Lemeshow goodness-of-fit test evaluates the agreement between the observed and expected numbers of survivors and nonsurvivors across all strata of the severity of illness by calculating C-statistics or the H-statistics.
The standardized mortality ratio (SMR) is the ratio between the observed and predicted number of deaths. An SMR = 1.0 indicates that the number of observed mortality equals that of predicted mortality.
Statistical analysis
Statistical analysis was performed using SPSS version 19.0, IBM Corp. Data were reported as mean ± standard deviation (SD) for continuous variables and percentages for quantitative variables. Student's t-test, Chi-square test or Fisher's exact test were used, depending on whether the variables were continuous or categorical. P < 0.05 were deemed to indicate statistical significance. AUC was used to measure the discrimination for hospital mortality. Calibration was assessed using the Hosmer-Lemeshow goodness-of-fit test; Spearman's rho coefficient was calculated to assess the correlation between the models.
Results
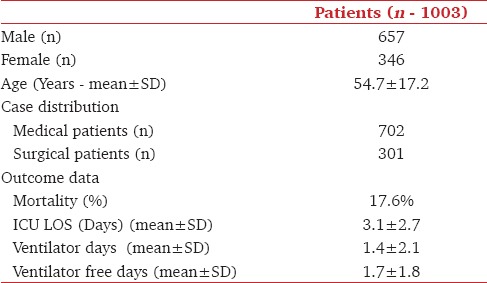
A total of 1268 patients were admitted to our multidisciplinary ICU from January 1, 2014 to June 30, 2014. 206 patients were excluded in view of postcardiac arrest status and hospital stay <24 h. Of the remaining 1062 patients, 59 were excluded since they were readmissions to the ICU during the same hospital stay. A total of 1003 patients were selected for analysis. Of 1003 patients selected for the study, 657 (65.5%) were males and 346 (34.5%) were females [Table 1]. The mean age of our study population was 54 ± 17.2 (mean ± SD) years. Female patients were relatively younger with a mean age of 51.9 years compared to 56.9 years for males. 702 (70%) patients were admitted because of medical problems, and the rest 301 (30%) were admitted for surgical problems. 601 (60%) patients had at least one co-morbid illness. Hypertension (39.2%), diabetes mellitus (38.3%), and chronic kidney disease (20.6%) were the most common co-morbid illness.
Table 1.
Patient characteristics
The mean APACHE II score was 19.4 ± 8.9 (mean ± SD) (range: 0−49) and the mean APACHE IV score was 59.1 ± 27.2 (mean ± SD) (range: 10-179) [Table 2]. Patient distribution according to APACHE II and IV scores is shown in Figures 1 and 2. Male patients were sicker compared to female patients while medical patients were sicker than surgical patients.
Table 2.
Admission severity of illness scores. Survivors Vs Non-survivors

Figure 1.
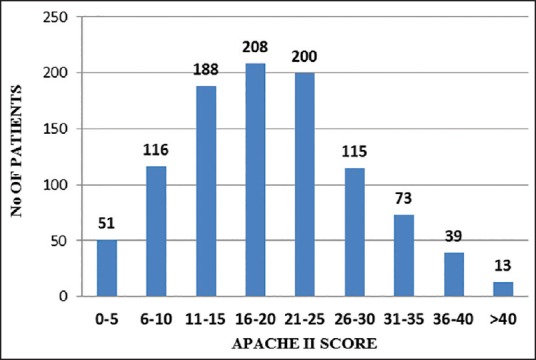
Case distribution as per Acute Physiology and Chronic Health Evaluation II scores
Figure 2.
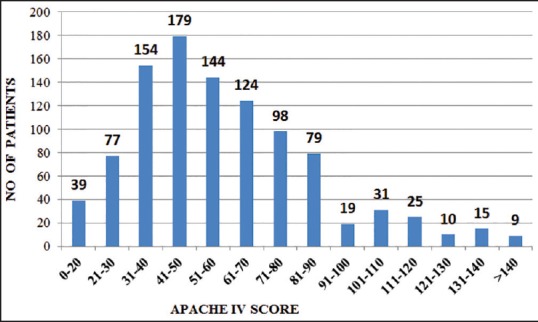
Case distribution according to Acute Physiology and Chronic Health Evaluation IV scores
Out of 1003 patients included in the study, there were 177 deaths. Overall crude hospital mortality rate was 17.6%. The crude hospital mortality rate was significantly (P - 0.014) higher for male patients (19.8%) compared to female patients (13.6%). Crude hospital mortality rate for medical patients (20.8%) were double that of surgical patients (10.3%), which was statistically significant (P < 0.001).
Both APACHE II and IV scores were significantly higher among non-survivors compared to survivors [Table 2]. The APACHE II and IV severity of illness scores showed good correlation with each other with Spearman's rho correlation coefficient of 0.808 (P < 0.001). A higher APACHE II score was associated with a higher APACHE IV score [Figure 3]. Analysis of ROC curve shows that APACHE IV had better (AUC-0.82) discriminative power than APACHE II (AUC-0.75) [Figure 4]. An AUC of 0.82 indicates very good discriminative power for APACHE II while the AUC of 0.75 indicates a good discriminative power for APACHE IV.
Figure 3.
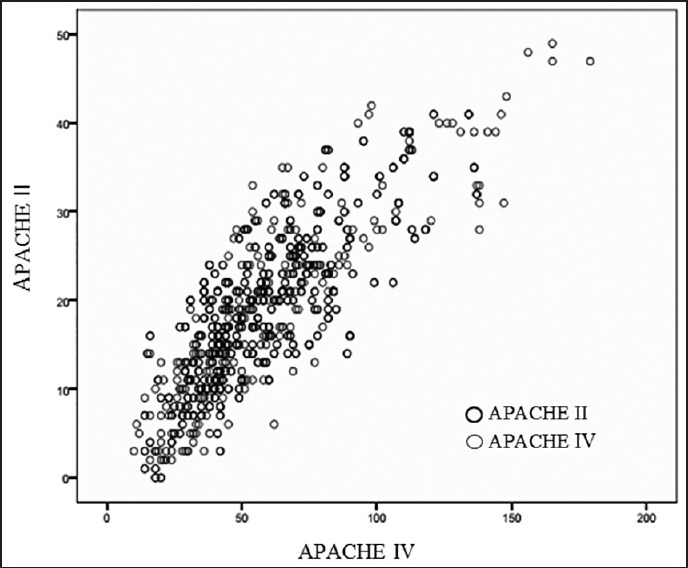
Correlation between Acute Physiology and Chronic Health Evaluation II and Acute Physiology and Chronic Health Evaluation IV scores
Figure 4.
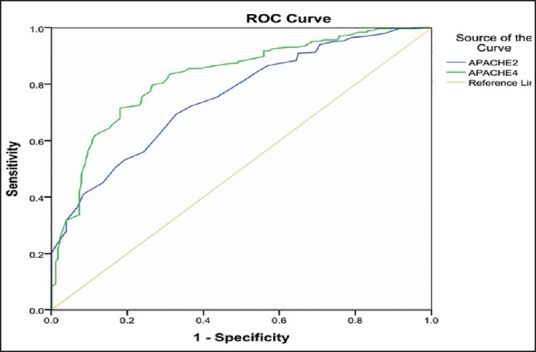
Receiver operating characteristic curves: Acute Physiology and Chronic Health Evaluation II and Acute Physiology and Chronic Health Evaluation IV scores
The predicted mortality rate as per APACHE II was 37% and as per APACHE IV was 19.3%. The SMR was found to be 0.47 as per APACHE II and 0.91 as per APACHE IV. The calibration analysis done by Hosmer-Lemeshow goodness-of-fit test revealed poor calibration for both the models with H-statistics of 151.2 (P-0.031) for APACHE II [Figure 5] and 283.6 (P < 0.001) for APACHE IV [Figure 6]. While APACHE II overestimated mortality at all deciles of risk, APACHE IV tend to underestimate mortality at lower deciles of risk and overestimate mortality at higher deciles of risk.
Figure 5.
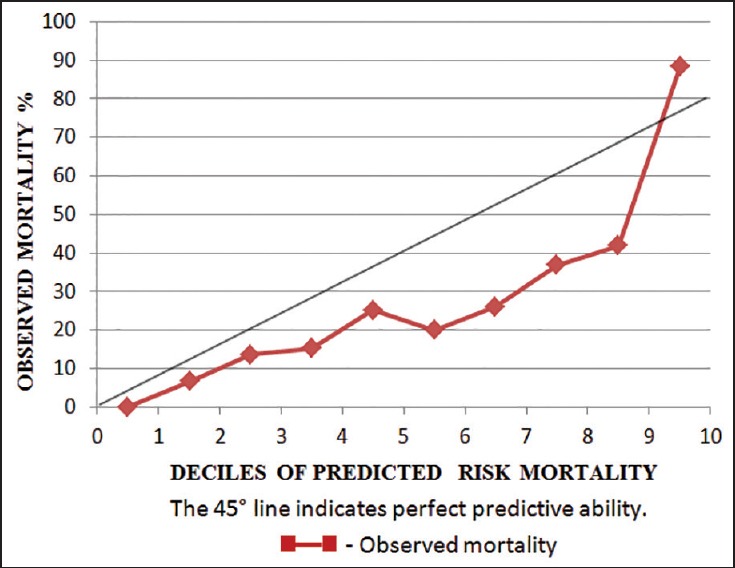
Calibration plot for Acute Physiology and Chronic Health Evaluation II (H-statistics - 151.2, P-0.031)
Figure 6.
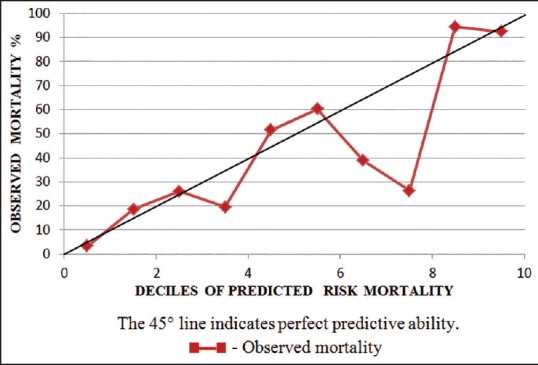
Calibration plot for Acute Physiology and Chronic Health Evaluation IV (H-statistics - 283.6, P-0.001)
Discussion
The mean APACHE II scores in our patients were (19.4 ± 8.9) (mean ± SD) [Table 2]. The non-survivors had a higher APACHE II score compared to survivors (26.4 ± 8.6 vs. 17.9 ± 8.3), which were statistically significant (P < 0.001). APACHE II scores observed in our study was comparable to the values obtained from other studies by Parajuli et al.[5] (mean [± SD] score of 18.26 ± 7.4, 16.39 ± 6.82 and 22.08 ± 7.18, survivors vs. non-survivors) and by Lee et al.[6] (mean (± SD) score of 16.9 ± 6.8 with 16.6 ± 6.6 for survivors and 26.1 ± 6.9 for non-survivors). In a similar study done in 2002 by Arunkumar et al.[11] comparing APACHE II with Simplified Acute Physiology Score II (SAPS II) the mean (± SD) APACHE II score was found to be much lower (12.24 ± 7.18), (11.57 vs. 15.83, survivors vs. non-survivors). The higher APACHE II scores indicate the increasing acuity of illness in the unit over the past decade.[11] Ayazoglu[12] reported higher APACHE II scores in stroke patients (mean ± SD, 21.4 ± 3.1 vs. 28.9 ± 3.7) (survivors vs. non-survivors).
The mean APACHE IV score in our patients were (59.1 ± 27.2) (mean ± SD) [Table 2]. Our study results of APACHE IV scores among survivors and non-survivors (mean ± SD) (53.1 ± 22.5 vs. 87.1 ± 30) was similar to APACHE IV scores reported by Lee et al.[6] (mean ± SD) (49 ± 22.2 vs. 77.1 ± 22.2) (survivors vs. non-survivors). However, Ayazoglu[12] reported a higher APACHE IV scores among survivors and non-survivors (mean ± SD) (79.9 ± 11.6 vs. 105.4 ± 14.9), Our ICU population is mixed medical — surgical, while those of Lee et al. were exclusively surgical and of Ayazoglu were patients with stroke. This difference in case mix explains the difference in scores observed in these units.
Our study observed a very good correlation between APACHE II and APACHE IV scoring systems [Figure 3] with a Spearman's rho correlation coefficient of 0.808 (P < 0.001), which was similar to Parajuli et al.[5] who also reported good correlation between APACHE II and APACHE IV, with Spearman's correlation coefficient of 0.708.
The discrimination of APACHE II as determined by AUC in our study was 0.752 (0.716-0.789: 95% confidence interval [CI]) [Figure 4], which was similar to the AUC observed by Parajuli et al.[5] (AUC-0.73). Discrimination of scoring systems changes when it is applied on different patient populations. This explains the varying AUC observed in previous studies.[6,7,12] Our study population contained the majority of medical patients (70%). Ayazoglu[12] had AUC-0.98 on stroke patients while Lee et al.[6] and Brinkman et al.[7] obtained and AUC of 0.85 and 0.84 on postoperative patients and surgical patients, respectively.
Discrimination of a scoring system also changes over time. An earlier study by Arunkumar et al.[11] comparing APACHE II with SAPS II in the same unit described an AUC of 0.66 for APACHE II. This difference over time is due to the changing pattern and severity of illness at different time points. (APACHE II 2002 vs. 2014, 12.24 ± 7.18 vs. 19.4 ± 8.9, respectively).
The AUC for APACHE IV in our study was found to be 0.826 (0.793-0.859: 95% CI) [Figure 4] indicating a better discriminating ability compared to APACHE II. Similar results were observed by Parajuli et al.[5] and Brinkman et al.[7] However, studies by Lee et al.[6] and Ayazoglu[12] found that APACHE II had a better discriminative power compared to APACHE IV [Table 3] in the original internal validation study for APACHE IV done by Zimmerman et al.[3] in USA population the discrimination was found to be very good with AUC of 0.880.
Table 3.
Comparison of discrimination between APACHE II and APACHE IV in various studies

The analysis of calibration done by Hosmer-Lemeshow goodness-of-fit test revealed poor calibration for both APACHE II and APACHE IV in our study. The poor calibration observed for APACHE II in the current study (H-statistic 151.2, P-0.031) was consistent with the study by Arunkumar et al.[11] (H-statistic 242.62 P < 0.001) done in the same ICU in 2002. However, APACHE II was found to have a better calibration compared to APACHE IV (H-statistic 283.6, P < 0.001) [Figures 5 and 6]. The APACHE II calibrated poorly by overestimating mortality across all deciles of risk while the APACHE IV model calibrated worse by underestimating mortality at lower deciles of risk and overestimating mortality at higher deciles of risk. Like in our study, Lee et al.[6] also observed poor calibration of APACHE II and APACHE IV (APACHE II vs. APACHE IV, H-statistics 621.3 P < 0.001 vs. 252 P < 0.001) in their study population. On the contrary Parajuli et al.[5] observed good calibration with both APACHE II (Chi-square coefficient 7.9. P-0.34) and APACHE IV (Chi-square coefficient 7.9. P-0.05). Zimmerman et al.[3] in the original internal validation study conducted in the USA population and showed excellent calibration (P-0.8) across all deciles of predicted mortality.
The poor calibration of APACHE II compared to APACHE IV in our study is also reflected by the SMR calculated using these scores. The SMR as per APACHE II was 0.47 and as per APACHE IV was 0.91. Both the predictive scoring systems overestimated the overall mortality rate. The SMR as per APACHE II was 0.72 in the earlier study by Arunkumar et al.[11] Similarly, poor calibration observed by Lee et al.[6] was also reflected in the very low SMR of 0.11 with APACHE II and 0.21 with APACHE IV in their study.
Tropical infections such as malaria, dengue, scrub typhus, and leptospirosis, form a significant proportion of our ICU case mix. This is unlike the original USA population on whom these two scoring systems have been validated. Another significant group of patients in our ICU belong to those with chronic kidney disease (20.6%), many of whom present with acute complications such as pulmonary edema and associated hypoxia. These patients would have a very high APACHE II and APACHE IV scores but improve dramatically with hemodialysis. This difference in case mix from the original ICU population used to validate these scores may be one of the reasons for the poor calibration of these scoring systems in our patient population.
Temporal bias is another factor responsible for the poor calibration in external validation studies of scoring systems. The APACHE II scoring system was developed three decades back and the APACHE IV almost a decade back. Medical science and quality of ICU care has improved exponentially in the meantime causing the predictive scoring systems to become less accurate. The differences in sample size between the study population and the original cohort used in the development of the scoring systems can also lead to a difference in the predictive accuracy.
Hence, predictive scoring systems developed in a western population needs customization before they can be applied to Indian population.
Our study is not short of limitations. This was a single center study over as short span of time with relatively fewer numbers of patients compared to the original internal validation study. We did not look into the disease-specific performance of APACHE IV. APACHE IV is expected to perform better when analyzed in disease-specific subgroups.[3] We have also not analyzed the lead time of our patients to ICU admission, which is an important factor that can impact the performance of scoring systems.
In summary, the APACHE II and APACHE IV scoring systems showed reasonably good discriminating ability in our ICU though both calibrated poorly. APACHE II showed better calibration than APACHE IV. Larger multicenter validation studies with customization for the Indian ICU population are needed before they can be applied in our setting.
Financial support and sponsorship
Nil.
Conflicts of interest
There are no conflicts of interest.
References
- 1.Sinuff T, Adhikari NK, Cook DJ, Schünemann HJ, Griffith LE, Rocker G, et al. Mortality predictions in the intensive care unit: Comparing physicians with scoring systems. Crit Care Med. 2006;34:878–85. doi: 10.1097/01.CCM.0000201881.58644.41. [DOI] [PubMed] [Google Scholar]
- 2.Becker RB, Zimmerman JE. ICU scoring systems allow prediction of patient outcomes and comparison of ICU performance. Crit Care Clin. 1996;12:503–14. doi: 10.1016/s0749-0704(05)70258-x. [DOI] [PubMed] [Google Scholar]
- 3.Zimmerman JE, Kramer A, McNair DS, Malila FM. Acute physiology and chronic health evaluation (APACHE) IV: Hospital mortality assessment for today's critically ill patients. Crit Care Med. 2006;34:1297–308. doi: 10.1097/01.CCM.0000215112.84523.F0. [DOI] [PubMed] [Google Scholar]
- 4.Knaus WA, Draper EA, Wagner DP, Zimmerman JE. APACHE II: A severity of disease classification system. Crit Care Med. 1985;13:818–29. [PubMed] [Google Scholar]
- 5.Parajuli BD, Shrestha GS, Pradhan B, Amatya R. Comparison of acute physiology and chronic health evaluation II and acute physiology and chronic health evaluation IV to predict intensive care unit mortality. Indian J Crit Care Med. 2015;19:87–91. doi: 10.4103/0972-5229.151016. [DOI] [PMC free article] [PubMed] [Google Scholar]
- 6.Lee H, Shon YJ, Kim H, Paik H, Park HP. Validation of the APACHE IV model and its comparison with the APACHE II, SAPS 3, and Korean SAPS 3 models for the prediction of hospital mortality in a Korean surgical intensive care unit. Korean J Anesthesiol. 2014;67:115–22. doi: 10.4097/kjae.2014.67.2.115. [DOI] [PMC free article] [PubMed] [Google Scholar]
- 7.Brinkman S, Bakhshi-Raiez F, Abu-Hanna A, de Jonge E, Bosman RJ, Peelen L, et al. External validation of acute physiology and chronic health evaluation IV in dutch intensive care units and comparison with acute physiology and chronic health evaluation II and simplified acute physiology score II. J Crit Care. 2011;26:105.e11–8. doi: 10.1016/j.jcrc.2010.07.007. [DOI] [PubMed] [Google Scholar]
- 8.Hanley JA, McNeil BJ. The meaning and use of the area under a receiver operating characteristic (ROC) curve. Radiology. 1982;143:29–36. doi: 10.1148/radiology.143.1.7063747. [DOI] [PubMed] [Google Scholar]
- 9.Hanley JA, McNeil BJ. A method of comparing the areas under receiver operating characteristic curves derived from the same cases. Radiology. 1983;148:839–43. doi: 10.1148/radiology.148.3.6878708. [DOI] [PubMed] [Google Scholar]
- 10.Lemeshow S, Hosmer DW., Jr A review of goodness of fit statistics for use in the development of logistic regression models. Am J Epidemiol. 1982;115:92–106. doi: 10.1093/oxfordjournals.aje.a113284. [DOI] [PubMed] [Google Scholar]
- 11.Arunkumar AS, Rajaram MU, Kamat V. Validation of APACHE II and SAPS II in a multi-disciplinary ICU. Indian J Crit Care Med. 2002;6:12–8. [Google Scholar]
- 12.Ayazoglu TA. Validation of the APACHE IV scoring system in patients with stroke. A comparison with the APACHE II system. Anaesth Pain Intensive Care. 2011;15:7–12. [Google Scholar]


