

Abstract
Positron emission tomography and computed tomography (PET/CT) imaging is an increasingly valuable tool for diagnosing tuberculosis (TB). [18F]fluoro-2-deoxy-2-D-glucose (18F-FDG) is a glucose analog commonly used in PET/CT that is retained by metabolically active inflammatory cells in granulomas, but lacks specificity for particular cell types. A PET probe that could identify recruitment and differentiation of different cell populations in granulomas would be a useful research tool and could improve TB diagnosis and treatment. We used the mycobacterium-antigen murine inflammation model and macaques with TB to identify 64Cu-LLP2A, a high affinity peptidomimetic ligand for very late antigen-4 (VLA-4; also called integrin α4β1) binding cells in granulomas, and compared 64Cu-LLP2A with 18F-FDG over the course of infection. We found that 64Cu-LLP2A retention was driven by macrophages and T cells, with less contribution from neutrophils and B cells. In macaques, granulomas had higher 64Cu-LLP2A uptake than uninfected tissues, and immunohistochemical analysis of granulomas with known 64Cu-LLP2A uptake identified significant correlations between LLP2A signal and macrophage and T cell numbers. The same cells co-expressed integrin α4 and β1, further supporting that macrophages and T cells drive 64Cu-LLP2A avidity in granulomas. Over the course of infection, granulomas and thoracic lymph nodes experienced dynamic changes in affinity for both probes suggesting metabolic changes and cell differentiation or recruitment occurs throughout granuloma development. These results indicate 64Cu-LLP2A is an antigen-targeted PET probe for VLA-4, that when used in conjunction with 18F-FDG, may be a useful tool for understanding granuloma biology in TB.
Keywords: Tuberculosis, granulomas, PET/CT, VLA-4, Integrin α4β1, FDG
INTRODUCTION
Mycobacterium tuberculosis (Mtb) causes more than 10.4 million new cases of active tuberculosis (TB) and 1.8 million deaths annually (1), facts that highlight the need for new treatments and a better understanding of the host-pathogen relationship. Granulomas are the pathologic lesions associated with TB and contain macrophages, neutrophils, T cells, and B cells in distinct microenvironments (2–4) that limit bacterial dissemination and facilitate bacterial killing. Individual lesions within a single infected host can vary substantially in terms of their ability to kill Mtb (5), and in their immunologic cell components and function (3, 5, 6). These differences are important and likely to have implications for the activity of anti-mycobacterial drugs (7–9), the likelihood of reactivation (10) and disease resolution or progression (5). Although most often found in lung tissue, granulomas can also occur in lung-draining lymph nodes where they represent a difficult-to-treat bacterial reservoir.
Identifying the host factors that differentiate granulomas that restrain bacterial growth from granulomas, which permit dissemination may improve vaccine design and TB treatment. Unfortunately, granulomas form in tissues that are difficult to access in humans, and identifying aspects of granuloma function and biology prior to excision from the host has been challenging. Moreover, these endpoint assays cannot identify relevant changes that occur during lesional development and progression. The introduction of positron emission tomography and computed tomography (PET/CT) and [18F]fluoro-2-deoxy-2-D-glucose (18F-FDG)-based imaging has recently opened new avenues for investigating the pathogenesis of TB (11), especially in nonhuman primate-(5, 12–14) and rabbit-(15–17) based studies. Studies in macaques, a highly-translatable model of human TB, and have demonstrated that granulomas are independent within a single host and dynamic during infection (5, 10, 18) (and unpublished data). Moreover, 18F-FDG PET/CT has shown substantial reductions in granuloma 18F-FDG uptake (avidity) in macaques and humans during anti-TB drug therapy (18–20).
18F-FDG is a glucose analog that is taken up by cells using glycolytic metabolism for ATP generation, but does not differentiate between specific cell populations. This affects 18F-FDG’s translational value because the variable cellular makeup of different granulomas within a host may contribute to different rates of bacterial killing and treatment responses (8, 9). Using a PET probe with specificity for cell subsets in conjunction with 18F-FDG would lead to novel insights into granuloma biology including cell migration, differentiation, and granuloma fate.
Very late antigen-4 (VLA-4) is a heterodimer of integrins α4 and β1 (CD49d and CD29, respectively) expressed on the surface of inflammatory cells that binds the adhesion molecule VCAM-1 (21, 22). VLA-4 has been targeted by PET imaging with the Cu-64-labeled high affinity peptidomimetic ligand CB-TE1A1P-PEG4-LLP2A (hereafter referred to as 64Cu-LLP2A), which was demonstrated to be taken up in a VLA-4-positive murine melanoma model (23). VLA-4 plays an important role in lymphocyte differentiation and trafficking (24) and there is increasing interest in it as a therapeutic target because of its immunomodulatory activities (25, 26). In Mtb infections, VLA-4-expressing mucosal associated T (MAIT) cells provide some protection in murine TB (27). VLA-4 is highly expressed on Mtb-specific CD4+ T cells in the lungs of individuals with latent infection (28), suggesting it may have important anti-mycobacterial function. VLA-4 expression has been confirmed in other inflammatory cell populations, with elevated frequencies of VLA-4 expressing γδ T cells and monocytes in blood from individuals with TB relative to uninfected contacts (29).
To better understand how cell populations and metabolic activity change in granulomas over the course of Mtb infection, we tested and validated 64Cu-LLP2A for cynomolgus macaques and compared 64Cu-LLP2A with 18F-FDG uptake by PET-CT. We hypothesized that 64Cu-LLP2A and 18F-FDG would be differentially taken up over the course of granuloma development and stage of disease. We found that granulomas showed 64Cu-LLP2A uptake, with a spectrum of intensities occurring across multiple granulomas within a host. Epithelioid macrophages and T cells were most strongly associated with 64Cu-LLP2A activity. Moreover, there were differences and similarities between these two PET probes, with the greatest variation occurring in lung and lymph node granulomas during early infection, suggesting this time point is a period of intense metabolic activity that is followed by recruitment or differentiation of integrin α4β1-expressing cells. These data indicate that combining two different PET probes with different mechanisms of action could yield novel insights into granuloma biology that benefit basic and translational TB research.
MATERIALS AND METHODS
Reagents
All chemicals were purchased from Sigma-Aldrich Chemical Co. (St. Louis, MO), unless otherwise specified. Aqueous solutions were prepared using ultrapure water (resistivity, 18 M). Rink amide 4-methylbenzhydrylamine resin (loading, 0.77 mmol/g), and all Fmoc protected amino acid were purchased from Chem-Impex International, Inc. (Wood Dale, IL). Fmoc-PEG4 carboxylic acid was purchased from Chempep (Wellington, FL. Cy3 and Cy5 carboxylic acid was purchased from Luminprobe (Hallandale Beach, FL). All flow cytometry antibodies were purchased from BD Bioscience (San Jose, CA).
Instrumentation
Analytical and semi-preparative reversed-phase high-performance liquid chromatography (HPLC) were performed on a Waters 1525 Binary HPLC pump (Milford, MA) with a Waters 2489 UV/visible detector and a model 106 Bioscan radioactivity detector (Bioscan inc., Washington, DC). Non-radioactive HPLC samples were analyzed on an analytical Jupiter C18 column and purified on a semi-preparative Jupiter C18 column (Phenomenex, Torrance, CA). Radiochemistry reaction progress and purity were monitored on a Jupiter C18 column (Phenomenex, Torrance, CA) or TLC scanner (Bioscan System 200; Eckert & Ziegler, Hopkinton, MA). PET/CT data were acquired using a small animal Inveon Preclinical Imaging Station (Siemens Medical Solutions, Knoxville, TN).
Peptide synthesis
CB-TE1A1P-PEG4-LLP2A (LLP2A) was synthesized as previously described (23). For the Cy5- or Cy3-LLP2A, after Lys(Dde) deprotection with hydrazine (2% in DMF), Cy5 carboxylic acid (3 equivalents) or Cy3 carboxylic acid (3 equivalents) solubilized in DMF was coupled under standard conditions for 3 h. The peptide was then washed, cleaved and purified on a semi-preparative Jupiter C18 column (300 Å pore size, 5 μm particle size, 250 × 10 mm) using a Waters HPLC system. Elution was conducted at a flow rate of 3 mL/min with a gradient from 40% to 100% B in 20 min.
64Cu radiolabeling chemistry
64CuCl2 (t1/2 = 12.7 hours, β+; 17.8%, Eβ + max = 656 KeV, β−, 38.4%, Eβ− max = 573 KeV) was obtained from Washington University (St. Louis, MO) and University of Wisconsin (Madison, WI). A solution of CB-TE1A1P-PEG4-LLP2A (1–10 μg) was mixed with 64CuCl2 (1–10 mCi, 37-370 MBq) with a final volume of 100–500 μL in 0.3 M ammonium acetate buffer (pH=6.5). The mixture was incubated at 70°C for 30 min. After incubation, the radiochemical purity of the 64Cu-labeled LLP2A was monitored by radio-HPLC with a Jupiter C18 column (300 Å pore size, 5 μm particle size, 150 × 4.6 mm) or radio-TLC plate reader. Peptides were analyzed using a stepwise gradient from 20% to 100% B over 15 min. Solvent A was H2O/0.1% TFA and solvent B was CH3CN/0.01% TFA. The radiochemical purity of 64Cu-LLP2A was greater than 97%. The TLC eluant was a mixture of ammonium acetate buffer and methanol (1:1).
Murine paw inflammation model
A murine paw inflammation model (30) was used to test the LLP2A’s specificity. Briefly, mice were injected subcutaneously in the right footpads with Complete Freund’s Adjuvant (CFA; 25 μL/footpad) to induce local paw inflammation. At 24 h post CFA injection, 50 μg of Cy3-LLP2A was injected intravenously into the tail vein. At 4 h post probe injection, mice were euthanized and both paws were dissected. To obtain cells for flow cytometry, tissues incubated with a mixture of collagenase D (2 mg/ml) and DNase-I (1/100, stock solution at 1 mg /ml) in DMEM / FBS (2%) for 30 min at 37°C. Tissues were then collected and passed through a mesh filter (70 μm) to create a single cell suspension. Red blood cells were then lysed with ACK buffer (Thermo Fisher, Waltham, MA) and nucleated cells were washed with PBS. Cells were then labeled with the anti-mouse antibodies cocktail anti-Ly6G-PerCP-Cy5.5 (clone 1A8); anti-MHCII-APC (clone M5/114.15.2; Biolegend, San Diego, CA); anti-F4/80-Alexa488 (clone 6F12); anti-CD11b-PE-Cy7 (clone M1/70); anti-CD3-PE-Cy5 (clone 17A2); anti-CD49d-PE (clone 9F10) for 30 min at 4°C in staining buffer (BD bioscience). Unless otherwise indicated, all antibodies were purchased from BD Bioscience. Cells were analyzed by flow cytometry using a LSRFortessa (BD bioscience). Gating for neutrophils, macrophages and T-cells was done first on the FSC/SSC characteristics of the cells and then by antigen expression. Neutrophils were identified as Ly6G+CD11b+, macrophages were identified as F4/80+MHCII+, and T-cells were identified by CD3+ expression.
PET/CT imaging of mice
ICR mice treated with CFA in the right paw were injected intravenously via the lateral tail vein with 64Cu-LLP2A (200 μCi, 7.4 MBq). Mice were anaesthetized with 2% isoflurane and small animal PET/was performed with static images were collected for 15 min at 2 and 6 h post injection. For FDG imaging, mice were injected with 100 μCi (3.7 MBq), and where kept under anesthesia until the imaging time point (45 min) to prevent muscle activity and reduce muscle uptake of FDG. PET and CT images were co-registered with Inveon Research Workstation (IRW) software (Siemens Medical Solutions, Knoxville, TN). PET images were reconstructed with the Ordered-Subsets Expectation Maximization 3D (OSEM-3D) algorithm and the analysis of images was done using IRW. Region of interest (ROI) were drawn based on the CT and the associated activity was calculated by the IRW software. Standard uptake values (SUVs) were calculated by the IRW software based on the following formula SUV = ([nCi/mL]x[animal weight (g)]/[injected dose (nCi)]).
Immunofluorescence microscopy of LLP2A-injected cells and tissue
For immunofluorescence on the mouse paw, animals were injected in the right footpad with CFA (25 μL/footpad) to induce local inflammation. At 24 h post CFA injection, 50 μg Cy5-PEG4-LLP2A was injected intravenously at the tail vein, and mice were euthanized and the inflamed paw was dissected and frozen at 5 h post-probe injection. Frozen sections (10 μm) were made using a cryotome and sections were then fixed with 4% PFA-PBS for 5 min at room temperature and blocking was performed with 2% goat serum. Sections were then incubated with anti-CD16/CD32 Fc block (BD Bioscience) for 20 min at room temperature and then stained with either Rat anti-Mouse Gr1-FITC (clone RB68C5), Rat anti-Mouse CD68 (clone ED1; Abcam, Cambridge, MA) followed by anti-rat IgG-AlexaFluor488 (Thermo Fisher), or Hamster anti-Mouse CD3 (clone 145-2C11) followed by anti-Hamster IgG-AlexaFluor594 (Thermo Fisher). After washing in PBS, coverslips were mounted using ProLong Diamond anti-fade mounting medium (Invitrogen). Slides were imaged with a Zeiss Apotome system (Carl Zeiss Microscopy, Thornwood, NJ) equipped with a Zeiss HPO PL APO 63x oil immersion lens (numerical aperture 1.4–0.6).
Macaque Studies
All animal studies were performed according to the Guide for the Care and Use of Laboratory Animals under the auspices of Division of Laboratory Animal Resources (DLAR) of the University of Pittsburgh. This research was approved by Institutional Animal Care and Use Committee. Six to eight week old female ICR mice were purchased from Taconic laboratories (Albany, New York). Six adult cynomolgus macaques (Macaca fascicularis) were purchased from the Wisconsin National Primate Research Center (Madison, Wisconsin); the macaques were between 5–9 years of age, 3.2–7.8 kg, with 1 female and 5 males.
Six cynomolgus macaques (170-13, 177-13, 182-14, 183-14, 184-14, 185-14) were infected intrabronchially with 38–60 CFU of M. tuberculosis strain Erdman, and followed clinically as previously described (31, 32). Four of the animals were enrolled in separate studies in the Flynn lab, and underwent 18F-FDG and 64Cu-LLP2A scans when available and were necropsied between 118–129 days post-infection. 182-14 and 183-14 were animals dedicated to this project, and were necropsied at day 84 and 91 respectively. Macaques were humanely euthanized prior to necropsy, as previously described (32).
Processing cynomolgus macaque blood and tissues
Whole blood from Mtb-infected cynomolgus macaques was obtained, RBCs were lysed with RBC lysing buffer (BD Biosciences) and cells were stained for CD3 (clone SP34-2), CD11b (clone ICRF44), CD14 (clone M5E2), CD20 (clone 2H7), CD29 (clone TS2/16; eBioscience, San Diego, CA) and CD49d (integrin a4; clone 9F10). Unless otherwise indicated, antibodies were purchased from BD Biosciences. Neutrophils were identified as being CD11bhighCD14low, and monocytes were identified as being CD11blowCD14high. Cells were run on a LSRFortessa flow cytometer (BD Biosciences) maintained by the University of Pittsburgh’s Department of Infectious Diseases and Microbiology, and data were analyzed using FlowJo (TreeStar, Ashland, OR).
For quantitative analysis of 64Cu-LLP2A uptake by macaque tissues, macaques 182-14 and 183-14 were infused with tracer and imaged via PET-CT 18 h prior to necropsy (see below). Animals were maximally bled, humanely euthanized and tissues were excised as previously described, using the pre-necropsy scan as a guide for recovering identified lesions (5, 12). Tissues included lung granulomas, extrapulmonary granulomas, lymph nodes, liver, spleen, and kidney, and pectoralis muscle was used as a negative (no uptake) control. Excised tissues were placed into pre-weighed conical tubes containing 10% neutral buffered formalin, weighed again to determine the mass of the tissue, transferred to new tubes for quantifying gamma emission with a Perkin Elmer 2480 WIZARD gamma counter. Formalin-fixed tissues were retained for embedding in paraffin and sectioning for immunohistochemistry. Gamma emissions for each sample were normalized to CPM/gram.
Immunohistochemistry (IHC) on 5 μm-thick FFPE tissue sections was performed as previously described (2, 3). For quantitative analysis of cell populations in granulomas, six granulomas were selected for imaging per animal: the three with the highest CPM and the three with the lowest CPM. Formalin-fixed paraffin-embedded tissues (FFPE) from granulomas with known gamma-count profiles were stained for the dominant types of cells in granulomas including CD3 (T cells; Dako, Carpintera, CA), CD20 (B cells; Thermo Fisher), and calprotectin (clone Mac378, Thermo Fisher) neutrophils. IHC was done as previously indicated (2–4), with anti-CD3 being stained with a donkey anti-rabbit Cy5-labeled secondary antibody (Jackson ImmunoResearch, West Grove, PA) and followed with anti-CD20 and anti-calprotectin antibodies labeled with Zenon labeling reagents (Thermo Fisher). Stained sections were mounted with DAPI-containing ProLong Gold mounting medium (Thermo Fisher), and imaged by confocal microscopy. Because these granulomas are too large for an individual microscopic field, multiple overlapping microscopic fields encompassing the whole tissue section were imaged and combined into a single complete image with Image Compression Editor (Microsoft, Redmond, WA). Marker-positive cell numbers in granuloma sections were quantified via CellProfiler (33). There is no single antigen that can be used to define all macrophages in primate granulomas (3), and so macrophage numbers per granuloma were extrapolated by subtracting the number of T cells, B cells and neutrophils from the total number of nuclei per granuloma. There is no single antibody for staining the integrin α4β1 heterodimer, so to identify its localization in granulomas, we stained granulomas for integrin α4 (LifeSpan BioSciences, Seattle, WA), integrin β1 (clone 7F10, Thermo Fisher), and CD68 (Clone KP1, Thermo Fisher) and imaged them via confocal microscopy as indicated. Fluorescence channels representing the integrin staining were imported into the Fiji build of ImageJ (34) and colocalized pixels (integrin α4 and integrin β4) were identified using the Image Calculator feature with the “AND” operation.
PET/CT imaging in Mtb-infected macaques
PET/CT scans were performed on a hybrid preclinical system linking a Siemens Focus 220 microPET system (Siemens Molecular Solutions, Knoxville, TN) and a helical 8-slice Neurologica Ceretom CT scanner (Neurologica Corp., Danvers, MA). CT images were acquired following injection with 9 cc of ISOVUE® 300 CT contrast agent (Bracco Diagnostics Inc., Singen, Germany) with the following x-ray parameters: 140 kV, 2 mA, “extra sharp” image setting, 250 mm helical scan length yielding 190 slices with a total scan time of 25 s with respiratory breath hold. PET images were acquired with the following parameters after designating the specific isotope: 600 s acquisition time, lower level energy cutoff: 350 keV, upper level energy cutoff: 650 keV, timing window: 6 ns. Resulting PET listmode files were histogrammed with the following parameters: 3D histogram with no smoothing, span: 3, ring difference: 47, global average deadtime correction. PET images were reconstructed using an OSEM3D (Ordered Subset Expectation Maximum-3 Dimension) algorithm with CT-based attenuation, ramp projection filter, and scatter correction yielding a 284-slice image. Serial images were acquired in macaques using 18F-FDG at 7, 10, and 18 weeks post infection while images using 64Cu-LLP2A were acquired at 8, 11, and 17 weeks. Images were analyzed using OsiriX DICOM viewer program (Pixmeo, Geneva, Switzerland). PET probe uptake values in granulomas are reported in partial volume corrected maximum SUV (Standardized Uptake Value). To calculate partial volume correction, a standard curve was created from analysis of a Derenzo phantom containing spheres ranging in size from 3.9 to 30.3 mm filled with radioactive isotope. Due to their relatively large size, probe uptake in lymph nodes is reported in maximum SUV without partial volume correction.
Statistics
Repeated measures one-way ANOVA with Bonferroni’s multiple comparison adjustment was used to analyze longitudinal data. For non-normal data, the Friedman test with Dunn’s multiple comparison adjustment was used. Paired t-tests (normal), Mann-Whitney (non-normal), and Wilcoxon matched-pairs signed ranks tests (non-normal) were used to compare the probes at single time points. Analyses were conducted using GraphPad Prism version 6.0 (GraphPad Software, La Jolla, CA).
RESULTS
Preparation and stability of 64Cu-LLP2A
Copper-64 labeling of LLP2A-PEG4-CB-TE1A1P (LLP2A; Supplemental Figure 1) was performed as described (23). We previously reported this preparation yielded a product with a Kd of 0.28 nM for VLA-4 positive B16F10 melanoma cells (23). 64Cu-LLP2A produced for this study had high specific activity (1 mCi/μg; 37 MBq/μg) with radiochemical purity >98%. The stability of 64Cu-labeled LLP2A in macaque serum showed no decomposition or free copper after a 20 h incubation (Supplemental Figure 1) indicating this product is highly resistant to enzymatic degradation.
Validation of targeting and specificity of LLP2A in mouse paw inflammation model
The mouse paw model of Complete Freund’s Adjuvant (CFA)-induced inflammation was used to compare LLP2A and FDG uptake and to identify the immune cells targeted by LLP2A. CFA contains heat-killed Mtb in an oil emulsion and induces potent inflammatory responses within hours of injection, rather than weeks for Mtb infection in mice and provides a bridge between our mouse and monkey experiments. Sub-plantar CFA injection induced local inflammation and immune cell recruitment that is detectable with 18F-FDG by 45 minutes post-injection, and with 64Cu-LLP2A as early as 2 h post injection (Figure 1A; Table 1). We observed more 18F-FDG than 64Cu-LLP2A PET signal in the injected paws and limbs indicating there was a local increase in metabolically-active inflammatory cells in these tissues, likely attributable to recruited cells, following CFA injection. Interestingly, we observed the opposite pattern with inguinal and mesenteric lymph nodes, which were visualized by 64Cu-LLP2A, but not 18F-FDG (Figure 1A). These data suggest there are similarities in 64Cu-LLP2A and 18F-FDG signal in vivo, but also differences associated with inflammatory states and resident cell populations in different tissues.
FIGURE 1. 64Cu-LLP2A and 18F-FDG are retained in inflamed mouse paws following CFA injection.

(A) PET/CT comparison of 64Cu-LLP2A and 18F-FDG uptake in injected (right) and uninjected (left) mouse paws. PET signal is indicated in Table 1. Note that 64Cu-LLP2A is taken up by lymph nodes distal to the site of injection whereas lymph nodes are not visible in the 18F-FDG-probed animal at 45 min post injection. The difference in scan times for 64Cu-LLP2A and 18F-FDG scan times reflects the different pharmacokinetics of these probes. (B) In vivo fluorescence image showing accumulation of LLP2A-Cy5 in the injected paw (right) compared to uninjected paw (left). (C) Flow cytometry on cells collected from the inflamed paw from animal injected with LLP2A-Cy5 or not (control) demonstrates neutrophils, macrophages, and T cells stain positively with Cy5-labeled LLP2A (red lines). Black lines represent control animals not injected with LLP2A-Cy5.
TABLE 1.
Quantification of PET/CT images of mice with CFA-induced inflammation.
| Imaging time post-injection | Inflamed paw (SUVmean) | Inflamed paw/muscle ratio | |
|---|---|---|---|
| LLP2A-PEG4-CB-TE1A1P (n=3) | 2 h | 0.56 ± 0.16 | 7.5 ± 3.7 |
| LLP2A-PEG4-CB-TE1A1P (n=3) | 6 h | 0.35 ± 0.05 | 16.7 ± 1 |
|
| |||
| FDG | 45 min | 1.5 ± 0.1 | 21.4 ± 3.6 |
This model also allowed us to characterize the inflammatory infiltrate at the site of injection. To clarify the identity of 64Cu-LLP2A-avid cells in this model we injected mice with Cy3- or Cy5-LLP2A into the tail vein after CFA injection, and identified cell in the inflamed tissues by flow cytometry. Consistent with our PET/CT data, Cy5-labeled LLP2A accumulated at the injection site (Figure 1B) and flow cytometry of the inflammatory infiltrate demonstrated the presence of LLP2A-binding neutrophils, macrophages, and T cells (Figure 1C). To validate this in situ, we used immunofluorescence microscopy on inflamed paw tissue to identify Cy5-LLP2A co-localization with macrophages and T cells (Figure 2). We also observed co-localization with Gr1+ neutrophils (Figure 2), although there was a mixed pattern of Cy5-LLP2A-positive and -negative neutrophils (Figure 2, middle row) suggesting these cells are heterogeneous in their integrin α4β1 expression.
FIGURE 2. LLP2A selectively binds macrophages, T cells, and some neutrophils in vivo.
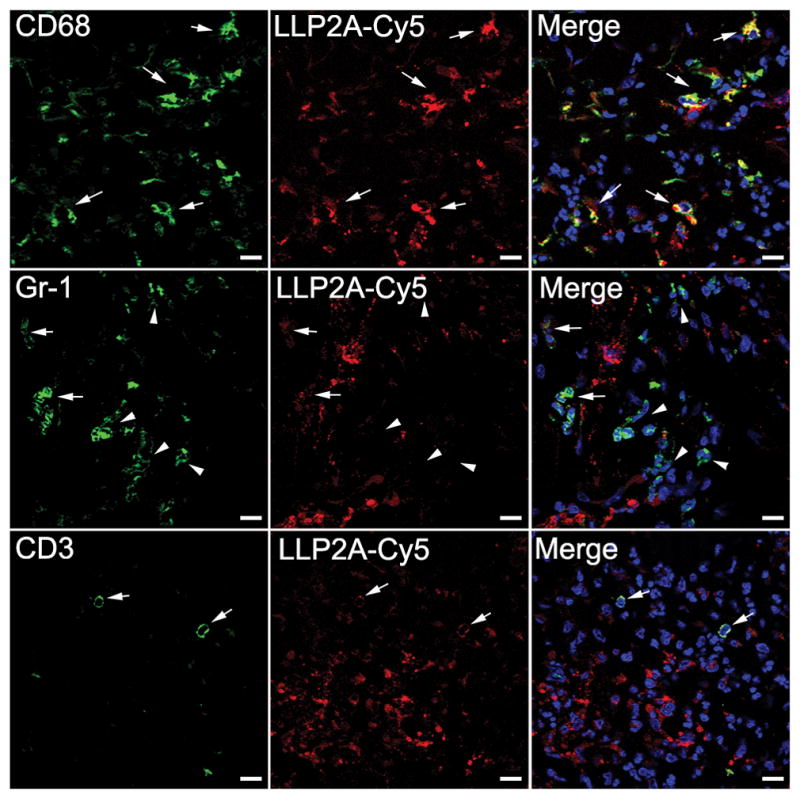
Sections from inflamed mouse paws were imaged for CD68+ macrophages (green, top row), Gr-1+ neutrophils (green, middle row), CD3+ T cells (green, bottom row) and Cy5-conjugated LLP2A (red). Merge shows colocalization of Cy5-LLP2A with macrophages, neutrophils or T-cells (arrow), or no colocalization (arrow head). Scale bars represent 10 μm.
Targeting of 64Cu-LLP2A in macaque blood
There are substantial differences between murine and primate biology, so to identify cell types that could be targets for LLP2A in macaques, we performed experiments identifying the interaction of this probe with macaque blood cells. Flow cytometry was used to identify cells co-expressing CD29 (integrin β1) and CD49d (integrin α4) in blood (Figure 3A). Both T and B cells, and large proportions of monocytes co-expressed CD29 and CD49d in blood while very little co-expression was observed in neutrophils (Figure 3A, 3B). Our isotype-based gating controls exhibited substantial positive shifts (Figure 3A), and cells expressing any combination of integrin α4 and β1 are identified by this approach. To better understand which populations express integrin α4β1, and identify relative expression rates, we incubated Cy5-LLP2A with blood to assess avidity for macaque cells by flow cytometry (Figure 3C). We found large numbers of T cells, but few B cells bound Cy5-LLP2A, whereas fewer monocytes and neutrophils bound Cy5-LLP2A (Figure 3C). Comparison of the MFI of Cy5-LLP2A positive cells, a measurement of probe bound per cell, indicated that monocytes bound more LLP2A per cell than T and B cells, but were similar to neutrophils in their ability to bind Cy5-LLP2A (Figure 3D).
Figure 3. Flow cytometric analysis of peripheral blood T cell, B cell, monocyte, and neutrophil CD29 and CD49d expression and LLP2A avidity.

Peripheral blood from cynomolgus macaques was examined for CD29+CD49d+ co-expression and LLP2A avidity by flow cytometry. A. Antibody-based staining of RBC-lysed whole blood cells and (B) quantification of CD29 and CD49d co-expression. Open circles represent isotype samples, n=8 animals. C. Binding of Cy5-conjugated LLP2A to peripheral blood cells (closed circles) from cynomolgus macaques (n=15) compared against cells incubated with a Cy5-scrambled negative control (open circles). D. Mean fluorescent intensity of Cy5-LLP2A binding cells in panel C. Statistical significance determined by the Friedman Test for multiple comparisons; * indicates p<0.05, ** indicates p<0.01, *** indicates p<0.001, and **** indicates p<0.0001.
Analysis of 64Cu-LLP2A binding targets in granulomas
To determine whether 64Cu-LLP2A was retained by macaque granulomas, we infused 64Cu-LLP2A into animals 182-14 and 183-14 18 hours prior to necropsy (Figure 4A), excised tissues and granulomas, and counted them on a gamma counter (Figure 4B). Spleens are rich in macrophages, monocytes, and lymphocytes and showed accumulation of 64Cu-LLP2A, consistent with data from mice (23). Pectoralis muscle (the negative control) showed low accumulation of tracer, while an intermediate range of counts were observed in liver and kidney (Figure 4B). The median CPM/gram for lymph nodes was higher than liver, kidney, and uninvolved lung, likely due to the large number of T cells in these tissues. Granuloma-containing tissues showed a wide range of 64Cu-LLP2A accumulations, but the median tracer levels in lung granulomas (on a per gram basis) were significantly higher than uninvolved lung, demonstrating that cells in granulomas retain more LLP2A than cells in uninvolved lung. These data indicate that granulomas are enriched for integrin α4β1-expressing cells, but there is considerable variation in 64Cu-LLP2A uptake that may represent variation in a granuloma’s cellular composition.
Figure 4. Uptake of 64Cu-LLP2A by cynomolgus macaque tissues.

(A) 3-D rendered maximum intensity projections showing overall 64Cu-LLP2A uptake in granulomas and infected lymph nodes (non-thoracic uptake removed) before necropsy. Yellow arrows indicate lymph nodes. (B) Quantitative analysis of LLP2A uptake by tissues obtained at necropsy. CPM/gram data are normalized to tissue mass and markers indicate tissues from monkeys 182-14 (blue) and 183-14 (red).
We performed IHC on formalin-fixed paraffin-embedded granulomas to determine which cell types correlated with 64Cu-LLP2A avidity. We selected T cells, B cells, and neutrophils for direct quantification because they have markers that work well for IHC (CD3, CD20, and calprotectin, respectively), and they are the most abundant non-macrophage cell types present in granulomas. No single marker fully defines macrophages in granulomas, (3) so we extrapolated macrophage numbers by subtracting T cell, B cell, and neutrophil numbers from the total number of nuclei/section. In selecting the granulomas to quantify, we chose three granulomas with similar masses (Figure 5A) but substantially different 64Cu-LLP2A avidity (based on CPM/gram) (Figure 5B). We found significantly more B cells in high CPM granulomas, but B cells were lower than T cells, neutrophils, or macrophages per section (Figure 5C). To better understand the relationship between CPM/tissue and cell subsets, we used linear regressions to correlate 64Cu-LLP2A PET signal and cell numbers (Figure 5D). We found macrophages and T cells correlated better with higher CPM/tissue than neutrophils or B cells. These data indicate there are differences between the cell populations driving LLP2A avidity in granulomas, and that macrophages and T cells are likely to be important sources of LLP2A retention in vivo.
Figure 5. LLP2A avidity is driven by macrophages and T cells.

Granulomas from monkeys 182-14 (stars) and 183-14 (circles) were selected based on their (A) similar masses, and (B) significantly different CPM/gram values for additional analysis. (C) Cell numbers per granuloma cross section, n=3 granulomas/animal/group. *p<0.05. (B) Linear regression of cell numbers per cross section and CPM/granuloma suggest a strong relationship between macrophages (P<0.0001, r2=0.9834) and T cells (P<0.0006, r2=0.9328), but lower correlation between neutrophil (P<0.0001, r2=0.8875) and B cell (P<0.347, r2=0.5359) numbers and CPM. (C) Immunohistochemistry on low CPM (top) and high CPM (bottom) granulomas from monkey 183-14 show colocalization of integrin subunits in macrophage- and lymphocyte-rich granuloma regions. Scale bar represents 200 μm.
We also performed IHC on granulomas from the high and low CPM/gram groups to determine which cells express integrin α4β1, thereby clarifying the source of 64Cu-LLP2A signal. Antibodies that recognize both integrin subunits are unavailable, so to localize α4β1, we stained tissue sections for integrin α4 (CD49d) and integrin β1 (CD29) and identified where these antigens colocalized (Figure 5E). The colocalized pixels were then compared against CD3, CD68, CD20, and calprotectin (neutrophils) staining to relate integrin α4β1 expression with different cell populations. We found that although integrin α4β1 was expressed in normal lung epithelium, alveolar macrophages, and vasculature, it was strongly expressed by epithelioid macrophages and lymphocyte-rich regions. Taken together, these data demonstrate that several cell types could contribute to LLP2A avidity in lungs but macrophages and lymphocytes are likely to be the major drivers of PET signal we observe in granulomas.
18F-FDG and 64Cu-LLP2A PET imaging suggest time point-specific biologic patterns in macaque granulomas
We performed PET/CT imaging at 4, 8, and 12 weeks p.i. to compare the spatial features of the 18F-FDG and 64Cu-LLP2A PET signals and to determine how much colocalization occurred between the different probes (representative scans shown in Figure 6). Scans were matched as closely as possible given the need for radioactive decay and animal or scanner availability. There was a considerable amount of overlap in each probe’s signal in lung granulomas (Figure 6) but differences in 18F-FDG and 64Cu-LLP2A avidity were particularly evident at early timepoints. To compare 64Cu-LLP2A and 18F-FDG over a timeframe that encompasses early and chronic infection states, we performed paired PET/CT scans on six macaques and quantified the PET signal (SUV) in lung and lymph node granulomas (Figure 7). Early infection scans were available for three animals, and paired analyses indicated that lung granulomas at these early time points (up to 9 weeks p.i.) had significantly higher 18F-FDG avidity compared to 64Cu-LLP2A (Figure 7). During the chronic phase (>9 weeks p.i.) (N=6 macaques), 2 of the 6 animals had higher 18F-FDG avidity in granulomas compared to 64Cu-LLP2A, while the probes were similar for monkeys 177-13, 182-14, 184-14, and 185-14 (Figure 7). The biology of TB in lymph nodes is particularly complex because cell populations in lymph nodes change as granulomas expand and displace the normal architecture of these organs. That said, thoracic lymph nodes followed similar but somewhat different trajectories to lung granulomas. Like lung granulomas, thoracic lymph nodes had higher 18F-FDG avidities (relative to 64Cu-LLP2A) during initial infection (4–5 week p.i.), but displayed only modest differences at later time points. These data reaffirm that granulomas are dynamic through the course of their development, experiencing an early burst of metabolic activity (indicated by 18F-FDG uptake) while integrin α4β1 expression (representing either differentiation of resident cells or migration of cells into granulomas) lags behind but eventually reaches near parity. Taken together, these data suggest that these probes, which use fundamentally different principles for retention, are identifying previously unappreciated aspects of granuloma biology.
Figure 6. 18F-FDG and 64Cu-LLP2A retention and avidity show similarities and differences in lung granulomas that vary over time.

Early 18F-FDG avidity by small granulomas is evident at four weeks pi while 64Cu-LLP2A uptake lags behind but catches up later. Transaxial sections showing 64Cu-LLP2A and 18F-FDG uptake in lung granulomas from monkey 182-14. Thoracic lymph nodes are not shown for clarity.
Figure 7. 18F-FDG and 64Cu-LLP2A uptake in lung and lymph node granulomas differ and vary over the course of disease, especially during early infection.

Each graph represents data from an individual animal, indicated along the y-axis. * p<0.05; ** p<0.01; *** p<0.001; **** p<0.0001.
DISCUSSION
TB remains a challenging disease to study because the pathology occurs in inaccessible tissues. Consequently, much of our understanding of TB comes from animal and cell culture models that may not fully model human pathology, or from biopsied human samples that represent the end result of severe pathology. To address questions regarding granuloma development, we used 64Cu-LLP2A, a peptidomimetic ligand of integrin α4β1 (25, 35), in conjunction with 18F-FDG, a commonly used PET agent, to study novel aspects of TB in cynomolgus macaques. The presentation of TB in macaques is very similar to human TB, including the extent of lung and lymph node involvement. Thus, these animals represent a highly translatable platform for testing and comparing experimental PET/CT agents that can be directly related to human infection (18). Importantly, this model and imaging modality allows us to examine changes throughout the course of disease in the same animals, and by using probes with different specificities, we can follow differentiation and migration in near real time. Our data identified timing-specific similarities and differences between 64Cu-LLP2A and 18F-FDG, two probes that use significantly different mechanisms of retention, that suggest new insights into granuloma biology and disease progression.
We validated 64Cu-LLP2A’s avidity and specificity in a mycobacterium antigen-based paw inflammation model and cynomolgus macaques with Mtb infection. These studies demonstrated that LLP2A bound to T cells and myeloid cells, with the greatest avidity for monocytes and macrophages. We also observed LLP2A-binding B cells and neutrophils, suggesting these cells play a role in granuloma LLP2A retention, but because their numbers in situ are significantly lower than the number of T cells and macrophages, we do not believe they are major contributors to the population of integrin α4β1-postive cells in granulomas. Macrophage numbers best correlated with 64Cu-LLP2A avidity, and our IHC data suggests the strongest colocalization of integrin α4 and β1 subunits occurs in epithelioid macrophages. Epithelioid macrophages are a highly differentiated macrophage population that can be abundant in TB granulomas (3), and express a variety of adhesion molecules (unpublished data). We hypothesize that much of the 64Cu-LLP2A PET signal in lung granulomas is attributable to this cell population. We observed that 64Cu-LLP2A and 18F-FDG co-accumulated in granulomas but 18F-FDG generally had a wider SUV range than 64Cu-LLP2A, suggesting that cells in granulomas undergo large changes in glycolytic metabolism, especially during early infection, but the dynamics of integrin α4β1 expression in situ are more restrained at the time points we examined.
The biologic basis for changes in 18F-FDG avidity over time remains unclear, but granulomas are poorly vascularized and the vessels are primarily located in a granuloma’s peripheral edge (36) suggesting that granuloma cells in hypoxic environments (near the necrotic center) (37) may use glycolysis-driven anaerobic metabolism for ATP generation (38, 39). This can increase a cell’s glucose uptake by up to 20-fold (40, 41), and while we cannot confirm that increased 18F-FDG avidity is not simply a numeric increase in inflammatory cells, we speculate that changes in glycolytic metabolism underlie 18F-FDG uptake and retention in granulomas. This may occur early in a granuloma’s development and underlie some of the 18F-FDG uptake we observe at these points. Alternatively, cells in early granulomas may also have higher metabolic rates as they are activated to begin killing bacteria, which we have demonstrated begins to occur at approximately 4 weeks post-infection (42). Moreover, early granulomas tend to retain more 18F-FDG than 64Cu-LLP2A, but the SUV differential decreases later in infection. We hypothesize that this is caused by different rates of recruitment or differentiation for integrin α4β1-expressing cells relative to metabolic changes in situ. In murine TB models, Mtb-specific CD4+ and CD8+ T cells expressing VLA-4 expand at 4 weeks post infection and peak at 8 weeks post-infection (43), and our data with 64Cu-LLP2A appears to reflect this behavior in macaque granulomas.
In comparison to granulomas, lymph nodes are well vascularized, and 18F-FDG uptake may not be attributable to anaerobic metabolism but may relate to priming of anti-mycobacterial immune responses (44). T cell priming is delayed in TB, and pathogen-specific T cells are difficult to detect peripherally until 3–4 weeks post infection (45), a time point that coincides with the first granulomas becoming detectable by visual examination or 18F-FDG PET/CT imaging (5, 45). The early phase of TB is also likely to be when dendritic cells or possibly macrophages transport bacilli to and seed early granulomas in thoracic lymph nodes. The early burst of 18F-FDG signal in lymph nodes during this time period may correspond elevated metabolic activity in newly primed and proliferating T cells, recruitment and differentiation of macrophages in infected lymph nodes, or combinations of both factors. As with lung granulomas, differences between 18F-FDG and 64Cu-LLP2A tend to decrease at later time points, suggesting that glucose uptake reaches an equilibrium with the number of integrin α4β1-expressing cells
The importance of VLA-4-expressing T cells in TB (28, 29) indicates these dynamics may have implications for protection that merit further study in both human and nonhuman primate systems. To that end, we are currently combining 64Cu-LLP2A with other PET probes targeting cell types with less avidity for LLP2A, such as neutrophils, as well as probes that are specific for different macrophage subsets (e.g. M1 vs M2) to explore granuloma biology. The data we present in this study is the first step in that process and may lead to a new understanding of cell recruitment and differentiation to granulomas that have therapeutic value.
Supplementary Material
Acknowledgments
We gratefully acknowledge technical assistance provided by Mark Rodgers, Carolyn Bigbee, Chelsea Chedrick, Cassaundra Updike, Melanie O’Malley, Joseph Latoche, and Beth Junecko. We also acknowledge the excellent veterinary assistance and PET/CT scanning by Melanie O’Malley, Jaime Tomko, Daniel Fillmore, L. James Frye and Dr. Edwin Klein, and intellectual contributions from Dr. Philana Ling Lin.
Footnotes
Disclosure: This work was supported by the Bill and Melinda Gates Foundation and the National Institutes of Health grant 1R01AI118195. Small animal PET/CT imaging was supported in part by NCI Cancer Center Support Grant P30CA047904 to University of Pittsburgh Cancer Institute (In Vivo Imaging Facility).
References
- 1.World Health Organization. Global tuberculosis report 2016. World Health Organization; Geneva: 2016. [Google Scholar]
- 2.Mattila JT, Maiello P, Sun T, Via LE, Flynn JL. Granzyme B-expressing neutrophils correlate with bacterial load in granulomas from Mycobacterium tuberculosis-infected cynomolgus macaques. Cell Microbiol. 2015;17:1085–1097. doi: 10.1111/cmi.12428. [DOI] [PMC free article] [PubMed] [Google Scholar]
- 3.Mattila JT, Ojo OO, Kepka-Lenhart D, Marino S, Kim JH, Eum SY, Via LE, Barry CE, 3rd, Klein E, Kirschner DE, Morris SM, Jr, Lin PL, Flynn JL. Microenvironments in tuberculous granulomas are delineated by distinct populations of macrophage subsets and expression of nitric oxide synthase and arginase isoforms. J Immunol. 2013;191:773–784. doi: 10.4049/jimmunol.1300113. [DOI] [PMC free article] [PubMed] [Google Scholar]
- 4.Phuah JY, Mattila JT, Lin PL, Flynn JL. Activated B cells in the granulomas of nonhuman primates infected with Mycobacterium tuberculosis. Am J Pathol. 2012;181:508–514. doi: 10.1016/j.ajpath.2012.05.009. [DOI] [PMC free article] [PubMed] [Google Scholar]
- 5.Coleman MT, Maiello P, Tomko J, Frye LJ, Fillmore D, Janssen C, Klein E, Lin PL. Early Changes by (18)Fluorodeoxyglucose positron emission tomography coregistered with computed tomography predict outcome after Mycobacterium tuberculosis infection in cynomolgus macaques. Infection and immunity. 2014;82:2400–2404. doi: 10.1128/IAI.01599-13. [DOI] [PMC free article] [PubMed] [Google Scholar]
- 6.Ramakrishnan L. Revisiting the role of the granuloma in tuberculosis. Nat Rev Immunol. 2012;12:352–366. doi: 10.1038/nri3211. [DOI] [PubMed] [Google Scholar]
- 7.Lenaerts A, Barry CE, 3rd, Dartois V. Heterogeneity in tuberculosis pathology, microenvironments and therapeutic responses. Immunol Rev. 2015;264:288–307. doi: 10.1111/imr.12252. [DOI] [PMC free article] [PubMed] [Google Scholar]
- 8.Prideaux B, ElNaggar MS, Zimmerman M, Wiseman JM, Li X, Dartois V. Mass spectrometry imaging of levofloxacin distribution in TB-infected pulmonary lesions by MALDI-MSI and continuous liquid microjunction surface sampling. Int J Mass Spectrom. 2015;377:699–708. doi: 10.1016/j.ijms.2014.08.024. [DOI] [PMC free article] [PubMed] [Google Scholar]
- 9.Prideaux B, Via LE, Zimmerman MD, Eum S, Sarathy J, O’Brien P, Chen C, Kaya F, Weiner DM, Chen PY, Song T, Lee M, Shim TS, Cho JS, Kim W, Cho SN, Olivier KN, Barry CE, 3rd, Dartois V. The association between sterilizing activity and drug distribution into tuberculosis lesions. Nature medicine. 2015;21:1223–1227. doi: 10.1038/nm.3937. [DOI] [PMC free article] [PubMed] [Google Scholar]
- 10.Lin PL, Maiello P, Gideon HP, Coleman MT, Cadena AM, Rodgers MA, Gregg R, O’Malley M, Tomko J, Fillmore D, Frye LJ, Rutledge T, DiFazio RM, Janssen C, Klein E, Andersen PL, Fortune SM, Flynn JL. PET CT Identifies Reactivation Risk in Cynomolgus Macaques with Latent M. tuberculosis. PLoS Pathog. 2016;12:e1005739. doi: 10.1371/journal.ppat.1005739. [DOI] [PMC free article] [PubMed] [Google Scholar]
- 11.Skoura E, Zumla A, Bomanji J. Imaging in tuberculosis. Int J Infect Dis. 2015;32:87–93. doi: 10.1016/j.ijid.2014.12.007. [DOI] [PubMed] [Google Scholar]
- 12.Lin PL, Coleman T, Carney JP, Lopresti BJ, Tomko J, Fillmore D, Dartois V, Scanga C, Frye LJ, Janssen C, Klein E, Barry CE, 3rd, Flynn JL. Radiologic responses in cynomolgous macaques for assessing tuberculosis chemotherapy regimens. Antimicrobial agents and chemotherapy. 2013 doi: 10.1128/AAC.00277-13. [DOI] [PMC free article] [PubMed] [Google Scholar]
- 13.Via LE, Weiner DM, Schimel D, Lin PL, Dayao E, Tankersley SL, Cai Y, Coleman MT, Tomko J, Paripati P, Orandle M, Kastenmayer RJ, Tartakovsky M, Rosenthal A, Portevin D, Eum SY, Lahouar S, Gagneux S, Young DB, Flynn JL, Barry CE., 3rd Differential virulence and disease progression following Mycobacterium tuberculosis complex infection of the common marmoset (Callithrix jacchus) Infection and immunity. 2013;81:2909–2919. doi: 10.1128/IAI.00632-13. [DOI] [PMC free article] [PubMed] [Google Scholar]
- 14.Via LE, England K, Weiner DM, Schimel D, Zimmerman MD, Dayao E, Chen RY, Dodd LE, Richardson M, Robbins KK, Cai Y, Hammoud D, Herscovitch P, Dartois V, Flynn JL, Barry CE., 3rd A sterilizing tuberculosis treatment regimen is associated with faster clearance of bacteria in cavitary lesions in marmosets. Antimicrobial agents and chemotherapy. 2015;59:4181–4189. doi: 10.1128/AAC.00115-15. [DOI] [PMC free article] [PubMed] [Google Scholar]
- 15.Via LE, Schimel D, Weiner DM, Dartois V, Dayao E, Cai Y, Yoon YS, Dreher MR, Kastenmayer RJ, Laymon CM, Carny JE, Flynn JL, Herscovitch P, Barry CE., 3rd Infection dynamics and response to chemotherapy in a rabbit model of tuberculosis using [(1)(8)F]2-fluoro-deoxy-D-glucose positron emission tomography and computed tomography. Antimicrobial agents and chemotherapy. 2012;56:4391–4402. doi: 10.1128/AAC.00531-12. [DOI] [PMC free article] [PubMed] [Google Scholar]
- 16.Luna B, Kubler A, Larsson C, Foster B, Bagci U, Mollura DJ, Jain SK, Bishai WR. In vivo prediction of tuberculosis-associated cavity formation in rabbits. J Infect Dis. 2015;211:481–485. doi: 10.1093/infdis/jiu449. [DOI] [PMC free article] [PubMed] [Google Scholar]
- 17.Bagci U, Foster B, Miller-Jaster K, Luna B, Dey B, Bishai WR, Jonsson CB, Jain S, Mollura DJ. A computational pipeline for quantification of pulmonary infections in small animal models using serial PET-CT imaging. EJNMMI Res. 2013;3:55. doi: 10.1186/2191-219X-3-55. [DOI] [PMC free article] [PubMed] [Google Scholar]
- 18.Coleman MT, Chen RY, Lee M, Lin PL, Dodd LE, Maiello P, Via LE, Kim Y, Marriner G, Dartois V, Scanga C, Janssen C, Wang J, Klein E, Cho SN, Barry CE, 3rd, Flynn JL. PET/CT imaging reveals a therapeutic response to oxazolidinones in macaques and humans with tuberculosis. Sci Transl Med. 2014;6:265ra167. doi: 10.1126/scitranslmed.3009500. [DOI] [PMC free article] [PubMed] [Google Scholar]
- 19.Chen RY, Dodd LE, Lee M, Paripati P, Hammoud DA, Mountz JM, Jeon D, Zia N, Zahiri H, Coleman MT, Carroll MW, Lee JD, Jeong YJ, Herscovitch P, Lahouar S, Tartakovsky M, Rosenthal A, Somaiyya S, Lee S, Goldfeder LC, Cai Y, Via LE, Park SK, Cho SN, Barry CE., 3rd PET/CT imaging correlates with treatment outcome in patients with multidrug-resistant tuberculosis. Sci Transl Med. 2014;6:265ra166. doi: 10.1126/scitranslmed.3009501. [DOI] [PMC free article] [PubMed] [Google Scholar]
- 20.Liu Q, Via LE, Luo T, Liang L, Liu X, Wu S, Shen Q, Wei W, Ruan X, Yuan X, Zhang G, Barry CE, 3rd, Gao Q. Within patient microevolution of Mycobacterium tuberculosis correlates with heterogeneous responses to treatment. Sci Rep. 2015;5:17507. doi: 10.1038/srep17507. [DOI] [PMC free article] [PubMed] [Google Scholar]
- 21.Elices MJ, Osborn L, Takada Y, Crouse C, Luhowskyj S, Hemler ME, Lobb RR. VCAM-1 on activated endothelium interacts with the leukocyte integrin VLA-4 at a site distinct from the VLA-4/fibronectin binding site. Cell. 1990;60:577–584. doi: 10.1016/0092-8674(90)90661-w. [DOI] [PubMed] [Google Scholar]
- 22.Springer TA. Traffic signals on endothelium for lymphocyte recirculation and leukocyte emigration. Annual review of physiology. 1995;57:827–872. doi: 10.1146/annurev.ph.57.030195.004143. [DOI] [PubMed] [Google Scholar]
- 23.Beaino W, Anderson CJ. PET imaging of very late antigen-4 in melanoma: comparison of 68Ga- and 64Cu-labeled NODAGA and CB-TE1A1P-LLP2A conjugates. Journal of nuclear medicine : official publication, Society of Nuclear Medicine. 2014;55:1856–1863. doi: 10.2967/jnumed.114.144881. [DOI] [PMC free article] [PubMed] [Google Scholar]
- 24.Hyun YM, Chung HL, McGrath JL, Waugh RE, Kim M. Activated integrin VLA-4 localizes to the lamellipodia and mediates T cell migration on VCAM-1. J Immunol. 2009;183:359–369. doi: 10.4049/jimmunol.0803388. [DOI] [PMC free article] [PubMed] [Google Scholar]
- 25.Kenyon NJ, Liu R, O’Roark EM, Huang W, Peng L, Lam KS. An alpha4beta1 integrin antagonist decreases airway inflammation in ovalbumin-exposed mice. Eur J Pharmacol. 2009;603:138–146. doi: 10.1016/j.ejphar.2008.11.063. [DOI] [PMC free article] [PubMed] [Google Scholar]
- 26.Ley K, Rivera-Nieves J, Sandborn WJ, Shattil S. Integrin-based therapeutics: biological basis, clinical use and new drugs. Nat Rev Drug Discov. 2016;15:173–183. doi: 10.1038/nrd.2015.10. [DOI] [PMC free article] [PubMed] [Google Scholar]
- 27.Sakala IG, Kjer-Nielsen L, Eickhoff CS, Wang X, Blazevic A, Liu L, Fairlie DP, Rossjohn J, McCluskey J, Fremont DH, Hansen TH, Hoft DF. Functional Heterogeneity and Antimycobacterial Effects of Mouse Mucosal-Associated Invariant T Cells Specific for Riboflavin Metabolites. J Immunol. 2015;195:587–601. doi: 10.4049/jimmunol.1402545. [DOI] [PMC free article] [PubMed] [Google Scholar]
- 28.Walrath JR, Silver RF. The alpha4beta1 integrin in localization of Mycobacterium tuberculosis-specific T helper type 1 cells to the human lung. Am J Respir Cell Mol Biol. 2011;45:24–30. doi: 10.1165/rcmb.2010-0241OC. [DOI] [PubMed] [Google Scholar]
- 29.Behr-Perst SI, Munk ME, Schaberg T, Ulrichs T, Schulz RJ, Kaufmann SH. Phenotypically activated gammadelta T lymphocytes in the peripheral blood of patients with tuberculosis. J Infect Dis. 1999;180:141–149. doi: 10.1086/314844. [DOI] [PubMed] [Google Scholar]
- 30.Barin JG, Baldeviano GC, Talor MV, Wu L, Ong S, Quader F, Chen P, Zheng D, Caturegli P, Rose NR, Cihakova D. Macrophages participate in IL-17-mediated inflammation. Eur J Immunol. 2012;42:726–736. doi: 10.1002/eji.201141737. [DOI] [PMC free article] [PubMed] [Google Scholar]
- 31.Capuano SV, 3rd, Croix DA, Pawar S, Zinovik A, Myers A, Lin PL, Bissel S, Fuhrman C, Klein E, Flynn JL. Experimental Mycobacterium tuberculosis infection of cynomolgus macaques closely resembles the various manifestations of human M. tuberculosis infection. Infection and immunity. 2003;71:5831–5844. doi: 10.1128/IAI.71.10.5831-5844.2003. [DOI] [PMC free article] [PubMed] [Google Scholar]
- 32.Lin PL, Rodgers M, Smith L, Bigbee M, Myers A, Bigbee C, Chiosea I, Capuano SV, Fuhrman C, Klein E, Flynn JL. Quantitative comparison of active and latent tuberculosis in the cynomolgus macaque model. Infection and immunity. 2009;77:4631–4642. doi: 10.1128/IAI.00592-09. [DOI] [PMC free article] [PubMed] [Google Scholar]
- 33.Lamprecht MR, Sabatini DM, Carpenter AE. CellProfiler: free, versatile software for automated biological image analysis. Biotechniques. 2007;42:71–75. doi: 10.2144/000112257. [DOI] [PubMed] [Google Scholar]
- 34.Schindelin J, Arganda-Carreras I, Frise E, Kaynig V, Longair M, Pietzsch T, Preibisch S, Rueden C, Saalfeld S, Schmid B, Tinevez JY, White DJ, Hartenstein V, Eliceiri K, Tomancak P, Cardona A. Fiji: an open-source platform for biological-image analysis. Nat Methods. 2012;9:676–682. doi: 10.1038/nmeth.2019. [DOI] [PMC free article] [PubMed] [Google Scholar]
- 35.Peng L, Liu R, Marik J, Wang X, Takada Y, Lam KS. Combinatorial chemistry identifies high-affinity peptidomimetics against alpha4beta1 integrin for in vivo tumor imaging. Nat Chem Biol. 2006;2:381–389. doi: 10.1038/nchembio798. [DOI] [PubMed] [Google Scholar]
- 36.Datta M, Via LE, Kamoun WS, Liu C, Chen W, Seano G, Weiner DM, Schimel D, England K, Martin JD, Gao X, Xu L, Barry CE, 3rd, Jain RK. Anti-vascular endothelial growth factor treatment normalizes tuberculosis granuloma vasculature and improves small molecule delivery. Proc Natl Acad Sci U S A. 2015;112:1827–1832. doi: 10.1073/pnas.1424563112. [DOI] [PMC free article] [PubMed] [Google Scholar]
- 37.Via LE, Lin PL, Ray SM, Carrillo J, Allen SS, Eum SY, Taylor K, Klein E, Manjunatha U, Gonzales J, Lee EG, Park SK, Raleigh JA, Cho SN, McMurray DN, Flynn JL, Barry CE., 3rd Tuberculous granulomas are hypoxic in guinea pigs, rabbits, and nonhuman primates. Infection and immunity. 2008;76:2333–2340. doi: 10.1128/IAI.01515-07. [DOI] [PMC free article] [PubMed] [Google Scholar]
- 38.Shi L, Eugenin EA, Subbian S. Immunometabolism in Tuberculosis. Front Immunol. 2016;7:150. doi: 10.3389/fimmu.2016.00150. [DOI] [PMC free article] [PubMed] [Google Scholar]
- 39.Sathekge M, Maes A, Van de Wiele C. Semin Nucl Med. 2013;43:349–366. doi: 10.1053/j.semnuclmed.2013.04.008. 38. [DOI] [PubMed] [Google Scholar]
- 40.Marjanovic S, Skog S, Heiden T, Tribukait B, Nelson BD. Expression of glycolytic isoenzymes in activated human peripheral lymphocytes: cell cycle analysis using flow cytometry. Exp Cell Res. 1991;193:425–431. doi: 10.1016/0014-4827(91)90116-c. [DOI] [PubMed] [Google Scholar]
- 41.Bental M, Deutsch C. Metabolic changes in activated T cells: an NMR study of human peripheral blood lymphocytes. Magn Reson Med. 1993;29:317–326. doi: 10.1002/mrm.1910290307. [DOI] [PubMed] [Google Scholar]
- 42.Lin PL, Ford CB, Coleman MT, Myers AJ, Gawande R, Ioerger T, Sacchettini J, Fortune SM, Flynn JL. Sterilization of granulomas is common in active and latent tuberculosis despite within-host variability in bacterial killing. Nature medicine. 2014;20:75–79. doi: 10.1038/nm.3412. [DOI] [PMC free article] [PubMed] [Google Scholar]
- 43.Feng CG, Britton WJ, Palendira U, Groat NL, Briscoe H, Bean AG. Up-regulation of VCAM-1 and differential expansion of beta integrin-expressing T lymphocytes are associated with immunity to pulmonary Mycobacterium tuberculosis infection. J Immunol. 2000;164:4853–4860. doi: 10.4049/jimmunol.164.9.4853. [DOI] [PubMed] [Google Scholar]
- 44.Appelberg R, Moreira D, Barreira-Silva P, Borges M, Silva L, Dinis-Oliveira RJ, Resende M, Correia-Neves M, Jordan MB, Ferreira NC, Abrunhosa AJ, Silvestre R. The Warburg effect in mycobacterial granulomas is dependent on the recruitment and activation of macrophages by interferon-gamma. Immunology. 2015;145:498–507. doi: 10.1111/imm.12464. [DOI] [PMC free article] [PubMed] [Google Scholar]
- 45.Lin PL, Pawar S, Myers A, Pegu A, Fuhrman C, Reinhart TA, Capuano SV, Klein E, Flynn JL. Early events in Mycobacterium tuberculosis infection in cynomolgus macaques. Infection and immunity. 2006;74:3790–3803. doi: 10.1128/IAI.00064-06. [DOI] [PMC free article] [PubMed] [Google Scholar]
Associated Data
This section collects any data citations, data availability statements, or supplementary materials included in this article.