

Summary
The unfolded protein response (UPR), induced by endoplasmic reticulum (ER) stress, regulates the expression of factors that restore protein folding homeostasis. However, in the liver and kidney, ER stress also leads to lipid accumulation, accompanied at least in the liver by transcriptional suppression of metabolic genes. The mechanisms of this accumulation are unclear, including which pathways contribute to the phenotype in each organ. We combined gene expression profiling, biochemical assays, and untargeted lipidomics to understand the basis of stress-dependent lipid accumulation, taking advantage of enhanced hepatic and renal steatosis in mice lacking the ER stress sensor ATF6α. We found that impaired fatty acid oxidation contributed to the early development of steatosis in the liver, but not the kidney; while anorexia-induced lipolysis promoted late triglyceride and free fatty acid accumulation in both organs. These findings provide evidence for both direct and indirect regulation of peripheral metabolism by ER stress.
Keywords: ER stress, unfolded protein response, fatty liver, fatty kidney, fatty acid oxidation, lipolysis, lipidomics
Graphical abstract
The mechanisms by which the liver and kidney become steatotic when challenged by ER stress are not known. DeZwaan-McCabe et al. show that ER stress inhibits fatty acid oxidation in the liver, and that unmitigated stress causes anorexia and promotes adipose lipolysis and further steatosis in the liver and kidney.

Introduction
ER stress is caused by an imbalance between the need to properly fold newly synthesized secretory and membrane proteins and the capacity of the organelle to do so. Accordingly, UPR activation alleviates ER stress by both transcriptional and non-transcriptional mechanisms that together diminish protein load and enhance the ability of the organelle to properly fold, transport, or degrade client proteins (Walter and Ron, 2011; Wang and Kaufman, 2016). As ER protein folding is a fundamental cellular process, the upregulation of genes encoding ER chaperones, trafficking factors, and ER-associated degradation (ERAD) components is conserved from one cell type to another, and from yeast to humans (Arensdorf et al., 2013b).
In the liver, ER stress leads to lipid accumulation, or hepatic steatosis (Rutkowski et al., 2008; Yamamoto et al., 2010; Zhang et al., 2011), indicating that ER stress and/or UPR activation regulates, directly or indirectly, lipid metabolism in that organ. This steatosis can be elicited by overexpression of a difficult-to-fold protein (Rutkowski et al., 2008), proteasome inhibition (Chikka et al., 2013), or, most robustly, by inhibition of the ER-specific post-translational modification N-linked glycosylation using the drug tunicamycin (TM) (Lee et al., 2012; Rutkowski et al., 2008). Necessarily, ER stress must elicit hepatic steatosis either by decreased lipid efflux or catabolism, or by increased synthesis or uptake, or some combination of these. ER stress is known to impair the secretion of very low density lipoprotein (VLDL) from the liver (Ota et al., 2008; Rutkowski et al., 2008; Wang et al., 2012; Yamamoto et al., 2010). VLDL particles are assembled in the ER by the coalescence of triglyceride and cholesterol around the ER client protein apolipoprotein B100 (Gibbons et al., 2004). Failure to secrete triglycerides in the form of VLDL particles doubtless contributes to stress-induced hepatic steatosis.
ER stress in the liver also leads to substantial and coordinated regulation of genes involved in lipid metabolism, including both anabolism and catabolism (Arensdorf et al., 2013a; Rutkowski et al., 2008). However, the contributions of lipogenesis and fatty acid oxidation (FAox) in vivo are not known, since the actual activity of these pathways has not been assessed. Importantly, ER stress has been implicated in a number of chronic diseases that result in lipid dysregulation, including obesity (Özcan et al., 2004), alcoholism (Ji, 2014), viral hepatitis (Chan, 2014), and others. Thus, the mechanisms leading from ER stress to lipid dysregulation are of considerable physiological importance.
ER stress is sensed by three pathways, and two of these—mediated by PERK (PKR-like endoplasmic reticulum kinase) and IRE1α (Inositol-requiring enzyme 1α) are essential in vertebrates (Harding et al., 2001; Zhang et al., 2011). However, animals lacking the third sensor, ATF6α (Activating transcription factor 6α), are viable and overtly normal (Gomez et al., 2014). ATF6α augments the transcriptional upregulation of ER chaperones and ERAD factors but is not strictly essential for upregulation of most of these (Adachi et al., 2008; Wu et al., 2007; Yamamoto et al., 2007). Accordingly, cells lacking ATF6α are capable of initially responding appropriately to ER stress, but become progressively impaired as ER stress persists, due to their inability to resolve the stress (Wu et al., 2007). As a consequence, animals lacking ATF6α, while having no apparent basal phenotype, are sensitive to a number of experimental ER stressors (Azuma et al., 2014; Cao et al., 2013; Egawa et al., 2011; Usui et al., 2012; Wu et al., 2011; Yoshikawa et al., 2015). This sensitivity includes challenge with TM, which in Atf6α-/- animals leads to not only profoundly fatty liver, but also to fat accumulation in the kidney (renal steatosis)—which occurs much less prominently if at all in wild-type animals—and eventually, within 72-96 hours, to death (Wu et al., 2007). We used the hypersensitivity Atf6α-/- animals to stress as a tool to identify the pathways by which ER stress leads to lipid accumulation in these two distinct organs.
Results
ER stress induces lipid accumulation in liver and kidneys of Atf6α-/- mice
To better characterize ER stress-induced hepatic and renal steatosis, we treated wild-type and Atf6α-/- mice with the ER stressor tunicamycin (TM). While other stressors such as hepatic overexpression of a difficult-to-fold protein or proteasome inhibition also lead to steatosis and similar changes in the expression of metabolic genes as TM (Chikka et al., 2013; Rutkowski et al., 2008), TM is the most robust and specific ER stressor in vivo. TM robustly targets the liver and kidneys, as shown by splicing of the target of the IRE1 endonuclease, Xbp1 mRNA (Figure 1A).
Figure 1. TM treatment causes hepatic and renal steatosis in Atf6α-/- mice.
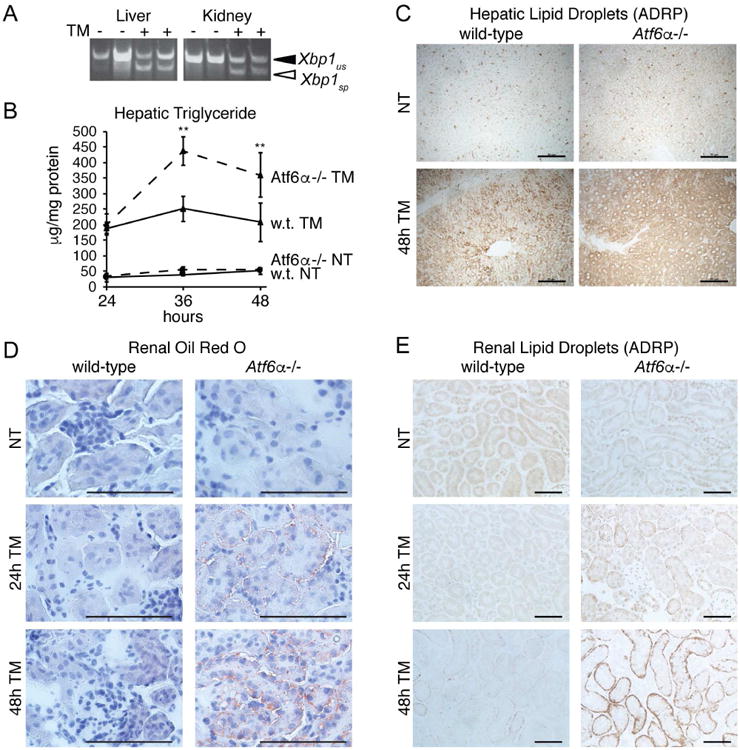
A. Mice were challenged with vehicle or 1 mg/kg TM as indicated for 8h and RNA was prepared from liver and kidneys. Xbp1 mRNA splicing was detected by conventional RT-PCR, with spliced (sp) and unspliced (us) forms indicated.
B. Wild-type or Atf6α-/- mice were challenged with vehicle or 1 mg/kg TM, and triglyceride levels were measured in liver lysates at the indicated times following injection. Significances compare Atf6α-/- and wild-type TM-treated animals. n = 3-4 animals per group. Throughout the manuscript, graphs present data as means +/- SDM.
C. Formalin-fixed liver sections from wild-type or Atf6α-/- animals treated with TM for 48h were stained for the lipid droplet marker protein ADRP. Representative images are shown. Scale bars = 50 μm
D. Fresh frozen kidney sections from wild-type or Atf6α-/- animals treated for 24 or 48h with TM were stained with the neutral lipid stain Oil Red O. Representative images are shown.
E. Formalin-fixed kidney sections from animals treated as in (D) were stained for the lipid droplet marker protein ADRP as in (C). Representative images are shown.
In our previous work, we showed that TM treatment leads to hepatic lipid accumulation as rapidly as 8 hours after challenge (Arensdorf et al., 2013a). Here as well, TM led to hepatic triglyceride accumulation in both wild-type and Atf6α-/- animals, and this accumulation became even more pronounced specifically in Atf6α-/- animals at later times after challenge. This accumulation was seen in both direct measurement of hepatic triglyceride (Figure 1B) and immunostaining for the lipid droplet marker protein ADRP (Figure 1C). Thus, hepatic steatosis initially occurs in both wild-type and Atf6α-/-animals, but is exacerbated at later times in the knockouts.
In contrast to the liver, TM-induced renal lipid accumulation was restricted to Atf6α-/- animals. Oil Red O staining, which detects neutral lipids, revealed very little accumulation in wild-type animals, but substantial steatosis in the tubule cells in Atf6α-/-animals, particularly 48 hours after challenge (Figure 1D). These findings were mirrored by ADRP immunostaining of the kidneys (Figure 1E).
Lipogenesis does not contribute to early hepatic steatosis
Previous reports in cultured hepatocytes and other cell types have suggested that ER stress stimulates lipogenesis (Colgan et al., 2007; Lee et al., 2012). Yet our own work has suggested that important genes of the lipogenic pathway are downregulated by ER stress (Arensdorf et al., 2013a), consistent with other studies suggesting an anti-lipogenic effect of ER stress (Herrema et al., 2016; Wang et al., 2012). Despite this finding, it is possible that stress stimulates lipogenesis only during a transient window that had been previously overlooked. Thus, we first examined in wild-type and Atf6α-/-animals the expression of genes encoding both transcriptional master regulators of lipogenesis and cholesterologenesis (Srebf1, Srebf2, respectively) and important and rate-limiting enzymes in both processes (Acaca, Fasn, Scd1, and Hmgcr). The lipogenic genes (Srebf1, Acaca, Fasn, and Scd1) were robustly suppressed by ER stress to comparable extents in both wild-type and Atf6α-/- animals at all time points examined (Figure 2A). The cholesterologenic genes (Srebf2 and Hmgcr) were somewhat discrepant between the two genotypes, but did not show any evidence of being upregulated (Figure 2A).
Figure 2. TM suppresses lipogenic genes and does not affect hepatic lipogenic activity at early times after challenge.
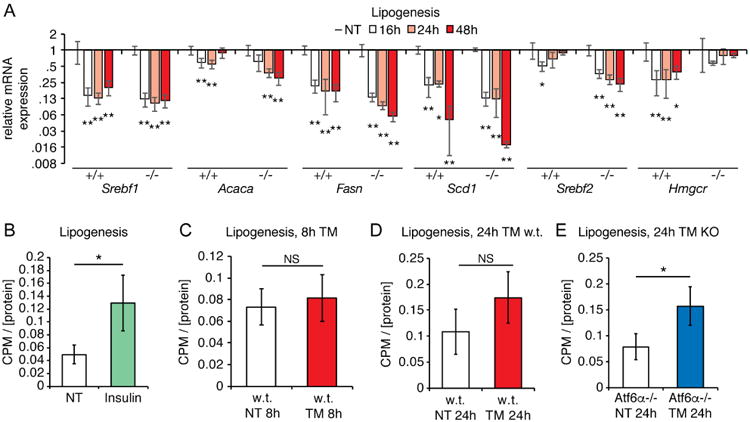
A. The expression of the indicated lipogenic and cholesterologenic genes was measured by qRT-PCR from the livers of wild-type or Atf6α-/- animals challenged with TM for the indicated times. Significances were determined relative to unchallenged animals of the same genotype. n=3
B. Wild-type mice were treated with 2U of human insulin for 1h, and lipogenic activity relative to homogenate protein concentration was measured in liver homogenates by conversion of 14C-acetate into 14C-fatty acid as described in Experimental Procedures.n=3
C. Wild-type mice were treated with TM for 8h, and hepatic lipogenic activity was measured as in (B). n=3
D. Wild-type mice were treated with TM for 24h, and then lipogenic activity was assessed as above. n=3
E. Same as (D) except using Atf6α-/- animals. n=3
We next directly assessed lipogenic activity at early and later points after ER stress induction, monitoring the conversion of 14C-acetate into 14C-fatty acid by liver homogenates. We monitored metabolic activity at both early time points (8 hours) in wild-type animals and at later points in both wild-type and Atf6α-/- animals, when the latter specifically begin to show both exacerbated liver ER stress and enhanced hepatic steatosis (e.g., Figure 1B and (Arensdorf et al., 2013a)). As a positive control, we first confirmed that treating animals with insulin yielded the expected increase in lipogenic activity (Jones, 2016) (Figure 2B). Yet no significant increase in lipogenic activity was seen in wild-type mice (Figures 2C) or Atf6α-/- mice (not shown) 8 hours after challenge, nor in wild-type mice 24 hours after challenge (Figure 2D). We did, however, detect an increase in lipogenic activity in Atf6α-/- animals 24 hours after challenge (Figure 2E). Given the substantial suppression of lipogenic genes in these animals (Figure 2A), this finding was unexpected and awaits further studies to explain. In any case, these results suggest that lipogenesis is not a meaningful early contributor to ER stress-induced hepatic steatosis in wild-type mice, although it might contribute at a later phase.
ER stress suppresses hepatic fatty acid oxidation
We next used a similar genetic and biochemical approach to ask whether FAox contributes to hepatic steatosis. We found that the transcriptional master regulator of FAox, Peroxisome Proliferator Activated Receptor Alpha (Ppara), was suppressed ∼2-fold by ER stress in wild-type animals, while it was suppressed ∼8-fold in Atf6α-/-animals (Figure 3A). Genes encoding key steps in beta-oxidation (Cpt1a, Acadm), peroxisomal oxidation (Acox1), and microsomal oxidation (Cyp4a10) were not suppressed in wild-type animals, but were significantly suppressed in Atf6α-/- animals (Figure 3A).
Figure 3. ER stress suppresses hepatic FAox activity.
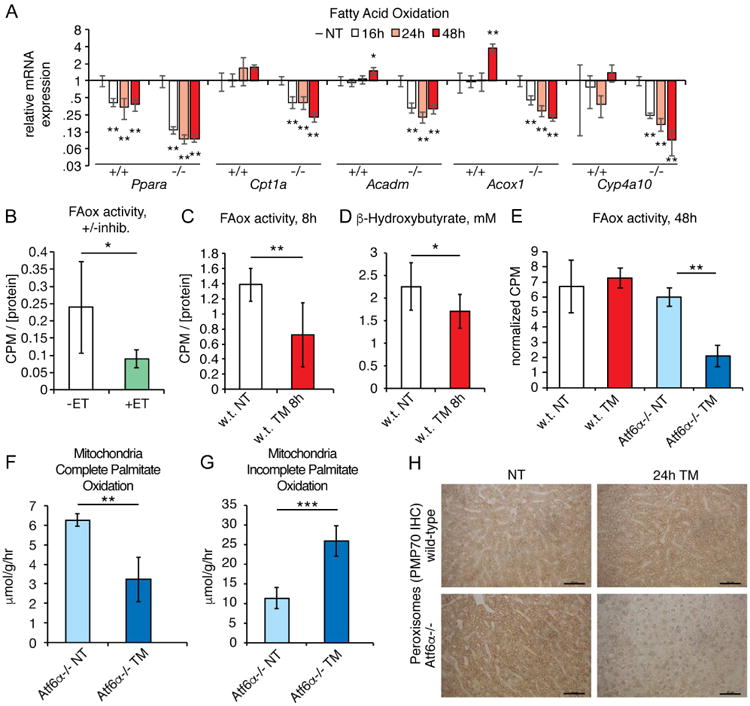
A. Expression of the indicated FAox genes was assessed by qRT-PCR as in Figure 2A.
B. Mice were fasted for 24h and homogenates were isolated and divided into two aliquots, one of which was treated with the CPT1 inhibitor etomoxir. FAox activity was measured as described in the Experimental Procedures section. n=6
C. Wild-type mice were fasted for 24h and treated with TM for the final 8h, and FAox activity was measured from liver homogenates as above. n=6-8
D. β-hydroxybutyrate levels were measured from the plasma of animals treated as in(C). n=8-9
E. Wild-type or Atf6α-/- animals were treated for 48h with TM, including fasting for the last 20h. Hepatic FAox activity was measured as above. n=3
F, G. Atf6α-/- animals were treated for 48h with TM and mitochondria were isolated from liver homogenates. Production of 14CO2 (F) and acid-soluble metabolites (G) was measured as described in Experimental Procedures. n=4
H. Peroxisome abundance was assessed by immunohistochemistry using the marker PMP70, from animals treated for 24h with vehicle or 1 mg/kg TM. Representative data are shown.
To directly assess FAox activity, we monitored the conversion of 14C-palmitate into 14CO2; as expected, this conversion was significantly reduced by the CPT1 inhibitor etomoxir (Figure 3B). Using this assay to monitor FAox activity in liver homogenates, we found that FAox was suppressed by approximately 50 percent in wild-type animals 8 hours after challenge (Figure 3C). Supporting this finding, serum levels of the ketone body β-hydroxybutyrate, which is a byproduct of hepatic FAox (Rui, 2014), were also diminished (Figure 3D). By 48 hours after challenge FAox activity returned to normal levels in wild-type mice, but remained suppressed in Atf6α-/- animals (Figure 3E).
Lipid accumulation due to impaired FAox could be due to dysregulation of β-oxidation in the mitochondria, to inhibition of peroxisomal oxidation—which principally shortens very long chain fatty acids for entry into β-oxidation—or both. We observed a significant decrease in the ability of isolated mitochondria from TM-treated Atf6α-/-animals to completely oxidize palmitate to CO2 (Figure 3F). Instead, mitochondria from TM-treated animals accumulated acid-soluble metabolites, which are incompletely oxidized products of β-oxidation (Hirschey et al., 2011) (Figure 3G). The accumulation of these products suggest that TM impairs FAox at a point downstream of lipid shuttling into mitochondria and upstream of entry of acetyl-CoA into the TCA cycle. Mitochondrial content did not differ between groups, as assessed by OXPHOS immunblot (not shown). We also observed that peroxisomal content was dramatically reduced in Atf6α-/- but not wild-type animals 24 hours after challenge (Figure 3H). This finding was consistent with the profound genetic suppression of Pparα which, as its name denotes, stimulates peroxisome proliferation. Taken together, these results show that ER stress inhibits FAox activity, likely at both mitochondrial and peroxisomal levels, and that this inhibition contributes to the early development of hepatic steatosis in both wild-type and knockout animals, and to the late aggravation of hepatic steatosis in Atf6α-/- animals.
Neither suppressed catabolism nor enhanced anabolism accounts for kidney steatosis
Given that liver-autonomous processes—namely inhibition of VLDL secretion (Ota et al., 2008; Rutkowski et al., 2008; Wang et al., 2012; Yamamoto et al., 2010) and of FAox (Figure 3) contribute to stress-induced hepatic steatosis, we asked whether renal steatosis might likewise occur through direct regulation of metabolism by ER stress in the kidney. Supporting our findings in Figure 1, we found that mRNA expression of the lipid droplet marker Adrp–the transcription of which is known to increase when intracellular lipid levels rise (Targett-Adams et al., 2005)—was increased in Atf6α-/- mice, but not wild-type mice, and that this induction was much more dramatic 48 hours after challenge (Figure 4A). Thus, by at least this readout there is transcriptional evidence of lipid dysregulation in the kidney. In contrast to the liver, however, a survey of genes involved in both lipogenesis and FAox revealed no significant changes in the kidney in either wild-type or knockout animals (Figure 4B and data not shown). Consistent with this finding, we observed no evidence that either FAox (Figure 4C) or lipogenesis (Figure 4D) was altered in the kidneys of Atf6α-/- mice, despite their extensive steatosis.
Figure 4. TM treatment does not alter renal FAox or lipogenic activity.
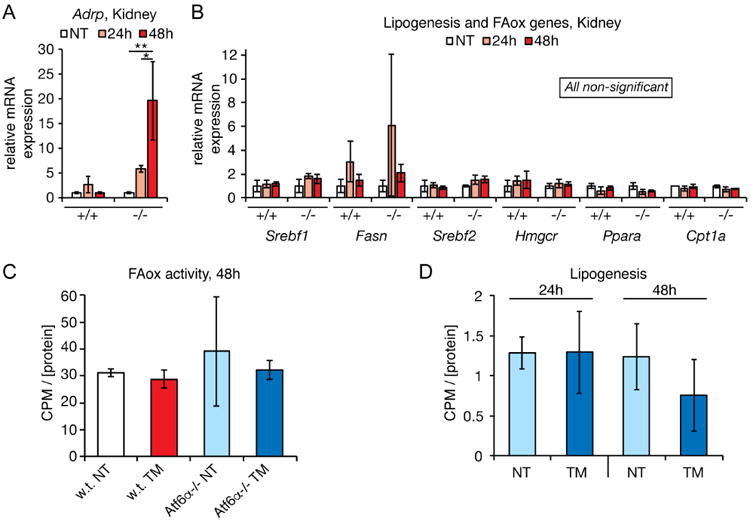
A. qRT-PCR was used to assess the relative mRNA expression of the gene encoding the lipid droplet marker protein ADRP in kidneys of wild-type or Atf6α-/- animals treated for 24 or 48h with TM.
B. Same as (A) except assessing expression of a representative sampling of metabolic genes regulating lipogenesis, cholesterologenesis, and FAox.
C. FAox activity was measured as in Figure 3E, except using kidney homogenates. No significant differences were seen. n=3
D. Lipogenic activity was measured in Atf6α-/- animals as in Figure 2E. No significant differences were seen. n=3
Lipid mobilization from adipose likely drives late hepatic and renal steatosis in Atf6α-/- animals
Lacking direct evidence for altered lipid catabolism or anabolism in renal steatosis, we utilized an untargeted lipidomic approach with the goal of identifying potential pathways of lipid metabolism that might be dysregulated in Atf6α-/- animals and could underlie the steatosis phenotype. We also reasoned that this approach could identify lipid species other than the neutral lipids that are detected by Oil Red O staining and ADRP immunostaining, in the event that the effects of ER stress on lipid metabolism in these animals extend to other pathways. To do this, we challenged wild-type or knockout animals with TM for 48 hours, extracted lipids from kidney homogenates, and analyzed them by liquid chromatography-mass spectrometry (LC-MS) in both positive and negative modes (i.e., for the separation of anions or cations generated by electrospray ionization, with each mode preferentially detecting different classes of lipids). Resultant data were then processed using XCMS software to categorize and putatively identify altered lipid species.
Cloud plots of this analysis are shown in Figure 5, and putative lipid identifications are listed in Table 1. Consistent with the observation that wild-type animals accumulated very little renal fat upon TM treatment, these animals displayed comparable numbers of lipid species that were enhanced (green circles) versus reduced (red circles) in the positive ion mode (Figure 5A). In contrast, in response to TM treatment Atf6α-/- animals displayed enhanced abundance of a wide spectrum of lipid species, with particular enrichment for triglycerides and ceramides (Figure 5B, Table 1). The accumulation of triglycerides is consistent with enhanced lipid storage, but shed little light on the source of those lipids, since lipid accumulation in this case was best explained by small accumulations of many diverse lipid species, rather than unique accumulation of one or a few such species. The accumulation of ceramides was accompanied by upregulation of Sptlc1, which encodes the rate-limiting enzyme in ceramide synthesis, and also by enhanced TUNEL staining indicative of cell death, known to be associated with elevated ceramides (Mather and Siskind, 2011; Ueda, 2015) (Figure S1). This finding suggests that ceramide synthesis is actively regulated by prolonged ER stress in the kidney—a finding which awaits mechanistic investigation.
Figure 5. TM treatment leads to quantifiable lipid accumulation in the kidneys of Atf6α-/-but not wild-type animals.
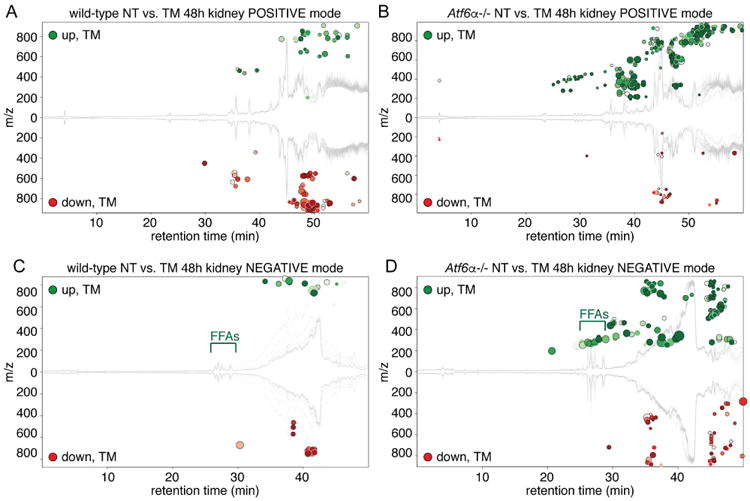
LC-MS in both positive and negative ion modes was used to profile the lipid distribution upon TM challenge in wild-type and Atf6α-/- animals. (A) and (B) show positive mode and (C) and (D) show negative mode. The response in wild-type animals is shown in (A) and (C), while the response in Atf6α-/- animals is shown in (B) and (D). XCMS software was used to generate cloud plots to provide a global view of species that were significantly different between groups. The x-axis shows retention time while the y-axis shows the mass-to-charge ratio, with species upregulated by TM shown in green above the midline and downregulated species shown in red below. The species shown are all those with a maximum intensity above 5,000 (i.e., to filter for reasonably abundant species) and an FDR-adjusted p-value below 0.01. Darker circles have lower (i.e., more significant) p-values, and the radius of each feature is proportional to the fold-change. Positon of FFAs is indicated. n=4. See also Figure S1.
Table 1. Putative lipid identifications from LC-MS analysis of the kidney.
| Regulated by TM in the kidney, wild-type animals, POSITIVE mode | |||||
| Putative ID | Fold | p-value | Level | m/z | Retention time |
| PC (38:3) | -2.3 | 0.0013 | 36410 | 812.62 | 46.3 |
| PE (P-40:5) | 3.2 | 0.0065 | 7578 | 778.57 | 46.5 |
| 54:8 TG | -1.6 | 0.0084 | 25736 | 892.75 | 51.7 |
| 48:3 TG | -1.6 | 0.0043 | 50195 | 818.73 | 52.4 |
| 50:4 TG | -3.5 | 0.0000 | 71882 | 844.74 | 52.9 |
| PC (P-38:6) | 2.0 | 0.0034 | 5092 | 790.57 | 56.1 |
| TG (48:0) | -1.5 | 0.0068 | 20852 | 824.78 | 58.3 |
| Regulated by TM in the kidney, Atf6α-/- animals, POSITIVE mode | |||||
| Putative ID | Fold | p-value | Level | m/z | Retention time |
| Linoleyl carnitine | 2.1 | 0.0002 | 13944 | 424.34 | 29.0 |
| Palmitoyl carnitine | 1.6 | 0.0013 | 16189 | 400.34 | 29.7 |
| Lyso-PAF C-16 | 3.0 | 0.0065 | 6483 | 482.36 | 36.8 |
| PC (32:2) | 4.5 | 0.0027 | 38593 | 730.54 | 44.3 |
| PA (42:4) | 2.8 | 0.0020 | 20999 | 781.56 | 44.3 |
| PC (32:1) | 2.1 | 0.0046 | 154864 | 732.56 | 45.0 |
| PC (32:0) | 2.1 | 0.0051 | 18978 | 734.56 | 45.0 |
| PE (38:3) | 2.2 | 0.0024 | 7374 | 770.58 | 45.1 |
| PS (36:0) | -2.1 | 0.0058 | 22716 | 809.59 | 45.5 |
| PS (38:1) | -1.7 | 0.0093 | 15486 | 835.61 | 46.0 |
| PA (P-42:0) | 1.7 | 0.0067 | 14692 | 773.65 | 46.8 |
| CerP(d44:2) | 2.3 | 0.0070 | 5808 | 801.68 | 46.9 |
| GalCer(d40:2) | 1.9 | 0.0036 | 30998 | 799.67 | 46.9 |
| Behenyl linolenate | 2.2 | 0.0008 | 13605 | 604.60 | 47.6 |
| TG (52:6) | 3.8 | 0.0092 | 45386 | 868.74 | 52.3 |
| TG (54:8) | 9.4 | 0.0010 | 21330 | 892.75 | 52.6 |
| TG (58:9) | 7.2 | 0.0054 | 6584 | 946.79 | 53.4 |
| TG (58:8) | 3.1 | 0.0095 | 6079 | 948.81 | 54.7 |
| TG (54:6) | 2.3 | 0.0051 | 15588 | 896.78 | 56.1 |
| TG (56:6) | 3.8 | 0.0007 | 16561 | 924.81 | 56.2 |
| TG (56:7) | 4.9 | 0.0038 | 24642 | 922.79 | 56.2 |
| Regulated by TM in the kidney, wild-type animals, NEGATIVE mode | |||||
| Putative ID | Fold | p-value | Level | m/z | Retention time |
| None identified | |||||
| Regulated by TM in the kidney, Atf6α-/- animals, NEGATIVE mode | |||||
| Putative ID | Fold | p-value | Level | m/z | Retention time |
| C16:2 Fatty acid | 11.7 | 0.0081 | 6994 | 251.20 | 24.5 |
| C18:3 Fatty acid | 7.7 | 0.0081 | 9365 | 277.22 | 25.3 |
| C16:1 Fatty acid | 9.9 | 0.0073 | 23028 | 253.22 | 25.4 |
| C18:2 Fatty acid | 8.7 | 0.0042 | 159391 | 279.23 | 26.2 |
| C18:0 Fatty acid | 2.1 | 0.0058 | 6731 | 283.24 | 26.6 |
| C16:0 Fatty acid | 2.2 | 0.0059 | 159497 | 255.23 | 26.7 |
| C18:1 Fatty acid | 7.9 | 0.0024 | 140480 | 281.25 | 27.3 |
| C20:1 Fatty acid | 9.8 | 0.0041 | 8325 | 309.28 | 28.9 |
| Cer(d34:2) | 3.2 | 0.0003 | 31934 | 534.49 | 45.0 |
| Cer(d34:1) | 2.5 | 0.0002 | 50804 | 536.50 | 45.6 |
| Cer(d40:2) | 2.5 | 0.0053 | 21262 | 618.58 | 47.2 |
| Bold: upregulated by TM | |||||
Analysis in negative ion mode immediately suggested a potential pathway to lipid accumulation. Very few lipid species detected in this mode were changed by TM in wild-type animals (and of these, none could be putatively identified) (Figure 5C, Table 1). However, Atf6α-/- animals evinced a substantial accumulation of free fatty acids (FFAs) (Figure 5D, Table 1). As FFAs are not the preferred form of cellular lipid storage, and can in fact be lipotoxic (Neuschwander-Tetri, 2010), this finding suggested that the production (by lipogenesis or hepatic lipolysis) or import of FFAs outpaced the capacity of the kidneys to esterify them.
In order to confirm this accumulation of FFAs, the absolute concentrations of stearic, palmitic, oleic, and linoleic acids were quantified by comparison to standards. This analysis showed a significant accumulation of palmitic acid and even greater accumulations of oleic and linoleic acids (Figure 6A). The apparent preference for accumulation of unsaturated FAs might account for the similar accumulation of triglycerides with unsaturated FA chains (Table 1). These findings raised the possibility that accumulation of FFAs might also contribute to liver steatosis in Atf6α-/- animals. Indeed, 48 hours after TM treatment, there was a dramatic increase in FFAs in Atf6α-/- animals, to the point that these were among the most abundant negative-mode lipids in the liver (Figure 6B). In contrast, there was no significant difference in FFAs in the livers of these animals 24 hours after treatment (not shown), indicating that FFA accumulation is a late event.
Figure 6. TM treatment increases renal and hepatic FFA levels preferentially in Atf6α-/-animals.
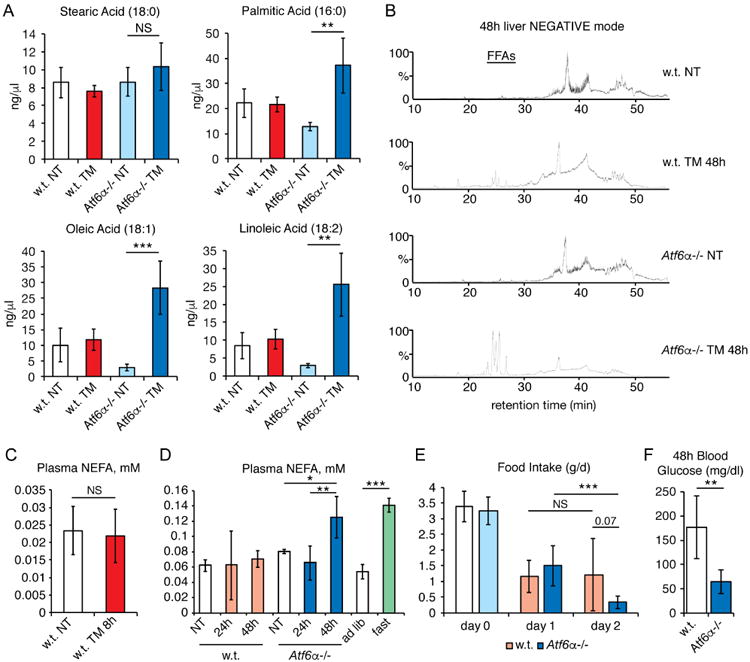
A. Renal levels of stearic, palmitic, oleic, and linoleic acids were quantified from LC runs of extracted lipids following 48h of TM treatment in wild-type or Atf6α-/- animals. n=4
B. Total ion chromatograms are shown from LC runs of hepatic lipids following 48h of TM treatment in wild-type or Atf6α-/- animals. Retention time of FFAs is indicated. Each chromatogram shows a single representative animal.
C. Non-esterified fatty acids (NEFAs) were measured from plasma of wild-type animals fasted for 24h and treated for 8h with TM or vehicle. n=8-9
D. NEFAs were measured from plasma of wild-type or Atf6α-/- animals treated for 24 or48h with TM. As a comparison, wild-type animals were also fed ad libitum or fasted for24h. n=3-6
E. Wild-type or Atf6α-/- animals were habituated to metabolic cages, and food intake was measured either for the day preceding TM treatment (day 0) or for the periods 0-24h (day 1) or 24-48h (day 2) thereafter. Statistical significance comparing day 1 to day 2 measurements was calculated using paired t-tests, while significance comparing wild-type to Atf6α-/- animals on day 2 used one-way ANOVA. n=6-7
F. Plasma glucose levels were measured 48h after TM challenge in animals from (E).See also Figure S2.
The late accumulation of FFAs in both the liver and kidneys of Atf6α-/- animals, as well as absence of evidence for altered renal lipid anabolism or catabolism in these animals, led us to consider the possibility that this process is driven by lipolysis from adipose tissue. At early times after challenge, TM did not elicit a change in plasma levels of non-esterified fatty acids (NEFAs) (Figure 6C). In wild-type animals, this remained the case through later times (Figure 6D). However, Atf6α-/- animals showed elevated plasma NEFA levels 48 hours after challenge, to an extent comparable to that elicited by prolonged fasting in wild-type animals (Figure 6D).
These results led us to suspect that unmitigated ER stress might suppress food consumption and drive fasting-induced lipolysis. Analysis of animals housed in metabolic cages supported this hypothesis: TM treatment significantly reduced food intake in both wild-type and Atf6α-/- animals, and this reduction was exacerbated by 48 hours selectively in Atf6α-/- animals (Figure 6E). Consistent with this finding, by 48 hours Atf6α-/- mice were severely hypoglycemic (Figure 6F). That this hypoglycemia was likely due to anorexia and not to hyperinsulinemia from stress-dependent pancreatic beta cell proliferation (Sharma et al., 2015) was supported by the observation that Atf6α-/- mice did not become hyperinsulinemic during TM treatment (Figure S2B), and if anything tend toward hyperglycemia rather than hypoglycemia under unchallenged conditions (Figure S2C). It is also unlikely that lipolysis was driven by direct effects of TM on adipose, as we found no evidence that TM elicited ER stress in either subcutaneous or visceral white adipose deposits (Figure S2D). These data point to anorexia-induced lipolysis as a potentially significant contributor to the late accumulation of FFAs in both the liver and kidneys of Atf6α-/- mice.
Discussion
Our results suggest that ER stress has both cell-autonomous and cell non-autonomous effects on peripheral lipid metabolism, with several pathways contributing to accumulation of lipid in the liver and kidneys. In the liver, ER stress elicited the relatively rapid (within 8 hours) inhibition of FAox. While this inhibition was alleviated in wild-type animals, it persisted and was possibly exacerbated in Atf6α-/- animals. This persistence corresponded with the ongoing ER stress burden—owing to an inability to effectively harness the UPR to alleviate the stress (Wu et al., 2007; Yamamoto et al., 2007)—and with the profound suppression of FAox genes in these animals. Thus, we conclude that the inhibition of FAox likely contributes to stress-induced hepatic steatosis. This contribution would be in addition to the already-described inhibition of VLDL secretion that would be expected to impair efflux of triglyceride. This effect appears also to be liver-specific, as we found no evidence for either genetic or biochemical inhibition of FAox in the kidney (Figure 4). We have previously shown that inhibition of FAox protects ER function by enhancing the oxidative potential of the ER, which must generate disulfide bonds on nascent proteins (Tyra et al., 2012). It is tempting to speculate that the direct regulation of FAox represents an underappreciated mechanism by which the UPR protects ER homeostasis.
While lipogenesis has been proposed to contribute to ER stress-induced hepatic steatosis based on studies in cultured hepatocytes (Lee et al., 2012), we found little evidence here that it is a significant contributor in vivo, at least at early times. There is perhaps an increase in lipogenic activity at later time points selectively in Atf6α-/- animals, although this observation is difficult to reconcile with the substantial suppression of both Srebf genes, and of those encoding the key enzymes of lipogenesis. Thus, its potential role remains ambiguous. In the kidney, there was no evidence that lipogenesis contributed to fat accumulation, although we note that a previous report suggested that ER stress causes renal lipid accumulation through an SREBP2-dependent mechanism (Lhotak et al., 2012). SREBP2 drives cholesterologenesis (Sato, 2010), and although Hmgcr (encoding the rate-limiting step in cholesterol biosynthesis) was not elevated by TM treatment, the lipogenesis assay used here does not extract cholesterol, making it still possible that SREBP2-dependent cholesterologenesis contributes to renal steatosis.
The other major contributor to both hepatic and renal steatosis appears to be anorexia-induced lipolysis. Indeed, the dramatic increase in both hepatic and renal FFAs at 48 hours was the most unexpected finding of the lipidomic analysis. The evidence that Atf6α-/- animals preferentially showed reduced food intake, hypoglycemia, and elevated plasma NEFA levels supports the idea that late lipid accumulation arises cell non-autonomously as a consequence of anorexia, particularly in the kidney. These elevated FFAs are presumably taken up by both organs, and some of it (though clearly not all) is esterified into triglyceride. However, we note that the rate of fatty acid uptake into the liver and kidney was not measured, since this measurement in vivo is complicated by both the instability and the rapid oxidation of labeled FFA probes (Henkin et al., 2012). A survey of the expression of fatty acid transport genes in liver and kidney revealed some that were suppressed by stress and others that were unaffected (data not shown), technically leaving open the question of whether the elevated levels of FFAs seen here in fact lead to increased renal and hepatic FFA levels. In any case, it will be interesting to determine whether the observed starvation and resultant lipolysis occurs merely as a result of Atf6α-/- animals experiencing severe illness due to kidney and/or liver dysfunction, or whether instead there are effects of TM administration on tissues other than the liver and kidney in these animals that drive lipolysis. For instance, it is also possible that lipolysis is driven by the effects of ATF6α deletion in white adipose, although the fact that we did not find evidence of TM-induced ER stress in the adipose (Figure S2D) makes this possibility somewhat unlikely.
Ultimately, the reason that Atf6α-/- animals eventually succumb to TM challenge (Wu et al., 2007), while wild-type animals do not, remains unclear. Given that Atf6α-/- animals show evidence of cell death in the kidney (Figure S1B), one possibility is that unmitigated ER stress in the Atf6α-/- kidney damages the organ beyond repair through extensive apoptosis and/or necrosis. Indeed, one of the other notable features of our lipidomic analysis was the elevation of several species putatively identified as ceramides (Table 1), which are known mediators of cell death pathways and serve as biomarkers for renal injury (Mather and Siskind, 2011; Ueda, 2015). We also favor the kidney as the most probable primary site of TM-induced anorexia in Atf6α-/- mice in part because the liver—the other organ most clearly targeted by TM—while clearly adversely affected by ER stress in these animals—is so resilient to lipid accumulation and cell loss (Forbes and Newsome, 2016). In sum, the data here are most consistent with a model where ER stress in the liver directly regulates lipid metabolism in the organ, while unmitigated ER stress in the kidney and/or liver drives lipolysis from the white adipose to further dysregulate metabolism in these organs. If this is the case, then it is possible that physiological ER stress localized in a given tissue can nonetheless drive lipid dysregulation in other sites not directly experiencing ER stress. Ultimately tissue-specific deletion of ATF6α will be needed to address the relative contributions of liver, kidney, and other organs to the extreme sensitivity of Atf6α-/- animals to TM, and to determine how the ER stress signaling network interacts with other regulators of metabolism such as CREBH (Zhang et al., 2012) and CRTC2 (Wang et al., 2009).
Although other stressors such as proteasome inhibition or secretory protein overexpression also lead to hepatic steatosis and similar changes in gene regulation at least in the liver—making it unlikely that the effects seen here are specific to TM per se—the agent is nonetheless probably a much harsher stimulus than those that lead to lipid dysregulation in vivo. Thus, moving forward it will be important to determine the extent to which more physiological ER stresses impinge upon lipid metabolism in the ways described here.
Experimental Procedures
Mice
Animals were housed in a pathogen-free facility under climate controlled conditions with a 12-hour light/dark cycle, and were maintained on standard rodent chow. All procedures were approved by the University of Iowa Institutional Animal Care and Use Committee. Atf6α-/- animals have been backcrossed into the C57BL/6J strain for >10 generations. Eight-to-10 week-old animals of both genders were injected intraperitoneally with 1 mg/kg TM (EMD) dissolved in DMSO and diluted in 150 mM dextrose or PBS, or an equivalent concentration of DMSO alone in dextrose or PBS (for all non-treated animals). At sacrifice, plasma was collected and liver and kidney tissues were harvested and either used fresh (for biochemical assays), fixed in formalin (for immunostaining), frozen in OCT (for Oil Red O staining), or flash frozen in liquid N2 (for molecular analysis and mass spectrometry). Tissue triglyceride measurement (Arensdorf et al., 2013a), immunostaining (Chikka et al., 2013), Oil Red O staining (Arensdorf et al., 2013a), and qRT-PCR (Rutkowski et al., 2006) were performed as described. For metabolic cage experiments, animals were habituated to cages for five days, and then treated with 1 mg/kg TM and monitored for a further 2 days.
Lipogenesis Assay
Lipogenesis assays were performed on fresh tissue homogenates, modifying a protocol described in (Harada et al., 2007). Briefly, liver was placed on ice, and 60 mg was macerated into small pieces and added to 2 ml of DMEM which had been aerated in 5% CO2/95% O2 for 20 minutes. 6 μCi of [1-14C] sodium acetate was added, and samples were incubated for 90 minutes at 37 °C in 5% CO2/95% O2. The tissue was removed, dabbed with an absorbent wipe, and added to 300 μl of 30% w/v KOH, heated to 70 °C with agitation for 10 minutes, and then 300 μl of 100% ethanol was added prior to continued incubation at 70 °C with agitation for 2 hours. At this point, protein concentration was measured from an aliquot, while the remainder of the sample was chilled on ice, then acidified with 300 μl of 9M H2SO4. Lipids were extracted three times with 500 μl of light petroleum (bp 40-60 °C). The petroleum fractions were combined and washed three times with deionized water. They were then evaporated to dryness under nitrogen gas, then dissolved in scintillation fluid for 14C quantification. For 8h TM treatment, animals were also treated with 2U of human insulin intraperitoneally to ensure that conditions favored lipogenesis activity.
Fatty Acid Oxidation Assays
FAox assays were performed on fresh tissue generally as described (Hirschey and Verdin, 2010), in animals fasted for 24h to ensure that conditions favored FAox activity. Briefly, 150 mg of tissue was added to 1 ml of ice cold STE Buffer (0.25 M sucrose, 10 mM Tris (pH 7.4), 1 mM EDTA) and the tissue was homogenized in a dounce homogenizer. The homogenate was centrifuged at 4 °C for 10 minutes at 420 × g. A portion of the supernatant was reserved to determine protein concentration. 20 μl of the supernatant was added to 355 μl of reaction mixture (100 mM sucrose, 10 mM Tris (pH 7.4), 5 mM KH2PO4, 0.2 mM EDTA, 0.3% FFA-free BSA, 80 mM KCl, 2 mM L-carnitine, 0.1 mM malic acid, 0.05 mM coenzyme A, 1 mM MgCl2, with 1 mM DTT and 2 mM ATP added fresh). Then 25 μl of a mixture containing 0.1 mM palmitic acid, 7.5% fatty acid-free BSA, and 4 mCi of [1-14C] palmitic acid was added, and the reaction was incubated with agitation at 37 °C for 60 minutes. Following incubation, the samples were transferred to new tubes containing 200 μl of 1 M perchloric acid fitted in the lid with Whatmann 3mm filter paper soaked in 1M NaOH. Samples were capped immediately and incubated at room temperature for 1 hour, and then the filter paper discs were removed and transferred to scintillation fluid for 14C quantification. Etomoxir (ET) was from Sigma. To measure plasma β-hydroxybutyrate, the Ketone Body Assay Kit (Cayman Chemical) was used.
For FAox in isolated mitochondria, mitochondria were isolated from ∼150mg of fresh liver tissue using differential centrifugation as previously described (Gray et al., 2016).14C palmitate oxidation was measured as previously described (Sheldon et al., 2015){Sheldon, 2015 #5;Sheldon, 2015 #1367;Sheldon, 2015 #1367}. In brief, mitochondria were placed in an airtight well with reaction media containing 20 μM palmitate conjugated to BSA. After 1 hour, 70% perchloric acid was injected into well to liberate 14CO2, which was trapped in a microcentrifuge tube containing 1N NaOH. 14CO2 containing NaOH and 14C acid soluble metabolites (ASM) were quantified via liquid scintillation counting. Media specific activity and blank samples (no mitochondria) were used to convert raw dpm counts to μmol/g protein/hr.
Mass Spectrometry
For mass spectrometry analysis, frozen liver pieces were pulverized using a metal cup and mallet. 100 mg of frozen liver powder was added to 2 ml of a 2:1 chloroform:methanol mixture in a 5 ml glass flat-bottom tube with a Teflon cap liner. Heptadecanoic acid was spiked into the sample at 0.5 ng/μl as an internal standard. The sample was sonicated on ice with a probe sonicator for 60 seconds, and then 1 ml of H2O was added, the sample was vortexed for 30 seconds, incubated on ice for 30 minutes, and revortexed. Following centrifugation for 15 minutes at 200 × g at 4 °C, the bottom layer was removed, transferred to a new tube, dried under a stream of nitrogen gas, and resuspended in 200 μl of 2:1 chloroform:methanol.
The samples were analyzed by LC-MS using a Waters Q-TOF Premier mass spectrometer interfaced with an Acquity UPLC system. Electrospray ionization was used and data collected in both positive and negative ion modes using Leucine Enkephalin as the lock mass. The MS conditions were as follows for both positive and negative ESI: capillary voltage 2.8 KV, sampling cone voltage 35 V, source temperature 110 °C, desolvation gas temperature 400 °C, cone ga s flow 30 L/hr, and desolvation gas flow 750 L/hr. Data were collected over the mass range 130 to 1000 Da. The chromatographic separation was done using a Phenomenex Gemini C18 column (4.6 × 50 mm, 5 μm). The mobile phase was 95:5 Water/Methanol (v/v) in Solvent A and 65:35:5 Isopropanol/Methanol/Water (v/v/v). Depending on whether positive or negative ESI was being used either 0.1% Formic Acid or Ammonium Hydroxide was added to both solvents, respectively. The gradient initially held for 5 minutes at 100% A at a flow rate of 100 μL/min. At 5.1 minutes, flow rate increased to 400 μL/min. Over the next 40 minutes, gradient increased to 100% B at which point the flow rate was increased to 500 μL/min. The system was held at 100% B for 18 minutes and then re-equilibrated back to 100% A over 7 minutes. Injection volume was 15 μL for all samples. The column was held at 25 °C throughout t he run.
LC-MS data acquisition and analysis were performed by using Waters MassLynx software. The quantification of the fatty acids was performed utilizing QuanLynx software package using standard curves for oleic, linoleic, palmitic, and stearic acids. Otherwise the data files were converted to NetCDF format using DataBridge conversion software for further processing in XCMS. CDF files were uploaded to the XCMS website (xcmsonline.scripps.edu) to create individual datasets. The datasets were then compared using pairwise analysis with the UPLC/Q-TOF parameter. The results table was filtered using the following parameters: FDR-adjusted p-value less than or equal to 0.01, fold greater than or equal to 1.5, max intensity greater than or equal to 5000. These same parameters were applied to generate the red/green cloud plots. The mass-to-charge ratio from the species that fit the parameters was entered into the Lipid Maps online website search tool for the LIPID MAPS Structure Database (www.lipidmaps.org/tools/ms/LMSD_search-mass-options.php) and Metlin with the following parameters: [M+NH4]+ and [M+H]+(for positive run), [M-H]- (for negative run), Mass Tolerance of 0.1. The top hit was chosen for the lipid ID, after adjustment for the most plausible adducts given the LC conditions. For triglycerides, the top hit that had all even chain carbons was chosen for the ID. Data are deposited in the Metabolights database (http://www.ebi.ac.uk/metabolights/).
Statistics
Throughout the paper, error bars represent means +/- SDM. Unless indicated otherwise, significance was calculated by one-way ANOVA with Tukey's post-hoc where appropriate. Symbols to denote significance are as follows: ***, p<0.001; **, p<0.01; *, p<0.05. For all animal experiments, the “n” number represents the number of individual animals per group.
Supplementary Material
Highlights.
ER stress directly targets the liver and kidneys, and both organs accumulate lipid
Inhibition of fatty acid oxidation contributes to hepatic steatosis
Animals that cannot mitigate ER stress become anorexic
Lipolysis exacerbates steatosis in the liver and kidney of sensitive animals
Acknowledgments
We thank A. Norris (University of Iowa Department of Pediatrics) for assistance with FAox assays and R. McCabe for assistance with mass spectrometry data processing. Funding sources were as follows: To D.T.R., National Institutes of Health (NIH) grant GM115424 and funds from the University of Iowa Department of Anatomy and Cell Biology, the Carver College of Medicine, and the Office of the Vice President for Research (OVPR). To D. D-M., American Heart Association (AHA) training grant 14POST20420015. To R.D.S., NIH training grant HL07734. To E.B.T., NIH Grant DK104998 and University of Iowa Healthcare Research Investment Pilot Grant. To L.M.T., funds from the OVPR. To K.R., NIH grant HL084207, AHA grant 14EIA18860041, and funds from the University of Iowa Fraternal Order of Eagles Diabets Research Center. To R.J.K., NIH grants DK042394, DK103185, DK110973, and CA198103. For M.P.G., the Novo Nordisk Foundation Center for Basic Metabolic Research is an independent research center at the University of Copenhagen, partially funded by an unrestricted donation form the Novo Nordisk Foundation (www.metabol.ku.dk).
Footnotes
Author Contributions: All authors read, edited, and approved the manuscript. D.D-M. and D.T.R. conceived and designed the experiments, analyzed the data, and wrote the paper. D.D-M. performed most of the experiments prior to review, and E.R.G. performed or assisted on experiments for revision. R.D.S. performed mitochdondria FAox experiments. D.G. performed metabolic cage experiments. R.J.K. provided Atf6α-/- mice. E.B.T., K.R. M.P.G., and L.M.T contributed to data analysis. M.C.G., M.P.G. and L.M.T. contributed to mass spectrometry experiments and data analysis.
Publisher's Disclaimer: This is a PDF file of an unedited manuscript that has been accepted for publication. As a service to our customers we are providing this early version of the manuscript. The manuscript will undergo copyediting, typesetting, and review of the resulting proof before it is published in its final citable form. Please note that during the production process errors may be discovered which could affect the content, and all legal disclaimers that apply to the journal pertain.
References
- Adachi Y, Yamamoto K, Okada T, Yoshida H, Harada A, Mori K. ATF6 Is a transcription factor specializing in the regulation of quality control proteins in the endoplasmic reticulum. Cell Struct Funct. 2008;33:75–89. doi: 10.1247/csf.07044. [DOI] [PubMed] [Google Scholar]
- Arensdorf AM, Dezwaan McCabe D, Kaufman RJ, Rutkowski DT. Temporal clustering of gene expression links the metabolic transcription factor HNF4alpha to the ER stress-dependent gene regulatory network. Front Genet. 2013a;4:188. doi: 10.3389/fgene.2013.00188. [DOI] [PMC free article] [PubMed] [Google Scholar]
- Arensdorf AM, Diedrichs D, Rutkowski DT. Regulation of the transcriptome by ER stress: non-canonical mechanisms and physiological consequences. Front Genet. 2013b;4:256. doi: 10.3389/fgene.2013.00256. [DOI] [PMC free article] [PubMed] [Google Scholar]
- Azuma Y, Hagiwara D, Lu W, Morishita Y, Suga H, Goto M, Banno R, Sugimura Y, Oyadomari S, Mori K, et al. Activating transcription factor 6alpha is required for the vasopressin neuron system to maintain water balance under dehydration in male mice. Endocrinology. 2014;155:4905–4914. doi: 10.1210/en.2014-1522. [DOI] [PubMed] [Google Scholar]
- Cao SS, Zimmermann EM, Chuang BM, Song B, Nwokoye A, Wilkinson JE, Eaton KA, Kaufman RJ. The Unfolded Protein Response and Chemical Chaperones Reduce Protein Misfolding and Colitis in Mice. Gastroenterology. 2013;144:989–1000. doi: 10.1053/j.gastro.2013.01.023. [DOI] [PMC free article] [PubMed] [Google Scholar]
- Chan SW. Unfolded protein response in hepatitis C virus infection. Front Microbiol. 2014;5:233. doi: 10.3389/fmicb.2014.00233. [DOI] [PMC free article] [PubMed] [Google Scholar]
- Chikka MR, McCabe DD, Tyra HM, Rutkowski DT. C/EBP homologous protein (CHOP) contributes to suppression of metabolic genes during endoplasmic reticulum stress in the liver. J Biol Chem. 2013;288:4405–4415. doi: 10.1074/jbc.M112.432344. [DOI] [PMC free article] [PubMed] [Google Scholar]
- Colgan SM, Tang D, Werstuck GH, Austin RC. Endoplasmic reticulum stress causes the activation of sterol regulatory element binding protein-2. Int J Biochem Cell Biol. 2007;39:1843–1851. doi: 10.1016/j.biocel.2007.05.002. [DOI] [PubMed] [Google Scholar]
- Egawa N, Yamamoto K, Inoue H, Hikawa R, Nishi K, Mori K, Takahashi R. The endoplasmic reticulum stress sensor, ATF6alpha, protects against neurotoxin-induced dopaminergic neuronal death. J Biol Chem. 2011;286:7947–7957. doi: 10.1074/jbc.M110.156430. [DOI] [PMC free article] [PubMed] [Google Scholar]
- Forbes SJ, Newsome PN. Liver regeneration - mechanisms and models to clinical application. Nat Rev Gastroenterol Hepatol. 2016;13:473–485. doi: 10.1038/nrgastro.2016.97. [DOI] [PubMed] [Google Scholar]
- Gibbons GF, Wiggins D, Brown AM, Hebbachi AM. Synthesis and function of hepatic very-low-density lipoprotein. Biochem Soc Trans. 2004;32:59–64. doi: 10.1042/bst0320059. [DOI] [PubMed] [Google Scholar]
- Gomez JA, Tyra HM, DeZwaan-McCabe D, Olivier AK, Rutkowski DT. Synthetic embryonic lethality upon deletion of the ER cochaperone p58(IPK) and the ER stress sensor ATF6alpha. Biochem Biophys Res Commun. 2014;443:115–119. doi: 10.1016/j.bbrc.2013.11.060. [DOI] [PMC free article] [PubMed] [Google Scholar]
- Gray LR, Rauckhorst AJ, Taylor EB. A Method for Multiplexed Measurement of Mitochondrial Pyruvate Carrier Activity. J Biol Chem. 2016;291:7409–7417. doi: 10.1074/jbc.M115.711663. [DOI] [PMC free article] [PubMed] [Google Scholar]
- Harada N, Oda Z, Hara Y, Fujinami K, Okawa M, Ohbuchi K, Yonemoto M, Ikeda Y, Ohwaki K, Aragane K, et al. Hepatic de novo lipogenesis is present in liver-specific ACC1-deficient mice. Mol Cell Biol. 2007;27:1881–1888. doi: 10.1128/MCB.01122-06. [DOI] [PMC free article] [PubMed] [Google Scholar]
- Harding HP, Zeng H, Zhang Y, Jungries R, Chung P, Plesken H, Sabatini DD, Ron D. Diabetes mellitus and exocrine pancreatic dysfunction in perk-/- mice reveals a role for translational control in secretory cell survival. Mol Cell. 2001;7:1153–1163. doi: 10.1016/s1097-2765(01)00264-7. [DOI] [PubMed] [Google Scholar]
- Henkin AH, Cohen AS, Dubikovskaya EA, Park HM, Nikitin GF, Auzias MG, Kazantzis M, Bertozzi CR, Stahl A. Real-time noninvasive imaging of fatty acid uptake in vivo. ACS Chem Biol. 2012;7:1884–1891. doi: 10.1021/cb300194b. [DOI] [PMC free article] [PubMed] [Google Scholar]
- Herrema H, Zhou Y, Zhang D, Lee J, Salazar Hernandez MA, Shulman GI, Ozcan U. XBP1s Is an Anti-lipogenic Protein. J Biol Chem. 2016;291:17394–17404. doi: 10.1074/jbc.M116.728949. [DOI] [PMC free article] [PubMed] [Google Scholar]
- Hirschey MD, Shimazu T, Jing E, Grueter CA, Collins AM, Aouizerat B, Stancakova A, Goetzman E, Lam MM, Schwer B, et al. SIRT3 deficiency and mitochondrial protein hyperacetylation accelerate the development of the metabolic syndrome. Mol Cell. 2011;44:177–190. doi: 10.1016/j.molcel.2011.07.019. [DOI] [PMC free article] [PubMed] [Google Scholar]
- Hirschey MD, Verdin E. Measuring fatty acid oxidation in tissue homogenates. Protocol Exchange. 2010 doi: 10.1038/nprot.2010.92. [DOI] [Google Scholar]
- Ji C. New Insights into the Pathogenesis of Alcohol-Induced ER Stress and Liver Diseases. Int J Hepatol. 2014;2014:513787. doi: 10.1155/2014/513787. [DOI] [PMC free article] [PubMed] [Google Scholar]
- Jones JG. Hepatic glucose and lipid metabolism. Diabetologia. 2016;59:1098–1103. doi: 10.1007/s00125-016-3940-5. [DOI] [PubMed] [Google Scholar]
- Lee JS, Mendez R, Heng HH, Yang ZQ, Zhang K. Pharmacological ER stress promotes hepatic lipogenesis and lipid droplet formation. Am J Transl Res. 2012;4:102–113. [PMC free article] [PubMed] [Google Scholar]
- Lhotak S, Sood S, Brimble E, Carlisle RE, Colgan SM, Mazzetti A, Dickhout JG, Ingram AJ, Austin RC. ER stress contributes to renal proximal tubule injury by increasing SREBP-2-mediated lipid accumulation and apoptotic cell death. Am J Physiol Renal Physiol. 2012;303:F266–278. doi: 10.1152/ajprenal.00482.2011. [DOI] [PubMed] [Google Scholar]
- Mather AR, Siskind LJ. Glycosphingolipids and kidney disease. Adv Exp Med Biol. 2011;721:121–138. doi: 10.1007/978-1-4614-0650-1_8. [DOI] [PubMed] [Google Scholar]
- Neuschwander-Tetri BA. Nontriglyceride hepatic lipotoxicity: the new paradigm for the pathogenesis of NASH. Curr Gastroenterol Rep. 2010;12:49–56. doi: 10.1007/s11894-009-0083-6. [DOI] [PubMed] [Google Scholar]
- Ota T, Gayet C, Ginsberg HN. Inhibition of apolipoprotein B100 secretion by lipid-induced hepatic endoplasmic reticulum stress in rodents. J Clin Invest. 2008;118:316–332. doi: 10.1172/JCI32752. [DOI] [PMC free article] [PubMed] [Google Scholar]
- Özcan U, Cao Q, Yilmaz E, Lee AH, Iwakoshi NN, Ozdelen E, Tuncman G, Gorgun C, Glimcher LH, Hotamisligil GS. Endoplasmic reticulum stress links obesity, insulin action, and type 2 diabetes. Science. 2004;306:457–461. doi: 10.1126/science.1103160. [DOI] [PubMed] [Google Scholar]
- Rui L. Energy metabolism in the liver. Compr Physiol. 2014;4:177–197. doi: 10.1002/cphy.c130024. [DOI] [PMC free article] [PubMed] [Google Scholar]
- Rutkowski DT, Arnold SM, Miller CN, Wu J, Li J, Gunnison KM, Mori K, Sadighi Akha AA, Raden D, Kaufman RJ. Adaptation to ER stress is mediated by differential stabilities of pro-survival and pro-apoptotic mRNAs and proteins. PLoS Biol. 2006;4:e374. doi: 10.1371/journal.pbio.0040374. [DOI] [PMC free article] [PubMed] [Google Scholar]
- Rutkowski DT, Wu J, Back SH, Callaghan MU, Ferris SP, Iqbal J, Clark R, Miao H, Hassler JR, Fornek J, et al. UPR pathways combine to prevent hepatic steatosis caused by ER stress-mediated suppression of transcriptional master regulators. Dev Cell. 2008;15:829–840. doi: 10.1016/j.devcel.2008.10.015. [DOI] [PMC free article] [PubMed] [Google Scholar]
- Sato R. Sterol metabolism and SREBP activation. Arch Biochem Biophys. 2010;501:177–181. doi: 10.1016/j.abb.2010.06.004. [DOI] [PubMed] [Google Scholar]
- Sharma RB, O'Donnell AC, Stamateris RE, Ha B, McCloskey KM, Reynolds PR, Arvan P, Alonso LC. Insulin demand regulates beta cell number via the unfolded protein response. J Clin Invest. 2015;125:3831–3846. doi: 10.1172/JCI79264. [DOI] [PMC free article] [PubMed] [Google Scholar]
- Sheldon RD, Padilla J, Jenkins NT, Laughlin MH, Rector RS. Chronic NOS inhibition accelerates NAFLD progression in an obese rat model. Am J Physiol Gastrointest Liver Physiol. 2015;308:G540–549. doi: 10.1152/ajpgi.00247.2014. [DOI] [PMC free article] [PubMed] [Google Scholar]
- Targett-Adams P, McElwee MJ, Ehrenborg E, Gustafsson MC, Palmer CN, McLauchlan J. A PPAR response element regulates transcription of the gene for human adipose differentiation-related protein. Biochim Biophys Acta. 2005;1728:95–104. doi: 10.1016/j.bbaexp.2005.01.017. [DOI] [PubMed] [Google Scholar]
- Tyra HM, Spitz DR, Rutkowski DT. Inhibition of fatty acid oxidation enhances oxidative protein folding and protects hepatocytes from endoplasmic reticulum stress. Mol Biol Cell. 2012;23:811–819. doi: 10.1091/mbc.E11-12-1011. [DOI] [PMC free article] [PubMed] [Google Scholar]
- Ueda N. Ceramide-induced apoptosis in renal tubular cells: a role of mitochondria and sphingosine-1-phoshate. Int J Mol Sci. 2015;16:5076–5124. doi: 10.3390/ijms16035076. [DOI] [PMC free article] [PubMed] [Google Scholar]
- Usui M, Yamaguchi S, Tanji Y, Tominaga R, Ishigaki Y, Fukumoto M, Katagiri H, Mori K, Oka Y, Ishihara H. Atf6alpha-null mice are glucose intolerant due to pancreatic beta-cell failure on a high-fat diet but partially resistant to diet-induced insulin resistance. Metabolism. 2012;61:1118–1128. doi: 10.1016/j.metabol.2012.01.004. [DOI] [PubMed] [Google Scholar]
- Walter P, Ron D. The unfolded protein response: from stress pathway to homeostatic regulation. Science. 2011;334:1081–1086. doi: 10.1126/science.1209038. [DOI] [PubMed] [Google Scholar]
- Wang M, Kaufman RJ. Protein misfolding in the endoplasmic reticulum as a conduit to human disease. Nature. 2016;529:326–335. doi: 10.1038/nature17041. [DOI] [PubMed] [Google Scholar]
- Wang S, Chen Z, Lam V, Han J, Hassler J, Finck BN, Davidson NO, Kaufman RJ. IRE1alpha-XBP1s Induces PDI Expression to Increase MTP Activity for Hepatic VLDL Assembly and Lipid Homeostasis. Cell Metab. 2012;16:473–486. doi: 10.1016/j.cmet.2012.09.003. [DOI] [PMC free article] [PubMed] [Google Scholar]
- Wang Y, Vera L, Fischer WH, Montminy M. The CREB coactivator CRTC2 links hepatic ER stress and fasting gluconeogenesis. Nature. 2009;460:534–537. doi: 10.1038/nature08111. [DOI] [PMC free article] [PubMed] [Google Scholar]
- Wu J, Ruas JL, Estall JL, Rasbach KA, Choi JH, Ye L, Bostrom P, Tyra HM, Crawford RW, Campbell KP, et al. The unfolded protein response mediates adaptation to exercise in skeletal muscle through a PGC-1alpha/ATF6alpha complex. Cell Metab. 2011;13:160–169. doi: 10.1016/j.cmet.2011.01.003. [DOI] [PMC free article] [PubMed] [Google Scholar]
- Wu J, Rutkowski DT, Dubois M, Swathirajan J, Saunders T, Wang J, Song B, Yau GD, Kaufman RJ. ATF6alpha optimizes long-term endoplasmic reticulum function to protect cells from chronic stress. Dev Cell. 2007;13:351–364. doi: 10.1016/j.devcel.2007.07.005. [DOI] [PubMed] [Google Scholar]
- Yamamoto K, Sato T, Matsui T, Sato M, Okada T, Yoshida H, Harada A, Mori K. Transcriptional induction of mammalian ER quality control proteins is mediated by single or combined action of ATF6alpha and XBP1. Dev Cell. 2007;13:365–376. doi: 10.1016/j.devcel.2007.07.018. [DOI] [PubMed] [Google Scholar]
- Yamamoto K, Takahara K, Oyadomari S, Okada T, Sato T, Harada A, Mori K. Induction of liver steatosis and lipid droplet formation in ATF6alpha-knockout mice burdened with pharmacological endoplasmic reticulum stress. Mol Biol Cell. 2010;21:2975–2986. doi: 10.1091/mbc.E09-02-0133. [DOI] [PMC free article] [PubMed] [Google Scholar]
- Yoshikawa A, Kamide T, Hashida K, Ta HM, Inahata Y, Takarada-Iemata M, Hattori T, Mori K, Takahashi R, Matsuyama T, et al. Deletion of Atf6alpha impairs astroglial activation and enhances neuronal death following brain ischemia in mice. J Neurochem. 2015;132:342–353. doi: 10.1111/jnc.12981. [DOI] [PubMed] [Google Scholar]
- Zhang C, Wang G, Zheng Z, Maddipati KR, Zhang X, Dyson G, Williams P, Duncan SA, Kaufman RJ, Zhang K. Endoplasmic reticulum-tethered transcription factor cAMP responsive element-binding protein, hepatocyte specific, regulates hepatic lipogenesis, fatty acid oxidation, and lipolysis upon metabolic stress in mice. Hepatology. 2012;55:1070–1082. doi: 10.1002/hep.24783. [DOI] [PMC free article] [PubMed] [Google Scholar]
- Zhang K, Wang S, Malhotra J, Hassler JR, Back SH, Wang G, Chang L, Xu W, Miao H, Leonardi R, et al. The unfolded protein response transducer IRE1alpha prevents ER stress-induced hepatic steatosis. EMBO J. 2011;30:1357–1375. doi: 10.1038/emboj.2011.52. [DOI] [PMC free article] [PubMed] [Google Scholar]
Associated Data
This section collects any data citations, data availability statements, or supplementary materials included in this article.