

Abstract
Background
Studies suggest that the recall-based humoral immune responses to influenza A/H1N1 originates from activated memory B cells. The aim of this study was to identify baseline, early and late blood transcriptional signatures (in peripheral blood mononuclear cells/PBMCs) associated with memory B cell response following influenza vaccination.
Methods
We used pre- and post-vaccination mRNA-Seq transcriptional profiling on samples from 159 subjects (50–74 years old) following receipt of seasonal trivalent influenza vaccine containing the A/California/7/2009/H1N1-like virus, and penalized regression modeling to identify associations with influenza A/H1N1-specific memory B cell ELISPOT response after vaccination.
Results
Genesets and genes (p-value range 7.92E-08 to 0.00018, q-value range 0.00019 to 0.039) demonstrating significant associations (of gene expression levels) with memory B cell response suggest the importance of metabolic (cholesterol and lipid metabolism-related), cell migration/adhesion, MAP kinase, NF-kB cell signaling (chemokine/cytokine signaling) and transcriptional regulation gene signatures in the development of memory B cell response after influenza vaccination.
Conclusion
Through an unbiased transcriptome-wide profiling approach, our study identified signatures of memory B cell response following influenza vaccination, highlighting the underappreciated role of metabolic changes (among the other immune function-related events) in the regulation of influenza vaccine-induced immune memory.
Keywords: Influenza, Human, Influenza Vaccines, Vaccination, Influenza A Virus, H1N1 Subtype, Enzyme-Linked Immunospot Assay, Sequence Analysis, RNA, Gene ExpressionB-Lymphocytes, Aging, Immunity, Humoral, Immunity
Introduction
Influenza and influenza-related complications pose a major health risk for vulnerable populations, such as the elderly. Despite an increasing annual influenza vaccine coverage rate, influenza-related morbidity and mortality increase with age. This is primarily due to poor immune response to influenza vaccine and increased susceptibility to influenza infection among older persons [1–5].
Immunosenescence is a profound age-related dysregulation of the immune system, which leads to impaired immunity/protection following immunization, or significant morbidity and mortality from infection as a result of age-associated changes in both innate and adaptive immune system components [6, 7]. While individual factors are beginning to be elucidated, there is a lack of a comprehensive, systems-level understanding of how age affects adaptive immunity and immune memory due to vaccination, particularly in regard to influenza response [2, 8–13]. Several recent studies focused their efforts on identification of immune signatures and biomarkers associated with influenza-specific antibody (mostly hemagglutination-inhibition/HAI) titers as the currently accepted correlate of protection from influenza illness [9–13]. Data from the literature point to the predominantly recall nature of the influenza A/H1N1-specific humoral immune responses, with IgG-producing influenza vaccine-specific plasmablasts originating from activated memory B cells specific for conserved (in several strains) influenza virus epitopes [14, 15]. Thus, influenza-specific memory B cells (MBCs) comprise an important pool of cells capable of responding to stimulation by differentiation into plasma cells to mount a rapid secondary immune response to pathogenic challenge and contribute to both short-term and long-term immunity. To date, no biological markers/models exist that explain and/or predict the development of influenza-specific memory B cell immune response after vaccination.
The aim of the current study is to identify baseline, early and late transcriptional signatures (in peripheral blood mononuclear cells/PBMCs) associated with influenza A/H1N1-specific MBC response following receipt of seasonal trivalent inactivated (influenza A/H1N1-containing) influenza vaccine in an older (50–74 years old) study population.
Methods
The methods described herein are similar or identical to those published for our previous studies [1, 16–21].
Study Subjects
Details on study recruitment and study cohort characteristics have been provided elsewhere [1, 16–18]. As previously reported, the study population consisted of 159 subjects (50–74 years old), enrolled at Mayo Clinic, Rochester, MN, following receipt of the 2010–2011 seasonal trivalent influenza vaccine, containing the A/California/7/2009 H1N1-like, A/Perth/16/2009 H3N2-like, and B/Brisbane/60/2008-like viral strain antigens [18]. Blood samples for this study were collected prior to vaccination (baseline) and at two timepoints post-vaccination (Day 3 and Day 28), as shown in Fig. 1 (study design). All study participants provided written informed consent, and all study procedures were approved by Mayo Clinic’s Institutional Review Board.
Fig. 1.
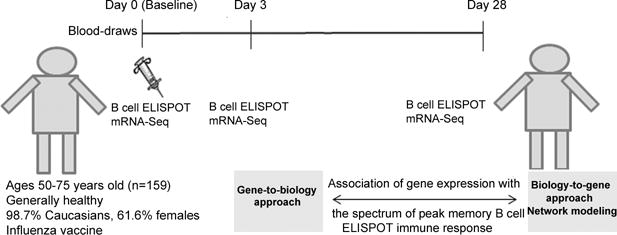
Study design
B cell ELISPOT assay
We quantified influenza virus-positive B cells (memory-like IgG B cells) at all timepoints pre- and post-vaccination in subjects’ PBMCs using the Mabtech ELIspotPLUS kit for human IgG (Mebtech Inc.; Cincinnati, OH), according to the manufacturer’s specifications and as previously described [1, 16]. The results are presented as spot-forming units (SFUs) per 2×10⁵ cells as subjects’ medians (median of influenza virus-specific response, measured in quadruplicate). Intra-class correlation coefficients, assessing the correlation between replicate measurements in this assay at baseline, were high (0.88) [1, 16].
Library Preparation and Next Generation Sequencing (NGS)
The mRNA NGS methods are similar or identical to those published for our previous transcriptomics studies [19–21]. In brief, libraries were prepared from total RNA extracted from PBMCs (without additional viral/antigen stimulation; all timepoints pre- and post-vaccination) and, after QA/QC validation, were loaded for single-end read sequencing on the Illumin HiSeq 2000 (Illumina; San Diego, CA) using the Illumina’s Single Read Cluster Generation kit (v2), and the 50 Cycle Illumina Sequncing Kit (v3). The sequencing reads were aligned to the human genome build 37.1 using TopHat (1.3.3) and Bowtie (0.12.7). HTSeq (0.5.3p3) was used to perform gene counting, while BEDTools (2.7.1) was used to count the reads mapping to individual exons [22–24].
Statistical methods
Here, we provide an overview of statistical and bioinformatic methods used; full details are available as supplemental information. All assays were run utilizing randomized block designs, keeping all samples for a subject adjacent in run order [25–27]. Data quality was assessed graphically and via variance criteria. Our analytical strategy consisted of two complementary approaches. The biology-to-gene approach is a deductive knowledge-driven approach in which analyses are performed at the pathway or network-module level defined externally to our data [28]. The gene-to-biology approach is an inductive, data-driven approach in which analyses are performed at the gene level, or on gene modules defined from our data. Data-filtering strategies were used to reduce the chance of false positives. Penalized-regression methods were used to identify key genes or genesets associated with B cell ELISPOT response to vaccination [29, 30]. The dependent variable was the change in influenza virus-specific B cell ELISPOT from Day 0 to Day 28. Network-modeling strategies were used to integrate and interpret results from statistical models. Prioritized genesets were integrated using network biology resources (HPRD [31], CCSB [32], PID [33], and the 7.8% of STRING [34] with confidence score ≥ 70%). Networks were visualized using Cytoscape [35] version 3.2.1 and layouts refined using AllegroLayout v.2.2.1 [36]. The biologic functions of genesets were evaluated using GO term [37, 38] and 138 KEGG canonical pathways [39, 40] manually curated to remove disease-associated and derived pathways (see Supplemental Information for more details).
Results
Subjects Demographics and Memory B cell ELISPOT response
The demographic and immune response variables have been previously described by us [1, 16, 18]. A total of 159 subjects (98.7% Caucasians) participated in this study. Females represented 61.6% of the cohort. The median (IQR) age of the cohort was 59.5 (55.3, 66.3) years. One participant was excluded due to the cDNA library failing quality control (QC) metrics, leaving a total of 158 subjects for analysis.
The dynamics of the influenza A/H1N1-specific memory B cell ELISPOT response after vaccination and the variation of this immune outcome in our study subjects and its correlation with other immune response variables have been previously described in detail [1, 16]. In summary, we observed a significant increase (from 11 SFUs per 2×10⁵ PBMCs [IQR 5, 22] at baseline to 38 SFUs [IQR 18, 60] at Day 28, p-value=1.1 × 10⁻²¹) of influenza-specific memory B cell frequencies post-vaccination, with 40.1% of the subjects demonstrating a considerable (≥4-fold) increase in influenza A/H1N1-specific B cell ELISPOT response (Day 0 compared to Day 28), which parallels the classical HAI definition of vaccine response [1, 16]. Details on the transcriptional responses in our study cohort have been previously published [41].
Linear models of B cell ELISPOT response using gene-to-biology approach
To assess the influence of transcriptomic changes on the memory B cell response in our cohort, we estimated per-variable association of baseline, early and late transcriptional changes with peak memory B cell ELISPOT response (Day 28-Day 0) (Table 1). The top 30 genes whose expression levels were significantly associated with memory B cell response at baseline (p-value range 7.59E-06 to 0.00012, q-value=0.027), early (p-value range 7.58E-06 to 0.00018, q-value=0.039), and late (p-value range 7.92E-08 to 1.958E-06, q-value range 0.00019 to 0.00032) timepoints after influenza vaccination are shown in Table 1. Information on all significant genes is included in Supplementary Table S1. Regression modeling results of B cell ELISPOT response, using data-driven transcriptional modules (gene-to-biology approach), are shown in Supplemental Information Fig. S1
Table 1.
Association of baseline, early and late gene expression changes with peak memory B cell ELISPOT response (Day 28 – Day 0) in older individuals
| Gene Symbol | Coefficient | Std.Error | p-value | q-value | Gene name |
|---|---|---|---|---|---|
| Baseline gene expression (Day 0) | |||||
| MVD | 2.11 | 0.46 | 7.585E-06 | 0.027 | mevalonate (diphospho) decarboxylase |
| PLEKHM2 | −4.40 | 0.98 | 1.363E-05 | 0.027 | pleckstrin homology domain containing, family M (with RUN domain) member 2 |
| FAM134C | 2.12 | 0.48 | 1.509E-05 | 0.027 | family with sequence similarity 134, member C |
| PJA2 | −2.77 | 0.64 | 2.781E-05 | 0.027 | praja ring finger 2, E3 ubiquitin protein ligase |
| NPEPL1 | −0.92 | 0.21 | 2.987E-05 | 0.027 | aminopeptidase-like 1 |
| ATAD3C | 0.63 | 0.15 | 3.48E-05 | 0.027 | ATPase family, AAA domain containing 3C |
| PMVK | 2.36 | 0.55 | 3.597E-05 | 0.027 | phosphomevalonate kinase |
| MLXIP | −1.73 | 0.41 | 4.32E-05 | 0.027 | MLX interacting protein |
| NCRNA00152 | 1.06 | 0.25 | 4.587E-05 | 0.027 | long intergenic non-protein coding RNA 152 |
| MTX1 | −2.06 | 0.50 | 5.114E-05 | 0.027 | metaxin 1 |
| KIAA1958 | −0.81 | 0.19 | 5.392E-05 | 0.027 | KIAA1958 |
| TMED7 | −1.51 | 0.37 | 6.196E-05 | 0.027 | transmembrane p24 trafficking protein 7 |
| PIGU | 2.10 | 0.51 | 6.361E-05 | 0.027 | phosphatidylinositol glycan anchor biosynthesis, class U |
| CHML | −1.69 | 0.41 | 6.995E-05 | 0.027 | choroideremia-like (Rab escort protein 2) |
| MAF | 0.85 | 0.21 | 7.302E-05 | 0.027 | v-maf avian musculoaponeurotic fibrosarcoma oncogene homolog |
| CCDC6 | −2.34 | 0.58 | 7.728E-05 | 0.027 | coiled-coil domain containing 6 |
| PHF19 | 2.22 | 0.55 | 7.764E-05 | 0.027 | PHD finger protein 19 |
| PI4KA | −3.31 | 0.82 | 7.902E-05 | 0.027 | phosphatidylinositol 4-kinase, catalytic, alpha |
| RDH16 | 0.90 | 0.22 | 8.381E-05 | 0.027 | retinol dehydrogenase 16 (all-trans) |
| ZFAT | −1.56 | 0.39 | 9.193E-05 | 0.027 | zinc finger and AT hook domain containing |
| IL32 | 0.74 | 0.18 | 9.288E-05 | 0.027 | interleukin 32 |
| NFATC3 | 1.65 | 0.41 | 0.00010 | 0.027 | nuclear factor of activated T-cells, cytoplasmic, calcineurin-dependent 3 |
| CERS6 | −1.24 | 0.31 | 0.00010 | 0.027 | ceramide synthase 6 |
| SNRPC | 2.04 | 0.51 | 0.00010 | 0.027 | small nuclear ribonucleoprotein polypeptide C |
| LOC400927 | −1.39 | 0.35 | 0.00011 | 0.027 | TPTE and PTEN homologous inositol lipid phosphatase pseudogene |
| LRFN2 | 0.42 | 0.11 | 0.00011 | 0.027 | leucine rich repeat and fibronectin type III domain containing 2 |
| HDHD3 | 1.03 | 0.26 | 0.00011 | 0.027 | haloacid dehalogenase-like hydrolase domain containing 3 |
| SERPINF1 | −1.03 | 0.26 | 0.00011 | 0.027 | serpin peptidase inhibitor, clade F (alpha-2 antiplasmin, pigment epithelium derived factor), member 1 |
| CLPB | −1.30 | 0.33 | 0.00012 | 0.027 | ClpB homolog, mitochondrial AAA ATPase chaperonin |
| C9orf100 | 1.32 | 0.33 | 0.00012 | 0.027 | Rho guanine nucleotide exchange factor (GEF) 39 |
| Early gene expression (Day 3 – Day 0) | |||||
| PMVK | −2.80 | 0.61 | 7.578E-06 | 0.039 | phosphomevalonate kinase |
| ZNF780B | −1.21 | 0.27 | 1.606E-05 | 0.039 | zinc finger protein 780B |
| BLCAP | −2.73 | 0.62 | 2.251E-05 | 0.039 | bladder cancer associated protein |
| TESK2 | 2.25 | 0.52 | 2.877E-05 | 0.039 | testis-specific kinase 2 |
| NFKBIA | 1.21 | 0.29 | 4.615E-05 | 0.039 | nuclear factor of kappa light polypeptide gene enhancer in B-cells inhibitor, alpha |
| STK17B | 2.04 | 0.49 | 5.329E-05 | 0.039 | serine/threonine kinase |
| TMEM99 | −0.90 | 0.22 | 5.591E-05 | 0.039 | transmembrane protein 99 |
| FCHSD2 | 2.07 | 0.50 | 5.69E-05 | 0.039 | FCH and double SH3 domains 2 |
| H3F3C | 1.61 | 0.39 | 6.046E-05 | 0.039 | H3 histone, family 3C |
| LRP11 | −1.36 | 0.34 | 7.822E-05 | 0.039 | low density lipoprotein receptor-related protein 11 |
| DHRS13 | −1.84 | 0.45 | 7.981E-05 | 0.039 | dehydrogenase/reductase (SDR family) member 13 |
| MAP4 | −2.52 | 0.63 | 9.193E-05 | 0.039 | microtubule-associated protein 4 |
| PLEKHM2 | 3.90 | 0.97 | 9.541E-05 | 0.039 | pleckstrin homology domain containing, family M (with RUN domain) member 2 |
| CCDC6 | 2.24 | 0.56 | 9.984E-05 | 0.039 | coiled-coil domain containing 6 |
| USP6NL | 1.33 | 0.33 | 0.0001096 | 0.039 | USP6 N-terminal like |
| ZNF233 | −0.74 | 0.19 | 0.0001107 | 0.039 | zinc finger protein 233 |
| MAP1LC3B2 | 1.27 | 0.32 | 0.0001153 | 0.039 | microtubule-associated protein 1 light chain 3 beta 2 |
| GMEB1 | 2.07 | 0.53 | 0.0001267 | 0.039 | glucocorticoid modulatory element binding protein 1 |
| C20orf134 | −0.93 | 0.24 | 0.0001305 | 0.039 | actin-like 10 |
| TTLL1 | −1.70 | 0.43 | 0.0001309 | 0.039 | tubulin tyrosine ligase-like family member 1 |
| ANO8 | 1.58 | 0.40 | 0.0001349 | 0.039 | anoctamin 8 |
| EEF1E1-MUTED | −1.88 | 0.48 | 0.0001406 | 0.039 | eukaryotic translation elongation factor 1 epsilon 1, muted homolog |
| PELI1 | 0.91 | 0.23 | 0.0001446 | 0.039 | pellino E3 ubiquitin protein ligase 1 |
| FAM21C | 1.06 | 0.27 | 0.0001458 | 0.039 | family with sequence similarity 21, member C |
| RAD51C | −1.73 | 0.45 | 0.0001527 | 0.039 | RAD51 paralog C |
| THAP3 | −1.37 | 0.35 | 0.0001603 | 0.039 | THAP domain containing, apoptosis associated protein 3 |
| SOCS3 | 1.05 | 0.27 | 0.0001737 | 0.039 | suppressor of cytokine signaling 3 |
| CHMP4A | −1.74 | 0.45 | 0.000177 | 0.039 | charged multivesicular body protein 4A |
| CDK4 | −2.21 | 0.57 | 0.000177 | 0.039 | cyclin-dependent kinase 4 |
| ELF1 | 1.75 | 0.46 | 0.0001815 | 0.039 | E74-like factor 1 (ets domain transcription factor) |
| Late gene expression (Day 28 – Day 0) | |||||
| CMBL | −1.30 | 0.23 | 7.919E-08 | 0.00019 | carboxymethylenebutenolidase homolog (Pseudomonas) |
| DHRS13 | −2.41 | 0.43 | 8.749E-08 | 0.00019 | dehydrogenase/reductase (SDR family) member 13 |
| SEPW1 | −3.20 | 0.58 | 1.13E-07 | 0.00019 | selenoprotein W, 1 |
| KRT1 | −0.47 | 0.09 | 2.422E-07 | 0.00024 | keratin 1, type II |
| UGP2 | −3.40 | 0.63 | 2.728E-07 | 0.00024 | UDP-glucose pyrophosphorylase 2 |
| GOLGA7B | −1.41 | 0.26 | 3.083E-07 | 0.00024 | golgin A7 family, member B |
| SERGEF | −2.65 | 0.50 | 3.498E-07 | 0.00024 | secretion regulating guanine nucleotide exchange factor |
| ITGB1BP1 | −2.48 | 0.47 | 3.909E-07 | 0.00024 | integrin beta 1 binding protein 1 |
| TTLL1 | −2.32 | 0.44 | 5.787E-07 | 0.00029 | tubulin tyrosine ligase-like family member 1 |
| LOC147804 | −1.99 | 0.38 | 6.934E-07 | 0.00029 | TPM3P9, tropomyosin 3 pseudogene 9 |
| NDFIP2 | −1.60 | 0.31 | 7.938E-07 | 0.00029 | Nedd4 family interacting protein 2 |
| PPAP2B | 0.86 | 0.17 | 7.991E-07 | 0.00029 | PLPP3, phospholipid phosphatase 3 |
| TRIM2 | −1.15 | 0.22 | 8.582E-07 | 0.00029 | tripartite motif containing 2 |
| MSX2P1 | −1.18 | 0.23 | 9.238E-07 | 0.00029 | msh homeobox 2 pseudogene 1 |
| CHMP4A | −2.22 | 0.44 | 9.387E-07 | 0.00029 | charged multivesicular body protein 4A |
| FAM195B | −3.29 | 0.65 | 1.002E-06 | 0.00029 | family with sequence similarity 195, member B |
| STX8 | −3.29 | 0.65 | 1.032E-06 | 0.00029 | syntaxin 8 |
| TCF4 | 1.29 | 0.25 | 1.066E-06 | 0.00029 | transcription factor 4 |
| C14orf1 | −2.15 | 0.42 | 1.199E-06 | 0.00031 | chromosome 14 open reading frame 1 |
| LOC388692 | −1.41 | 0.28 | 1.362E-06 | 0.00032 | uncharacterized LOC388692 |
| KIAA0408 | −1.11 | 0.22 | 1.373E-06 | 0.00032 | KIAA0408 |
| CFH | −1.10 | 0.22 | 1.404E-06 | 0.00032 | complement factor H |
| PCDHGC3 | 0.86 | 0.17 | 1.512E-06 | 0.00032 | protocadherin gamma subfamily C, 3 |
| CNPY4 | −2.04 | 0.41 | 1.568E-06 | 0.00032 | canopy FGF signaling regulator |
| LOC283174 | −0.97 | 0.20 | 1.665E-06 | 0.00032 | uncharacterized LOC283174 |
| ZNF32 | −2.15 | 0.43 | 1.695E-06 | 0.00032 | zinc finger protein 32 |
| PECR | −2.52 | 0.51 | 1.851E-06 | 0.00032 | peroxisomal trans-2-enoyl-CoA reductase |
| PVRL3 | −1.20 | 0.24 | 1.911E-06 | 0.00032 | poliovirus receptor-related 3 |
| BLCAP | −2.86 | 0.58 | 1.923E-06 | 0.00032 | bladder cancer associated protein |
| PIP5K1B | 1.22 | 0.25 | 1.958E-06 | 0.00032 | phosphatidylinositol-4-phosphate 5-kinase, type I, beta |
Linear model results of the top 30 genes associated with peak B cell ELISPOT response (Day 28 – Day 0). Baseline models include baseline gene expression as independent variables; early models include change in gene expression from baseline to Day 3 as independent variables; and late models include change in gene expression from baseline to Day 28 as independent variables. The coefficient is the change in peak B cell ELISPOT response per one unit change in the independent variable. The p-value is the statistical significance from the regression model, while the q-value is the false discovery rate as described in the Statistical methods.
Regression models of B cell ELISPOT response using biology-to-gene approach
We used externally defined pathways/genesets with significant (early [Day 3 – Day 0] and late [Day 28 – Day 0]) mRNA expression changes over time (p <0.005, n = 142) in cross-validated penalized regression models of memory B cell ELISPOT response (Day 28 – Day 0) after vaccination. The pathways and biological functions associated with memory B cell response are summarized in Table 2; for early (Day 3 – Day 0) gene expression, changes are centered around genes related to cholesterol/sterol biosynthesis and membrane function (MSE range 2.007 to 2.036, Table 2, Fig. 2A and -2B). Biological pathways for late (Day 28 – Day 0) gene expression changes, which are associated with memory B cell response (MSE range 1.98 to 2.029, Table 2), are related to genes functioning in cell adhesion and cell migration (Fig. 2C); cell signaling, including MAP kinase activity (Fig. 2D) and cytokine/chemokine signaling (Fig. 2E); and transcriptional regulation (including regulation of key metabolism-related genes) (Fig. 1F).
Table 2.
Pathways and biological functions associated with memory B cell response after influenza vaccination
| Geneset/Pathway name | MSEa | r2b | Genes |
|---|---|---|---|
| Early (Day 3 – Day 0) gene expression changes, predictive of peak memory B cell ELISPOT response | |||
| Kegg Terpenoid backbone biosynthesis | 2.007 | 0.085 | PMVK;GGPS1;MVD;HMGCR;PDSS2 |
| Basement membrane | 2.028 | 0.075 | FBN1;SMC3;LAMC1;EFEMP2;SNTB1 |
| Reactome Cholesterol biosynthesis | 2.036 | 0.072 | PMVK;LBR;FDFT1;SQLE;NSDHL |
| Late (Day 28 – Day 0) gene expression changes, predictive of peak memory B cell ELISPOT response | |||
| Leukocyte migration | 1.980 | 0.097 | CKLF;AIMP1;IL10;SFTPD;IL8;DOCK2; CD34;TGFB2 |
| Kegg Maturity onset diabetes of the young | 1.990 | 0.093 | HNF1A;PAX6;BHLHA15;HES1 |
| Transferase activity, transferring alkyl or aryl (other than methyl) groups | 1.990 | 0.093 | MGST3;GSTM3;GSTZ1;GSTM4;RABGGTA;MAT2A |
| Biocarta SARS pathway | 1.997 | 0.090 | LDHB;GPT;NCL |
| MAP kinase activity | 1.999 | 0.089 | MAPK1;MAPK11;MAPK9;MAPK14;MAPK12;MAPK7 |
| Reactome p75NTR recruits signaling complexes | 2.005 | 0.086 | PRKCI;UBA52;TRAF6;NGFR;SQSTM1;IRAK1;RIPK2;IKBKB |
| Cytokine and chemokine mediated signaling pathway | 2.007 | 0.085 | COMMD7;CCR2;ZNF675;DUOX1;IL31RA;PF4;SOCS5;EREG |
| Epithelial to mesenchymal transition | 2.013 | 0.082 | S100A4;TRIM28;TGFB3;HGF;TGFB1;CTNNB1;HNRNPAB;TGFB2 |
| Hydrolase activity, acting on carbon-nitrogen (not peptide) bonds, in linear amides | 2.016 | 0.081 | GLS2;HDAC3;HDAC11;HDAC2;HDAC6 |
| Regulation of protein polymerization | 2.029 | 0.075 | MAPT;TMSB4Y;MAPRE1 |
MSE mean squared error,
Estimated r2
Penalized regression results of externally defined genesets at early and late gene expression changes associated with peak B cell ELISPOT response (Day 28-Day 0). The independent variables are the change in gene expression from baseline to Day 3 (early) and baseline to Day 28 (late) for each geneset as described in Statistical methods.
Fig. 2. Biological pathway-related genes, associated with peak memory B cell response after influenza vaccination.
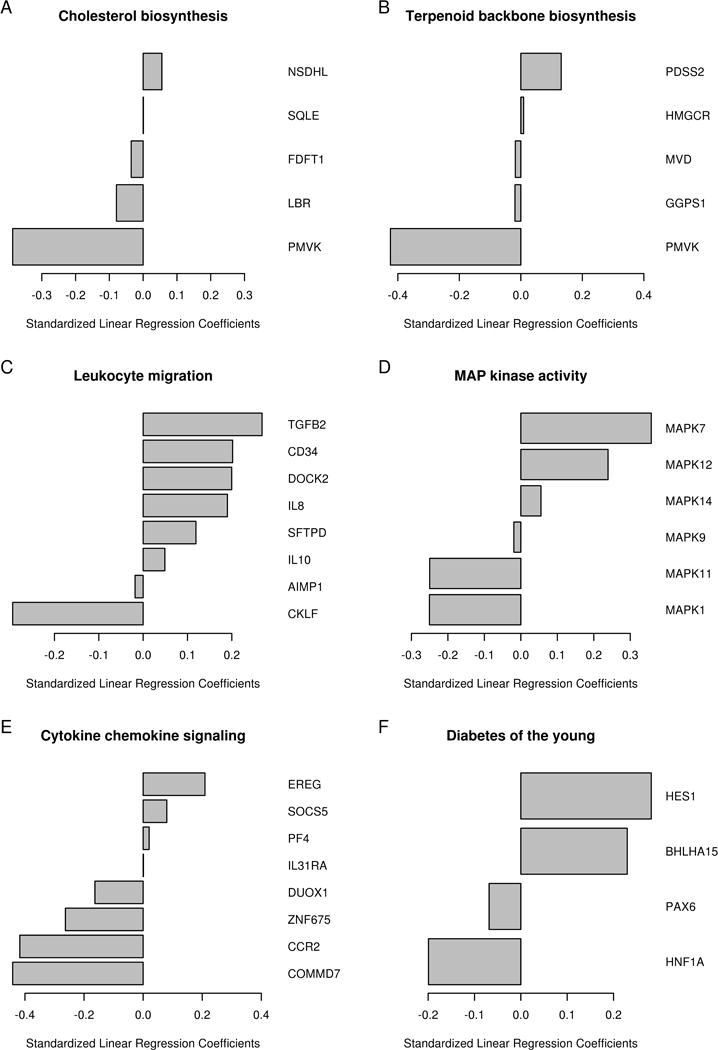
Penalized regression results of externally defined genesets at early and late gene expression changes associated with peak B cell ELISPOT response (Day 28-Day 0). A Cholesterol biosynthesis (Day 3-Day 0); B Terpenoid backbone biosynthesis (Day 3-Day 0); C Leukocyte migration (Day 28-Day 0); D MAP kinase activity (Day 28-Day 0); E Cytokine and chemokine signaling (Day 28-Day 0); F Diabetes of the young (Day 28-Day 0).
Network modeling
Using the top nine statistically prioritized genesets/pathways (adjusted r2 ≥ 0.08), we identified three functional modules consisting of metabolic, epigenetic regulation, and cytokine/chemokine signaling. These modules are visually evident from a network layout that considers known gene-gene connectivity from PPI and pathway resources (force-directed; see Fig. 3).
Fig. 3. Network modeling of biological pathway-related genes, predictive of peak memory B-cell ELISPOT response after influenza vaccination.
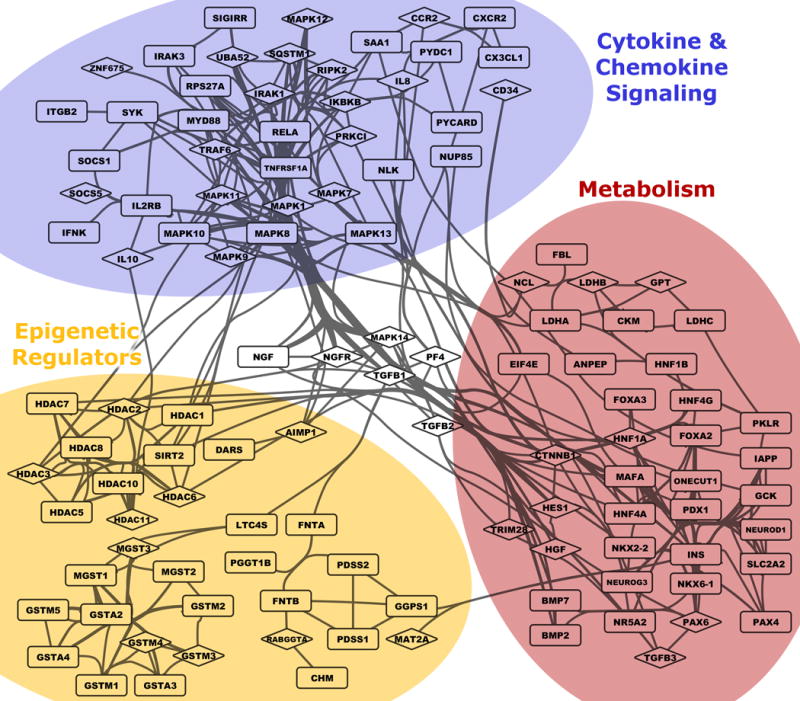
Genes within the 9 genesets with strongest statistical association (with memory B-cell ELISPOT response) partition into three interrelated functional groups. A modified force-directed layout (AllegroLayout) was used to position genes, and then edges bundled to increase legibility. Genes included in GLMNET modeling are shown using diamond-shaped symbols, while other genes from the same genesets are shown as rectangles. Visualization performed in Cytoscape.
Enrichment levels of canonical pathways and GO terms were tested (Supplemental Information Fig. S2). Many of the statistically prioritized genes are members of canonical signaling pathways that carry out important events in immune response. To strengthen the biological interpretation and validate our findings, we also investigated the effect of statistical significance threshold choice on pathway enrichment levels. As the inclusion threshold (geneset q-value) was lowered to include between the top 9 and 53 genesets, the enrichment level of top pathways (except for glutathione and drug metabolism associated with the glutathione S-transferase μ/GSTM family genes) increased as more genesets were included (Supplemental Information Fig. S2), indicating more complete coverage of these pathways exists. Furthermore, additional canonical pathways (e.g., purine and pyrimidine metabolism, Jak/STAT, ERBB, NOTCH, and B-cell receptor signaling) show enrichment as more genesets are included (Supplemental Information Fig. S2).
Discussion
Recent reports from the literature are beginning to uncover the complex nature of immune response following influenza vaccination and to develop predictive models of observed biological responses, focusing largely on antibody titers (HAI) as the currently accepted correlate of protection. [9–13] We and others have reported on the link between influenza virus-specific serological status and response (HAI and neutralizing antibody titers) and memory B cell response related to vaccination in young and older populations [1, 42, 43]. For example, we have demonstrated the positive correlation between the early dynamics/change (Day 3 compared to baseline relative to vaccination) in influenza-specific memory B cell ELISPOT response and the increase (relative to baseline) in HAI and neutralizing antibody titers following influenza vaccination [1]. Mounting scientific evidence suggests the important influence of different immune variables, particularly memory B cell status, on biological responses following infection and vaccination and the largely recall nature of the influenza A/H1N1-specific antibody response.[13–15] Memory B cells specific for viral conserved epitopes are an important source of influenza vaccine-induced plasmablasts that give rise to neutralizing antibodies [13–15]. The current study is the first systems-level attempt, using peripheral blood mononuclear cell transcriptional profiling and memory B cell response measures over time following vaccination, to develop models of vaccine-induced memory B cell response and delineate key pathways and biological functions inherent to this response in older individuals. In our study, assessment of baseline, early and late post-vaccination transcriptomic changes using linear models (gene-to-biology approach) revealed significant per-variable associations of multiple metabolism and immune response genes with the observed memory B cell response in our cohort of older individuals (Table 1).
Baseline, early and late gene expression changes were characterized by the consistent association of lipid, cholesterol, and other metabolism-related genes with the observed peak memory B cell ELISPOT response (Day 28-Day 0). These genes include mevalonate [diphospho] decarboxylase (MDV), phosphomevalonate kinase (PMVK), phosphatidylinositol 4-kinase (alpha component, PI4KA), dehydrogenase/reductase (DHRS13), phospholipid phosphatase 3 (PPAP2B), phosphatidylinositol-4-phosphate 5-kinase (PIP5K1B), glucose pyrophosphorylase (UGP2), and other genes involved in lipid/carbohydrate metabolism and cell signaling.
In addition, early (Day 3–Day 0) gene expression changes also demonstrated the involvement of known immune function-related genes in the development of memory B cell response. Important genes include a serine/threonine kinase (STK17B), which is involved in regulation of T cell activation and in antigen receptor signaling; a member of the NF-kappa-B inhibitor family (NFKBIA), which is involved in inflammatory response and apoptosis; a pellino ubiquitin protein ligase (PELI1), which is involved in B cell activation and TLR/IL1R signaling events in innate immune response/ inflammation; and a suppressor of cytokine signaling (SOCS), which is a major regulator of inflammation and infection-related immune response. Interestingly, a related molecular signature consisting of five significant genes (PELI1, NFKBIA, SOCS3, GMEB1 and NCRNA00152/LINC00152) has been previously associated with dendritic cells’ (DCs) transcriptional response to TLR4 stimulation (LPS) (GSE2706)[44], which supports early engagement of pathogen-associated molecular patterns/PAMP receptors (e.g., TLRs) and NF-kB signaling events in APCs to promote antigen presentation, costimulation and T helper and/or other cellular function.
In addition to metabolism-related genes, late (Day 28 – Day 0) gene expression changes were also characterized by the association of important immune and adhesion/motility genes with memory B cell response after vaccination. Interesting genes demonstrating significant associations include ITGB1BP1, which is an integrin beta 1 binding protein involved in integrin-dependent cell adhesion and signaling; PVRL3, which is a poliovirus receptor acting as an adhesion molecule at adherens junctions with a role in motility and cell proliferation; NDFIP2, which is a Nedd4 family interacting protein involved in ubiquitin-dependent protein sorting/trafficking, protein ubiquitation and regulation of I-kappaB kinase/NF-kappaB signaling; and CNPY4, which is a chaperone involved in cell surface expression of TLRs.
Late transcriptional dynamics (associated with memory B cell response development) also revealed a molecular signature (TCF4; PMVK; UGP2, SEPW1, and TMED7) consistent with gene expression changes previously observed in DCs (30 min vs. 12 h) after TLR4 stimulation (GSE17721) [45], demonstrating the importance of metabolic genes (and genes with no known immune function) in PAMP receptors-associated immune responses/processes.
Our complementary knowledge-driven (biology-to-gene) analytical approach also points to related biological functions and pathways attributed to transcriptional patterns, which are associated with memory B cell response (Table 2, Fig. 2), and involve early and late metabolic, cell migration/adhesion, MAP kinase and NF-kB cell signaling (chemokine/cytokine signaling) and transcriptional regulation events. Related signatures (e.g., chemokine/cytokine signaling, pattern recognition receptor-associated signaling signatures, metabolic signatures) have been suggested as being important for mounting efficient antibody response (after influenza vaccination) by other studies. [9–13]
An interesting observation in our study is the identified early gene expression lipid signature (Table 2, Fig 2B) containing the PDSS2 gene (decaprenyl diphosphate synthase subunit 2, which is involved in the biosynthesis of coenzyme Q/CoQ10); this was previously reported by Furman et al. to be associated with variations in antibody responses to influenza vaccine [46].
In our study, of particular interest is the involvement of genes related to cholesterol/sterol biosynthesis and membrane function in the regulation and mounting of memory B cells response after influenza vaccination. CoQ10 shares a biosynthetic pathway with cholesterol; functions as an electron transporter in the mitochondrial respiratory chain; and is important for energy production, beta-oxidation of fatty acids, biosynthesis of pyrimidines and other cellular processes. Recent studies have demonstrated the role of lipid metabolites, cholesterol biosynthesis and the host mevalonate pathway for respiratory syncytial virus infection, HIV uptake and replication, and also for the activation of human γδTCR cells during bacterial infection [47–49]. Even more exciting are the findings of a lipidomics profiling study of influenza infection in a mouse model (recapitulated in human samples in the same study), which demonstrated the association of specific lipid metabolites (5-lipoxygenase and 12/15-lipoxygenase) with the pathogenic and recovery stage of influenza infection, respectively, and with inflammatory response. This is solid evidence for the important role of lipid metabolite-related mechanisms and cellular functions for the course and/or severity of influenza [50]. Furthermore, lipid and, in particular, cholesterol metabolism and homeostasis has been reported to affect lipid rafts, B cell development, maturation and function/signaling, T cell polarization and the function of dendritic cells [51]. Alterations in cholesterol biosynthesis and cholesterol metabolism are frequently observed during normal aging. This results in higher total and low-density lipoprotein/LDL cholesterol plasma levels, which are likely due to the increase of adipose tissue during aging, increased absorption of cholesterol with decreased breakdown (to bile acids) and clearance, specific gene expression changes, and changes in hormonal levels. While the link between these age-related changes and the observed altered immunity to vaccines in older individuals is likely, further investigation is warranted in order to more fully understand its impact on our findings.
To summarize our results into biologically valuable knowledge, we employed complementary approaches to annotate the functional enrichment within genes showing statistical associations with the observed peak B-cell ELISPOT response after influenza vaccination. Term enrichment indicates common functions between prioritized genesets. Specifically, among the nine genesets/pathways with the strongest statistical association with B-cell ELISPOT response (listed in Table 2), three genesets/pathways (Biocarta SARS pathway, KEGG Maturity onset diabetes of the young, and Epithelial to mesenchymal transition) are centered around metabolism; two genesets/pathways (Hydrolase activity, acting on carbon-nitrogen bonds and Transferase activity, transferring alkyl or aryl groups) are comprised of three known protein complexes that perform modifications of epigenetic marks; and four genesets/pathways (Leukocyte migration, Cytokine and chemokine signaling, Reactome p75NTR recruits signaling complexes, MAPK activity) are centered around cytokine and chemokine MAP kinase and NF-kB signaling and the inflammatory response.
Pathway enrichment tests also demonstrated significant representation of genes from multiple signaling pathways, including pattern recognition receptor-induced signaling cascades (Toll-like receptor, NOD-like receptor, RIG-I-like receptor, T-cell Receptor, neurotrophin, and MAPK), due to a common group of genes shared by these pathways (IKBKB, MAPK1, MAPK7, MAPK9, MAPK11, MAPK12, MAPK14, TGFB1, TGFB2, TGFB3, TRAF6, IL8, IL10, IRAK1, RIPK2, and NGFR). In addition to the interleukins, other cytokine/chemokine genes (i.e., TGFβ family genes and CCR2) represent interesting genes with possible involvement d in the development of B cell response. The development, survival and activation of B cells is mediated through cooperative signals through the B cell receptor, innate receptors (TLR9 and other TLRs) and receptors for B-cell activating factor BAFF-R to activate NFkB, MAPKs and other signaling cascades. These signaling events (including the TGF beta activated MAP3K7, an important regulator of cooperative B cell stimulation by BCR and TLR9) then trigger B cell differentiation, activation and wide array of biological functions (proliferation, cytokine secretion etc.) [52, 53]. Thus, the identified genesets, pathways, and genes in our study can be directly related to the development and activation of B cell response. The canonical pathways indicated by the most significantly associated genesets persist across threshold levels, adding confidence to the identified biological functions (Supplemental Fig. S2).
As genes were not selected independently from one another (we began with genesets, biology-to-gene approach), the p-values from enrichment tests should be interpreted conservatively. The purpose of enrichment analysis, in this context, is to act as a descriptive framework and guide interpretation in order to better understand the possible underlying mechanisms and functional roles of statistically prioritized genes, genesets, and pathways.
An important limitation of our study is the possibility of false-positive associations/predictors of memory B cell response. To abate this concern, we report both p-values and q-values (for the per-variable analysis), which allows readers to evaluate the level of evidence. We also use a knowledge-driven biology-to-gene approach as part of our analytical strategy to control for FDR (see Supplemental Information). Another important limitation of the study is, due to limited sample availability, our mRNA-Seq analysis was done in PBMCs rather than in specific cell subsets of interest (e.g., antigen-specific B cells). Information on gene expression in antigen-specific B and T cells (and in other cell subsets) would greatly enhance the in-depth understanding of the biological processes and mechanisms underlying influenza vaccine-induced immunity.
While the identification of a predictive (of protection against influenza) immune response signature/signatures is the ultimate goal of systems vaccinology, our study did not include predictive modeling of the immune outcome per se. However, ours is still the first study to assess and report transcriptional signatures associated with the development of memory B cell response after influenza vaccination; thus, our study provides the knowledge base and lays the foundation for future work in this direction. Follow-up replication (with a larger sample size) and functional studies (e.g., gene knockout animal studies highlighting the role of specific genes in B cell memory development/activation during vaccination, or the level of pathway activity) are warranted to validate our findings and to identify predictive signatures of influenza-specific memory B cell immune response and the underlying mechanisms that mediate the development of B cell immune memory.
In conclusion, to the best of our knowledge, this is the first systems biology study utilizing unbiased high-throughput transcriptional profiling and modeling approaches to identify signatures of memory B cell response following influenza vaccination, adding to the emerging knowledge on humoral immunity and immune memory to influenza vaccination. The knowledge gained may inform the design of novel or improved vaccines against influenza in older individuals by devising solutions to overcome genetic, immunologic and age-related restrictions to protective immunity.
Supplementary Material
Acknowledgments
We thank the study subjects for their participation and Caroline L. Vitse for proofreading and editorial assistance. We thank Krista M. Goergen (Mayo Clinic, Rochester, MN) and Dr. Brett McKinney (University of Tulsa, OK) for their contributions to statistical analyses. This study was supported by NIH grant U01AI089859 and a grant (UL1 TR000135) from the National Center for Advancing Translational Sciences (NCATS). The content is solely the responsibility of the authors and does not necessarily represent the official views of the National Institutes of Health.
Footnotes
Conflict of Interest Statement
Dr. Poland is the chair of a Safety Evaluation Committee for novel investigational vaccine trials being conducted by Merck Research Laboratories. Dr. Poland offers consultative advice on vaccine development to Merck & Co. Inc., CSL Biotherapies, Avianax, Dynavax, Novartis Vaccines and Therapeutics, Emergent Biosolutions, Adjuvance, Microdermis, Seqirus, NewLink, Protein Sciences, GSK Vaccines, and Sanofi Pasteur. Drs. Poland and Ovsyannikova hold two patents related to vaccinia and measles peptide research. Dr. Kennedy has received funding from Merck Research Laboratories to study waning immunity to mumps vaccine. These activities have been reviewed by the Mayo Clinic Conflict of Interest Review Board and are conducted in compliance with Mayo Clinic Conflict of Interest policies. This research has been reviewed by the Mayo Clinic Conflict of Interest Review Board and was conducted in compliance with Mayo Clinic Conflict of Interest policies.
Authors’ Contributions
IHH participated in the conception and design of the study, carried out immune assays, assisted in data interpretation and drafted the manuscript. IGO participated in the design of the study, carried out immune assays, and assisted in drafting of the manuscript. RBK participated in the design of the study, carried out immune assays, and assisted in drafting of the manuscript. ALO participated in the design of the study, carried out statistical analyses and helped draft the manuscript. MTZ carried out statistical analyses and helped draft the manuscript. DEG participated in the design of the study, carried out statistical analyses, and helped draft the manuscript. GAP conceived of the study, participated in its design, and helped to interpret the data and draft the manuscript. All authors read, critiqued, and approved the final manuscript.
All data from this study is publicly available in the ImmPort database, per the Human Immunology Project Consortium (HIPC) timeline for public data sharing. http://www.immuneprofiling.org/hipc/page/showPage?pg=dataShare
References
- 1.Haralambieva IH, Painter SD, Kennedy RB, Ovsyannikova IG, Lambert ND, Goergen KM, et al. The Impact of Immunosenescence on Humoral Immune Response Variation after Influenza A/H1N1 Vaccination in Older Subjects. PLos ONE. 2015;10(3):e0122282. doi: 10.1371/journal.pone.0122282. [DOI] [PMC free article] [PubMed] [Google Scholar]
- 2.Lambert ND, Ovsyannikova IG, Pankratz VS, Jacobson RM, Poland GA. Understanding the immune response to seasonal influenza vaccination in older adults: a systems biology approach. Expert Rev Vaccines. 2012;11(8):985–94. doi: 10.1586/erv.12.61. [DOI] [PMC free article] [PubMed] [Google Scholar]
- 3.Skowronski DM, Tweed SA, De Serres G. Rapid decline of influenza vaccine-induced antibody in the elderly: is it real, or is it relevant? J Infect Dis. 2008;197(4):490–502. doi: 10.1086/524146. [DOI] [PubMed] [Google Scholar]
- 4.McElhaney JE, Effros RB. Immunosenescence: what does it mean to health outcomes in older adults? Curr Opin Immunol. 2009;21(4):418–24. doi: 10.1016/j.coi.2009.05.023. [DOI] [PMC free article] [PubMed] [Google Scholar]
- 5.McElhaney JE. Influenza vaccine responses in older adults. Ageing Res Rev. 2011;10(3):379–88. doi: 10.1016/j.arr.2010.10.008. [DOI] [PMC free article] [PubMed] [Google Scholar]
- 6.Targonski PV, Jacobson RM, Poland GA. Immunosenescence: Role and measurement in influenza vaccine response among the elderly. Vaccine. 2007;25(16):3066–9. doi: 10.1016/j.vaccine.2007.01.025. [DOI] [PubMed] [Google Scholar]
- 7.Goronzy JJ, Weyand CM. Understanding immunosenescence to improve responses to vaccines. Nat Immunol. 2013 May;14(5):428–36. doi: 10.1038/ni.2588. [DOI] [PMC free article] [PubMed] [Google Scholar]
- 8.O’Connor JE, Herrera G, Martinez-Romero A, de Oyanguren FS, Diaz L, Gomes A, et al. Systems Biology and immune aging. Immunology Letters. 2014 Nov;162(1 Pt B):334–45. doi: 10.1016/j.imlet.2014.09.009. [DOI] [PubMed] [Google Scholar]
- 9.Bucasas KL, Franco LM, Shaw CA, Bray MS, Wells JM, Nino D, et al. Early patterns of gene expression correlate with the humoral immune response to influenza vaccination in humans. J Infect Dis. 2011;203(7):921–9. doi: 10.1093/infdis/jiq156. [DOI] [PMC free article] [PubMed] [Google Scholar]
- 10.Franco LM, Bucasas KL, Wells JM, Nino D, Wang X, Zapata GE, et al. Integrative genomic analysis of the human immune response to influenza vaccination. Elife. 2013;2:e00299. doi: 10.7554/eLife.00299. [DOI] [PMC free article] [PubMed] [Google Scholar]
- 11.Nakaya HI, Wrammert J, Lee EK, Racioppi L, Marie-Kunze S, Haining WN, et al. Systems biology of seasonal influenza vaccination in humans. Nat Immunol. 2011;12(8):786–95. doi: 10.1038/ni.2067. [DOI] [PMC free article] [PubMed] [Google Scholar]
- 12.Furman D, Jojic V, Kidd B, Shen-Orr S, Price J, Jarrell J, et al. Apoptosis and other immune biomarkers predict influenza vaccine responsiveness. Mol Syst Biol. 2013;9:659. doi: 10.1038/msb.2013.15. [DOI] [PMC free article] [PubMed] [Google Scholar]
- 13.Tsang JS, Schwartzberg PL, Kotliarov Y, Biancotto A, Xie Z, Germain RN, et al. Global analyses of human immune variation reveal baseline predictors of postvaccination responses. Cell. 2014 Apr 10;157(2):499–513. doi: 10.1016/j.cell.2014.03.031. [DOI] [PMC free article] [PubMed] [Google Scholar]
- 14.Wrammert J, Koutsonanos D, Li GM, Edupuganti S, Sui J, Morrissey M, et al. Broadly cross-reactive antibodies dominate the human B cell response against 2009 pandemic H1N1 influenza virus infection. J Exp Med. 2011;208(1):181–93. doi: 10.1084/jem.20101352. [DOI] [PMC free article] [PubMed] [Google Scholar]
- 15.Li GM, Chiu C, Wrammert J, McCausland M, Andrews SF, Zheng NY, et al. Pandemic H1N1 influenza vaccine induces a recall response in humans that favors broadly cross-reactive memory B cells. Proc Natl Acad Sci USA. 2012 doi: 10.1073/pnas.1118979109. [DOI] [PMC free article] [PubMed] [Google Scholar]
- 16.Painter SD, Haralambieva IH, Ovsyannikova IG, Grill DE, Poland GA. Detection of Influenza A/H1N1-Specific Human IgG-Secreting B Cells in Older Adults by ELISPOT Assay. Viral Immunol. 2014 Mar;27(2):32–8. doi: 10.1089/vim.2013.0099. [DOI] [PMC free article] [PubMed] [Google Scholar]
- 17.Salk HM, Haralambieva IH, Ovsyannikova IG, Goergen KM, Poland GA. Granzyme B ELISPOT assay to measure influenza-specific cellular immunity. J Immunol Methods. 2013 Sep 18;398–399:44–50. doi: 10.1016/j.jim.2013.09.007. [DOI] [PMC free article] [PubMed] [Google Scholar]
- 18.Ovsyannikova IG, White SJ, Larrabee BR, Grill DE, Jacobson RM, Poland GA. Leptin and leptin-related gene polymorphisms, obesity, and influenza A/H1N1 vaccine-induced immune responses in older individuals. Vaccine. 2014 Feb 7;32(7):881–7. doi: 10.1016/j.vaccine.2013.12.009. [DOI] [PMC free article] [PubMed] [Google Scholar]
- 19.Haralambieva IH, Oberg AL, Ovsyannikova IG, Kennedy RB, Grill DE, Middha S, et al. Genome-wide characterization of transcriptional patterns in high and low antibody responders to rubella vaccination. PLos ONE. 2013;8(5):e62149. doi: 10.1371/journal.pone.0062149. [DOI] [PMC free article] [PubMed] [Google Scholar]
- 20.Kennedy RB, Oberg AL, Ovsyannikova IG, Haralambieva IH, Grill DE, Poland GA. Transcriptomic profiles of high and low antibody responders to smallpox vaccine. Genes Immunity. 2013;14(5):277–85. doi: 10.1038/gene.2013.14. [DOI] [PMC free article] [PubMed] [Google Scholar]
- 21.Ovsyannikova IG, Oberg AL, Kennedy RB, Goergen KM, Haralambieva IH, Lambert ND, et al. Gene signatures related to HAI response following influenza A/H1N1 vaccine in older individuals. Immunochemistry & Immunobiology Gordon Research Conference; Newry, ME. 2014. [Google Scholar]
- 22.Reinert K, Langmead B, Weese D, Evers DJ. Alignment of Next-Generation Sequencing Reads. Annu Rev Genomics Hum Genet. 2015;16:133–51. doi: 10.1146/annurev-genom-090413-025358. [DOI] [PubMed] [Google Scholar]
- 23.Quinlan AR, Hall IM. BEDTools: a flexible suite of utilities for comparing genomic features. Bioinformatics. 2010 Mar 15;26(6):841–2. doi: 10.1093/bioinformatics/btq033. [DOI] [PMC free article] [PubMed] [Google Scholar]
- 24.Trapnell C, Pachter L, Salzberg SL. TopHat: discovering splice junctions with RNA-Seq. Bioinformatics. 2009 May 1;25(9):1105–11. doi: 10.1093/bioinformatics/btp120. [DOI] [PMC free article] [PubMed] [Google Scholar]
- 25.Oberg AL, Vitek O. Statistical design of quantitative mass spectrometry-based proteomic experiments. J Proteome Res. 2009;8(5):2144–56. doi: 10.1021/pr8010099. [DOI] [PubMed] [Google Scholar]
- 26.Oberg AL, Mahoney DW. Statistical methods for quantitative mass spectrometry proteomic experiments with labeling. BMC Bioinformatics. 2012;13(Suppl 16):S7. doi: 10.1186/1471-2105-13-S16-S7. [DOI] [PMC free article] [PubMed] [Google Scholar]
- 27.Oberg AL, McKinney BA, Schaid DJ, Pankratz VS, Kennedy RB, Poland GA. Lessons learned in the analysis of high-dimensional data in vaccinomics. Vaccine. 2015 May 6; doi: 10.1016/j.vaccine.2015.04.088. S0264-410X(15):00574–5. [DOI] [PMC free article] [PubMed] [Google Scholar]
- 28.Oberg AL, Kennedy RB, Li P, Ovsyannikova IG, Poland GA. Systems biology approaches to new vaccine development. Current Opinion in Immunology. 2011;23(3):436–43. doi: 10.1016/j.coi.2011.04.005. [DOI] [PMC free article] [PubMed] [Google Scholar]
- 29.Hastie T, Tibshirani R, Friedman J. The Elements of Statistical Learning: Data Mining, Inference, and Prediction. Second. Springer; Feb 09, 2009. (Springer Series in Statistics). 2009. [Google Scholar]
- 30.Friedman J, Hastie T, Tibshirani R. Regularization Paths for Generalized Linear Models via Coordinate Descent. J Stat Softw. 2010;33(1):1–22. [PMC free article] [PubMed] [Google Scholar]
- 31.Prasad TS, Kandasamy K, Pandey A. Human Protein Reference Database and Human Proteinpedia as discovery tools for systems biology. Methods Mol Biol. 2009;577:67–79. doi: 10.1007/978-1-60761-232-2_6. [DOI] [PubMed] [Google Scholar]
- 32.Rolland T, Tasan M, Charloteaux B, Pevzner SJ, Zhong Q, Sahni N, et al. A proteome-scale map of the human interactome network. Cell. 2014 Nov 20;159(5):1212–26. doi: 10.1016/j.cell.2014.10.050. [DOI] [PMC free article] [PubMed] [Google Scholar]
- 33.Schaefer CF, Anthony K, Krupa S, Buchoff J, Day M, Hannay T, et al. PID: the Pathway Interaction Database. Nucl Acids Res. 2009 Jan;37:D674–9. doi: 10.1093/nar/gkn653. (Database issue) [DOI] [PMC free article] [PubMed] [Google Scholar]
- 34.Szklarczyk D, Franceschini A, Kuhn M, Simonovic M, Roth A, Minguez P, et al. The STRING database in 2011: functional interaction networks of proteins, globally integrated and scored. Nucl Acids Res. 2011 Jan;39:D561–8. doi: 10.1093/nar/gkq973. (Database issue) [DOI] [PMC free article] [PubMed] [Google Scholar]
- 35.Shannon P, Markiel A, Ozier O, Baliga NS, Wang JT, Ramage D, et al. Cytoscape: a software environment for integrated models of biomolecular interaction networks. Genome Res. 2003 Nov;13(11):2498–504. doi: 10.1101/gr.1239303. [DOI] [PMC free article] [PubMed] [Google Scholar]
- 36.AllegroViva. AllegroLayout. 2015 http://allegroviva.com/allegrolayout2. Date accessed: May 11, 2016.
- 37.Ashburner M, Ball CA, Blake JA, Botstein D, Butler H, Cherry JM, et al. Gene ontology: tool for the unification of biology. The Gene Ontology Consortium. Nat Genet. 2000;25(1):25–9. doi: 10.1038/75556. [DOI] [PMC free article] [PubMed] [Google Scholar]
- 38.Rhee SY, Wood V, Dolinski K, Draghici S. Use and misuse of the gene ontology annotations. Nat Rev Genet. 2008 Jul;9(7):509–15. doi: 10.1038/nrg2363. [DOI] [PubMed] [Google Scholar]
- 39.Kanehisa M, Goto S. KEGG: kyoto encyclopedia of genes and genomes. Nucl Acids Res. 2000 Jan 1;28(1):27–30. doi: 10.1093/nar/28.1.27. [DOI] [PMC free article] [PubMed] [Google Scholar]
- 40.Kanehisa M, Goto S, Sato Y, Kawashima M, Furumichi M, Tanabe M. Data, information, knowledge and principle: back to metabolism in KEGG. Nucl Acids Res. 2014 Jan;42:D199–205. doi: 10.1093/nar/gkt1076. (Database issue) [DOI] [PMC free article] [PubMed] [Google Scholar]
- 41.Zimmermann MT, Oberg AL, Grill DE, Ovsyannikova IG, Haralambieva IH, Kennedy RB, et al. System-Wide Associations between DNA-Methylation, Gene Expression, and Humoral Immune Response to Influenza Vaccination. PLos ONE. 2016;11(3):e0152034. doi: 10.1371/journal.pone.0152034. [DOI] [PMC free article] [PubMed] [Google Scholar]
- 42.Curtis DJ, Muresan P, Nachman S, Fenton T, Richardson KM, Dominguez T, et al. Characterization of functional antibody and memory B-cell responses to pH1N1 monovalent vaccine in HIV-infected children and youth. PLos ONE. 2015;10(3):e0118567. doi: 10.1371/journal.pone.0118567. [DOI] [PMC free article] [PubMed] [Google Scholar]
- 43.Andrews SF, Kaur K, Pauli NT, Huang M, Huang Y, Wilson PC. High preexisting serological antibody levels correlate with diversification of the influenza vaccine response. J Virol. 2015 Mar;89(6):3308–17. doi: 10.1128/JVI.02871-14. [DOI] [PMC free article] [PubMed] [Google Scholar]
- 44.Napolitani G, Rinaldi A, Bertoni F, Sallusto F, Lanzavecchia A. Selected Toll-like receptor agonist combinations synergistically trigger a T helper type 1-polarizing program in dendritic cells. Nat Immunol. 2005 Aug;6(8):769–76. doi: 10.1038/ni1223. [DOI] [PMC free article] [PubMed] [Google Scholar]
- 45.Amit I, Garber M, Chevrier N, Leite AP, Donner Y, Eisenhaure T, et al. Unbiased reconstruction of a mammalian transcriptional network mediating pathogen responses. Science. 2009;326(5950):257–63. doi: 10.1126/science.1179050. [DOI] [PMC free article] [PubMed] [Google Scholar]
- 46.Furman D, Hejblum BP, Simon N, Jojic V, Dekker CL, Thiebaut R, et al. Systems analysis of sex differences reveals an immunosuppressive role for testosterone in the response to influenza vaccination. Proc Natl Acad Sci USA. 2014 Jan 14;111(2):869–74. doi: 10.1073/pnas.1321060111. [DOI] [PMC free article] [PubMed] [Google Scholar]
- 47.Ravi LI, Liang L, Wong PS, Brown G, Tan BH, Sugrue RJ. Increased hydroxymethylglutaryl coenzyme A reductase activity during respiratory syncytial virus infection mediates actin dependent inter-cellular virus transmission. Antiviral Res. 2013 Oct;100(1):259–68. doi: 10.1016/j.antiviral.2013.08.012. [DOI] [PubMed] [Google Scholar]
- 48.van ’t Wout AB, Swain JV, Schindler M, Rao U, Pathmajeyan MS, Mullins JI, et al. Nef induces multiple genes involved in cholesterol synthesis and uptake in human immunodeficiency virus type 1-infected T cells. J Virol. 2005 Aug;79(15):10053–8. doi: 10.1128/JVI.79.15.10053-10058.2005. [DOI] [PMC free article] [PubMed] [Google Scholar]
- 49.Kistowska M, Rossy E, Sansano S, Gober HJ, Landmann R, Mori L, et al. Dysregulation of the host mevalonate pathway during early bacterial infection activates human TCR gamma delta cells. Eur J Immunol. 2008 Aug;38(8):2200–9. doi: 10.1002/eji.200838366. [DOI] [PubMed] [Google Scholar]
- 50.Tam VC, Quehenberger O, Oshansky CM, Suen R, Armando AM, Treuting PM, et al. Lipidomic profiling of influenza infection identifies mediators that induce and resolve inflammation. Cell. 2013 Jul 3;154(1):213–27. doi: 10.1016/j.cell.2013.05.052. [DOI] [PMC free article] [PubMed] [Google Scholar]
- 51.Fessler MB. Regulation of Adaptive Immunity in Health and Disease by Cholesterol Metabolism. Curr Allergy Asthma Rep. 2015 Aug;15(8):48. doi: 10.1007/s11882-015-0548-7. [DOI] [PMC free article] [PubMed] [Google Scholar]
- 52.Szili D, Banko Z, Toth EA, Nagy G, Rojkovich B, Gati T, et al. TGFbeta activated kinase 1 (TAK1) at the crossroad of B cell receptor and Toll-like receptor 9 signaling pathways in human B cells. PLos ONE. 2014;9(5):e96381. doi: 10.1371/journal.pone.0096381. [DOI] [PMC free article] [PubMed] [Google Scholar]
- 53.Agrawal S, Gupta S. TLR1/2, TLR7, and TLR9 signals directly activate human peripheral blood naive and memory B cell subsets to produce cytokines, chemokines, and hematopoietic growth factors. J Clin Immunol. 2011 Feb;31(1):89–98. doi: 10.1007/s10875-010-9456-8. [DOI] [PMC free article] [PubMed] [Google Scholar]
Associated Data
This section collects any data citations, data availability statements, or supplementary materials included in this article.