



Abstract
This article is a methodological review to help the intensivist gain insights into the classic and sometimes arcane maze of national databases and methodologies used to determine and analyze the intensive care unit (ICU) bed supply, occupancy rates, and costs in the United States (US). Data for total ICU beds, use and occupancy can be derived from two large national healthcare databases: the Healthcare Cost Report Information System (HCRIS) maintained by the federal Centers for Medicare and Medicaid Services (CMS) and the proprietary Hospital Statistics of the American Hospital Association (AHA). Two costing methodologies can be used to calculate ICU costs: the Russell equation and national projections. Both methods are based on cost and use data from the national hospital datasets or from defined groups of hospitals or patients. At the national level, an understanding of US ICU beds, use and cost helps provide clarity to the width and scope of the critical care medicine (CCM) enterprise within the US healthcare system. This review will also help the intensivist better understand published studies on administrative topics related to CCM and be better prepared to participate in their own local hospital organizations or regional CCM programs.
Introduction
In 2005, intensive care unit (ICU) beds in the United States (US) accounted for 15% of hospital beds; occupancy rates were estimated at 68% and costs were roughly $82 billion, or 0.66% of the gross domestic product (GDP) (1). These data points are highly referenced as starting parameters for the critical care medicine (CCM) landscape in the US and are the basis for the Society of Critical Care Medicine (SCCM) critical care statistics sheet (2). However, there are many opinions about the utilization and costs of ICU beds and CCM resources. Thought leaders have begun to address the ramifications of increasing or decreasing the national ICU bed supply (3–5). Along the way, two schools have emerged. The first suggests that CCM uses too many hospital beds, and ineffectively at that, and a disproportionate quantity of healthcare resources (6). The second contends that additional ICU resources are needed, but also believes that ICU beds can be used more efficiently (7).
Whatever one’s opinion on these matters, intensivists today are increasingly being asked to get more involved in hospital and healthcare network oversight of their critical care operations and to address a host of “hot-button” issues. These include complying with highly publicized patient safety and quality mandates involving CCM, participating in hospital performance metrics, optimizing ICU design, staffing and coverage mechanisms, maximizing ICU throughput and patient flow, dealing with capacity strain, rationing ICU beds, containing ICU costs, standardizing ICU technologies and alarms, developing and managing rapid response and sepsis teams, fostering interdisciplinary collaboration and interacting with hospital networks (8–18).
The purpose of this methodological review is to help the intensivist gain insight into the classic and sometimes arcane national databases and methodologies used over the past few decades to analyze and determine ICU bed numbers, use, and costs in the US. Our goal is to examine these topics from the “40,000 foot vantage point” and cultivate greater awareness of the width and scope of the national CCM enterprise. Armed with a broader perspective of administrative data, the intensivist may also attain an enhanced understanding of published studies on administrative topics related to CCM and be better able to participate in their own hospital’s organization or regional CCM programs.
US Hospital Databases and CCM Data Sources
Inpatient healthcare delivery in US hospitals is extensively tracked and trended by two national databases: the Healthcare Cost Report Information System (HCRIS) maintained by the federal Centers for Medicare and Medicaid Services (CMS) (19) and the proprietary Hospital Statistics of the American Hospital Association (AHA) (20). Importantly, “current” data disseminated from these two databases are actually “old,” because these large datasets do not become stable for several years following initial data acquisition.
HCRIS is built upon hospital cost reports completed annually on a mandatory basis by all non-federal hospitals that obtain Medicare funds. The HCRIS reports are audited by federally assigned Medicare Administrative Contractors. CMS does not publish detailed information from HCRIS, but selected data is available online for study (19) directly by investigators. Alternatively, the HCRIS master files may be analyzed by third-party vendors (1;21).
The AHA dataset contains information obtained from the yearly AHA surveys that are voluntarily completed by 83%–85% of US hospitals (20). The AHA maintains a quality assurance system to test for data reliability and validity and to account for data estimates for missing hospitals. A select set of the complete AHA hospital data is available in the annual AHA Hospital Statistics monographs for purchase (20). Customized analysis of the entire data set is obtained either through the AHA Health Forum (AHA Health Forum LLC, Chicago, IL) or through acquisition of the entire AHA dataset.
As relates to CCM, the HCRIS and AHA datasets supply several high level data elements on ICU beds and days. Unfortunately, national data of potentially great interest to CCM researchers related to patient outcomes, ICU bed staffing, appropriateness and flexibility of ICU bed use, discharges, throughput, length of stay, occupancy, severity of illness scoring, and focused costs are not available in these datasets. To date, this type of information has been extracted primarily from Project IMPACT, a small ICU targeted dataset of approximately 100 ICUs in 100 hospitals (Cerner Corporation, Kansas City, MO). Project Impact, however, stopped accruing data in the first quarter of 2009 and was transitioned to APACHE Outcomes with approximately 135 ICUs in 55 hospitals (Cerner Corporation, Kansas City, MO).
ICU Beds, Days and Occupancy
ICU beds
The HCRIS and AHA datasets both track ICU bed totals within pre-designated ICU types that we classify into three categories: adult, child, and special (Table 1). The AHA also collects data on the number of ICUs (20), whereas HCRIS does not. The ICU bed types differ across the two datasets (22). Hospitals, however, are left on their own to classify their ICU beds within the bed types because ICU bed allocation instructions are minimal in both datasets. Additionally, the ICU bed type classifications in both datasets have not been updated in several years; thus hospitals may be challenged as to the exact assignment of their specialized ICU beds.
Table 1.
ICU beds and units by bed types: Healthcare Cost Report Information System (HCRIS) and American Hospital Association (AHA) Statistics Datasets
| ICU types | HCRIS | AHA |
|---|---|---|
| Adult | Beds | Beds (ICUs)* |
|
| ||
| Intensive care | X | |
| Medical-surgical | X | |
| Coronary/cardiac care | X | X |
| Surgical | X | |
| Trauma | Xa | |
| Burn | X | X |
| Detoxification | Xa | |
| Psychiatric | Xa | |
| Other intensive care | X | |
|
| ||
| Child | ||
|
| ||
| Pediatric | Xa | X |
| Neonatal | Xa | X |
| Premature | Xa | |
|
| ||
| Special | ||
|
| ||
| Other special care | Includes 6 ICU typesa | Xb |
Other Special care:
HCRIS includes 6 ICU adult and child bed types;
AHA includes observation, step down or intermediate beds.
The number of ICUs in the AHA dataset actually refers to the number of hospitals offering this type of ICU service and may, therefore, underestimate the real number of ICUs in the US.
For example, HCRIS maintains separate ICU, surgical ICU and trauma ICU categories while the AHA maintains a combined medical-surgical ICU and a non-specific “Other” intensive care category (Table 1). HCRIS includes detoxification and psychiatric ICUs that are long obsolete. Neither dataset includes a separate category for neuroscience ICUs that are so prevalent today in academic medical centers. Neuroscience type ICU beds would probably be included in the “ICU” category in HCRIS and in the “Other” intensive care in AHA. Thus, without an overhaul of the ICU types in these datasets, it would not be possible, for example, to determine today the number of Neuroscience type (i.e. Neurological, Neurosurgical or Stroke) ICUs or their bed count in the US without a hospital survey specifically targeting this question.
Both HCRIS and the AHA also include a confusing category (Table 1) known as “Other special care.” This term was popular in the 1960s when ICUs were first being developed; currently, this nomenclature is rarely used. “Other special care” refers to six distinct ICU types (includes adult and child) in HCRIS; whereas “Other special care” refers to non-ICU stepdown, intermediate or progressive units within the AHA (Table 1). In contrast, HCRIS does not categorize stepdown, intermediate or progressive beds. Thus, the availability of stepdown beds and units, a category of beds so integral to CCM use and throughput (23) can potentially be tracked by the AHA, but not at all in HCRIS.
Table 2 shows the comparison of ICU bed totals by ICU type between the HCRIS and AHA datasets in 2010 (unpublished data). The HCRIS data reflects acute care and children’s hospitals nationwide. The AHA data is from their community hospital category which we feel is comparable to HCRIS acute care. The number of reporting hospitals and total hospital beds are similar between the two datasets. However, there was a 12% CCM bed difference (12,231 beds) between the two datasets with HCRIS posting 103,900 ICU beds and the AHA reporting 91,669 beds. This difference results in a higher percentage of hospital beds dedicated to CCM within HCRIS than in the AHA (16.2% vs. 13.6%). It is possible that the stepdown/intermediate/progressive beds reported by the AHA as “Other special care” are actually classified as ICU beds within HCRIS, but this is merely speculative.
Table 2.
ICU beds and units by bed types: Healthcare Cost Report Information System (HCRIS) and American Hospital Association (AHA) Statistics Datasets: 2010 data
| ICU types | HCRIS | AHA |
|---|---|---|
| Adult | Beds | Beds (ICUs) |
|
| ||
| Intensive care | 62,491 | |
| Medical-surgical | 43,885 (2,829) | |
| Coronary/cardiac care | 11,582 | 15,254 (1,316) |
| Surgical | 4,790 | |
| Trauma | 1,260a | |
| Burn | 1,354 | 1,163 (163) |
| Detoxification | 1,794a | |
| Psychiatric | 146a | |
| Other intensive care | 6,526 (465) | |
|
| ||
| Child | ||
|
| ||
| Pediatric | 1,196a | 4,586 (423) |
| Neonatal | 18,198a | 20,255 (923) |
| Premature | 369a | |
|
| ||
| Special | ||
|
| ||
| Other special carea, b | Includes 6 ICU typesa | 20,764b |
|
| ||
| Totals | ||
|
| ||
| ICU beds | 103,900 | 91,669c |
| ICUsd | NA | 6,119 |
| Hospital beds | 641,395 | 672,737 |
| ICU/Hospital beds (%) | 16.2 | 13.6 |
| Intermediate beds | NA | 20,764b |
| Hospitals reporting ICU beds | 2,977 | 3,138 |
Other Special care:
HCRIS includes 6 ICU adult and child bed types;
AHA includes observation, step down or intermediate beds.
AHA ICU bed totals do not include other special care beds.
The number of ICUs are not available in HCRIS; the number of ICUs in the AHA dataset actually refers to the number of hospitals offering this type of ICU service and may, therefore, underestimate the real number of ICUs in the US.
Data sources: HCRIS: HCRIS Master File - data release January 30, 2013, Acute care and children’s hospitals, HealthDataInsights, Las Vegas, NV; AHA Annual Statistics survey database FY 2010, Community Hospitals, Chicago, Health Forum LLC, an AHA company. Premier Healthcare Solutions Inc
ICU Days and Occupancy Rates
HCRIS tracks ICU days and days available for each ICU bed category. The AHA does not track ICU days or any other parameter of ICU bed use (i.e., daily census or admissions). Days can be used as a loose proxy for bed use (24), and therefore, an average of all midnight ICU occupancy rates for the studied hospitals can be calculated (days/days available) from HCRIS (1). For example, using HCRIS data, we reported that ICUs in larger hospitals (>500 beds) have higher occupancy rates than in smaller (<300 beds) hospitals (25). HCRIS data has also shown that between 2000 and 2005, national ICU occupancy rates ranged from 65% and 68% (1). In 2010, the average national ICU occupancy rate was 66% (unpublished data).
We recognize that the occupancy data calculated from HCRIS is limited by its lack of granularity and nuance. Ideally, we want to know much more than basic midnight ICU bed occupancy rates (26). For example, the 2003 SCCM survey determined an “effective occupancy rate,” based upon six throughput parameters (patients in ICU, patients waiting to get into ICU, patients awaiting transfer from ICU, total beds in ICU, closed ICU beds, expansion ICU beds) by ICU type, hospital type and by hospital size (27). Occupancy was highest in Surgical ICUs (79%), ICUs in federal hospitals (80%), and ICUs of hospitals with 301–750 beds (77%). An analysis of ICUs participating in Project Impact (2005–2007) studied occupancy as a continuous time variable (mean hourly occupancy 68.2%), and by ICU size (higher in ICUs with fewer beds) and hospital type (higher in academic hospitals) (24). A second study also using Project Impact data found that mortality remained stable despite high and low occupancy (census) days (28).
Unfortunately, occupancy data with fine distinctions are not available from the HCRIS and AHA datasets. Nevertheless, from the perspectives of hospital and CCM administrators, average occupancy rates across all inpatient areas play a major role in hospital management due to their easy calculation, hospital-wide distribution, and simple message. Therefore, the CCM community should be aware of national occupancy type calculations (mean midnight occupancy rate) and their administrative and clinical imperfections in order to deal with this type of data even at the local level.
In terms of ICU utilization, HCRIS also tracks Medicare and Medicaid ICU days but only for traditional fee-for-service beneficiaries; Medicare and Medicaid managed care ICU days are not included (1). Medicare ICU days, for fee-for-service discharges at Medicare certified hospitals, are also tracked within the Medicare Provider Analysis and Review (MEDPAR) File (29), another national CMS dataset. The MEDPAR data originates from hospital bills. Therein, ICU days are assigned using Uniform Billing (UB) 04 revenue (billing) codes for intensive care and coronary care (CCU) as developed by the National Uniform Billing Committee (NUBC) (Table 3) (30). Of note, the UB 04 CCM codes, like the AHA and HCRIS ICU bed types (Table 1), have not been updated in several years.
Table 3.
Uniform Billing (UB) 04 Critical care (Intensive and Coronary Care) revenue (billing) codes: Medicare Provide Analysis and Review (MEDPAR) File
| MEDPAR Research Categories |
UB 04 Revenue (Billing) Codes | |
|---|---|---|
| Intensive Carea | Intensive Care | |
|
| ||
| General classification | 0200 | |
| Surgical | 0201 | |
| Medical | 0202 | |
| Pediatric | 0203 | |
| Psychiatric | 0204 | |
| Intermediatec | 0206 | |
| Burn care | 0207 | |
| Trauma | 0208 | |
| Other Sub acute care | 0209 | |
|
| ||
| Coronary Careb | Coronary Care | |
|
| ||
| General classification | 0210 | |
| Myocardial infarction | 0211 | |
| Pulmonary care | 0212 | |
| Heart transplant | 0213 | |
| Intermediatec | 0214 | |
| Other Coronary Care | 0219 | |
Intensive care contains aggregate data from the ICU revenue codes 0200–0209
Coronary care contains aggregate data from the CCU revenue codes 0210–0219
Intermediate days may include days in observation, step down or intermediate beds (33)
MEDPAR reports in the past aggregated CCM data within the “intensive care” and “coronary care” categories (Table 3) (31;32). Researchers today, however, should focus only on the individual codes because the ICU and CCU aggregates limit the granularity of CCM analyses. The aggregates include intermediate codes. The intermediate designation may include intermediate, progressive or step-down days and not actual ICU or CCU days (33). Of note, there is no comparable dataset like MEDPAR for Medicaid discharges that tracks hospital and ICU stay data at the national level.
Critical care medicine cost calculations
The national cost of CCM cannot be determined from either the AHA or HCRIS datasets alone due to inherent fiscal data limitations within these administrative databases. Investigators instead have estimated the very “big picture” of CCM costs using one of two approaches: the Russell equation or national projections based upon use and cost data from selected groups of hospitals (Figure 1) (34). The Russell equation is a top-down (attributable costing) approach that looks at broad patient populations without any patient-level cost detail (35;36). The national projection method relies upon a bottom-up (micro-costing) approach that commonly begins with all direct and indirect costs of ICU patients in selected hospitals. A more detailed discussion of costing components (i.e., direct and indirect, fixed and variable, marginal and opportunity) that underscore CCM healthcare economics and policy is beyond the scope of this methodological review and the reader is referred to prior articles (35;37;38).
Figure 1.
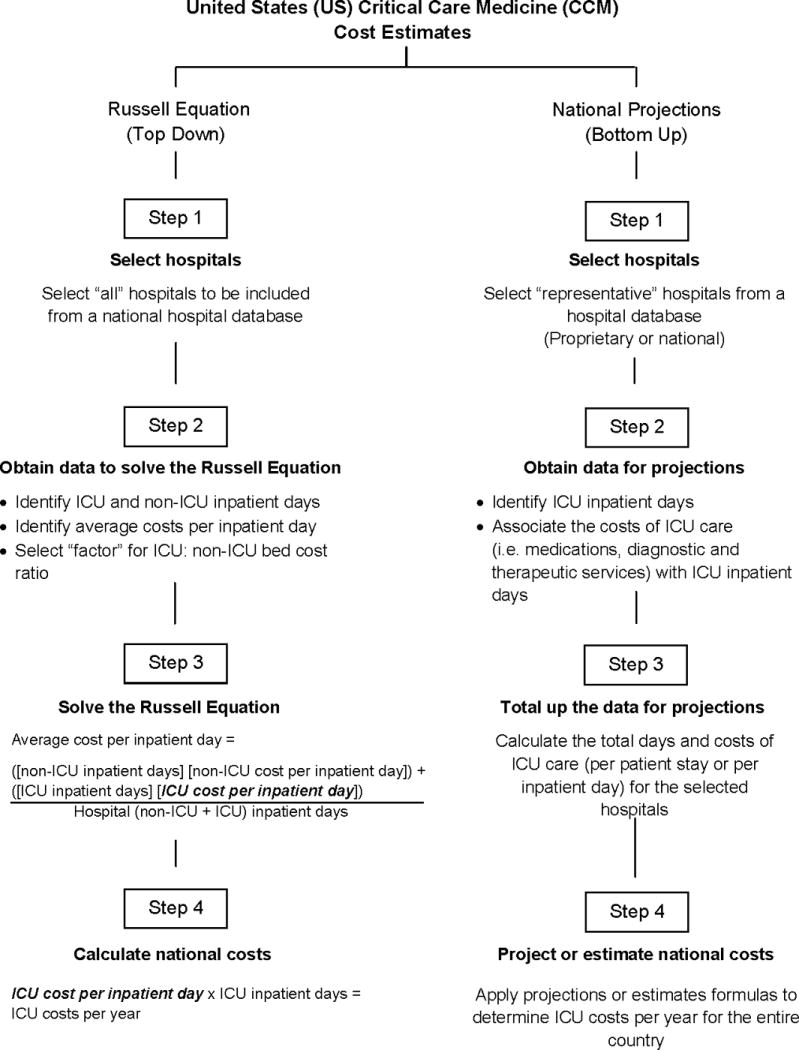
Both CCM cost estimate methods, the Russell equation (Left panel) and the national projections (Right panel), involve four steps. The first step identifies the hospitals to be studied. The second step obtains the data to solve the Russell equation by identifying the ICU and non-ICU days and obtaining the average inpatient cost per day (Left panel, Step 2) or identifying ICU days and the associated ICU costs (Right panel, Step 2). The third step either solves for the ICU cost per inpatient day [(ICU cost per inpatient day = (ICU: non-ICU bed cost ratio) × (non-ICU cost per inpatient day)] in the Russell equation (Left panel, Step 3) or the total costs of ICU care in the selected hospitals (Right panel, Step 3). The fourth step translates the ICU cost per inpatient day to national costs (Left panel, Step 4) or “projects or estimates” the ICU days and costs from the patients of the selected hospitals to the national level using the hospitals’ projection “weights” as well as formulas for projection or estimation (Right panel, Step 4). The figure is reprinted with permission from Intensive Care Medicine (34).
Russell equation as a national solution for CCM costs
In 1984, Congress published the Health Technology Case Study on ICU Outcomes, Costs, and Decision making that popularized the “Russell Equation” for determining CCM costs (39). The Russell equation has since undergone several iterations, and today appears to be the most commonly used national CCM costing methodology, arguably the gold standard (39).
The first step in solving the Russell equation (Figure 1 - Left panel) starts with selecting hospitals for national study using a national hospital database. Within these hospitals, the ICU and non-ICU inpatient days are determined (Figure 1, Left panel, Step 2). The average cost per inpatient day, the core fiscal parameter of the equation, is also obtained from a national dataset, and a factor that relates the difference in costs of care between ICU and non-ICU (ward) beds, the ICU: non-ICU bed cost ratio, is selected. These parameters are then inserted into the Russell equation (Figure, Left panel, Step 3) which solves for non-ICU and ICU costs per inpatient day by estimating the proportion of daily inpatient costs likely to be incurred by patients in the ICU. The average ICU cost per inpatient day is then multiplied by the number of national ICU inpatient days to determine the ICU costs per year (Figure, Left panel, Step 4).
The authors have used HCRIS to identify US acute care hospitals with ICU beds and to determine the ICU and non-ICU costs (1;21). We have used the comparable AHA dataset’s “total nonfederal short-term general” hospital category to obtain the “adjusted expenses per inpatient day” (20) to represent the average cost per inpatient day. Finally, since the 1980s, we have used a 3:1 value for the ICU to non-ICU bed cost ratio to allow for long term CCM cost analysis (1985 to 2005) (1;21); other values also with yearly individualization have been suggested (32;39). Our recent calculations using the Russell equation (1;21) demonstrate that ICU costs per day in 2010 were $4,300 and CCM costs per year in 2010 were $108 billion (unpublished data). Nationally, in 2010, CCM accounted for 13.2% of hospital costs, 4.14% of National Heath Expenditures (NHE) and 0.74% of the US GDP.
Although the ICU cost per inpatient day as calculated by the Russell equation permits an estimate of the national cost of CCM (Figure 1- Left panel, Step 4), the concept of ICU cost per day as a general “benchmark” for ICU daily costs, has inherent limitations. This is because the costs of an ICU day are not the same across the entire spectrum of hospitals, regions, ICU types and ICU patients (40). Nor are dynamic cost changes that occur within the entire range of an ICU length of stay captured (i.e., the first days of an ICU stay cost more than the later days) (40;41).
Russell equation as a cost adjunct for determining CCM costs for Medicare and the Department of Veterans Affairs
MEDPAR, similar to the other major datasets, is limited in determining the ICU cost per day alone for Medicare inpatients. MEDPAR tracks two types of hospital charges: a) room and board charges associated with the number of days in the ICU, CCU or ward, and b) total charges (i.e., medications, laboratory and imaging studies) related to the inpatient stay. However, MEDPAR does not associate the individualized charges to each ICU day, therefore, the aggregate ICU charge per day cannot be determined.
Cooper and colleagues used the MEDPAR file to examine the use and costs of CCM among Medicare inpatients for fiscal year 2000 (31). These investigators utilized multiple datasets including the CMS Impact File Hospital Inpatient Prospective Payment System (IPPS), cost to charge ratios, the Federal Register, as well as the Russell equation as a sensitivity tool. Their goal was to analyze the distribution of cost and payments overall, by hospital type and Diagnosis Related Groups (DRG) for a host of diagnoses among ICU, CCU, and ward patients. The study found that few DRGs had enough ICU exposure to ensure adequate payment and that additional DRGs for common ICU conditions were needed.
A second study by Millbrandt et al, using similar datasets, analyzed Medicare resource use between 1994 and 2004 and compared CCM and ward charges using the Russell equation to determine the annual cost differential between ICU and non-ICU areas (ICU to non-ICU cost ratio) (32). The investigators reported that the ratio ranged from 2.55 to 1.73, and that adjusted ICU daily costs remained stable over a decade. Early iterations of the Russell equation were also studied within the Department of Veterans Affairs (DVA) in conjunction with the DVA cost distribution report between 1986 and 1992 (42). The authors found that the Russell equation was comparable to the DVA cost dataset only when inpatient costs rather than total hospital costs were used to calculate average costs per inpatient day, and a 3:1 ICU to non-ICU cost ratio was applied.
National Projection of Hospital or State Based Data
The first step in developing national projection estimates of CCM costs (Figure 1 - Right panel) in the US starts by selecting representative hospitals from either proprietary or state-based datasets. Using the ICU billing codes (Table 3) taken from the detailed charge databases of each hospital, the ICU days are then identified (Figure, Right panel, Step 2). The room and board costs and the costs of all billed items including medications, diagnostic and therapeutic services, for each patient per ICU day are totaled (bottom up) (Figure, Right panel, Step 3). Finally, the “weighted ICU and hospital data are placed into projection or estimation formulas to arrive at US national estimates (Figure, Right panel, Step 4).
Coopersmith and colleagues used cost data from the Premier Hospital Database (Premier, Inc., Charlotte, NC) to determine national CCM costs for 2008 (43). This dataset, derived from the ledgers and discharge records of all participating hospitals, contains most medical and administrative costs associated with each inpatient stay including medications, laboratory, diagnostic, and therapeutic services. The study developed three ICU categories for cost analysis. They then added a 17% modifier to account for the CCM physician and an estimate of costs for one year of post-ICU care recognizing the significance of post-ICU syndromes (44). Finally, the authors used Premier’s weighted projection algorithm to nationally amplify CCM costs for the entire US healthcare system. The resultant data offered nine variations of CCM costs for 2008 ranging from $121B to $263B. This data ultimately was very complicated and did not offer a clear and consistent message of CCM costs although some novel costing ideas were included.
A second projection study by Wunsch et al (45) examined the 2005 hospital discharge data of over 6 million patients in six US states using the HCUP database (Healthcare Costs and Utilization Project (HCUP), Rockville, MD) (46). The researchers focused on the use and cost of mechanical ventilation in the ICU. They combined the AHRQ data with hospital and patient data and cost-to-charge ratios from HCRIS and the CMS Impact File Hospital IPPS. The authors then projected their results (180,326 hospitalizations involving mechanical ventilation) to the entire US population using data from the US census for 2005 and estimated that there were almost 800,000 hospitalizations nationally involving mechanical ventilation at a cost of $27B.
Comparison of the Russell equation and the national projection methods
The Russell equation and the national projection methods share certain commonalities (Table 4). Both methods are data input agnostic and can therefore, be used to estimate CCM costs among well-defined or national groups of hospitals. Additionally, both methods rely upon core assumptions. Within the Russell equation, we assume that the main cost variable, the average cost per inpatient day, is a valid and full representation of US inpatient costs in short term hospitals, and that the value used for the ICU to non-ICU bed cost ratio is reasonable. Similarly, the projection methodology assumes that the selected hospitals are nationally representative of the entire US hospital universe to be studied and the projection or estimation methods are accurate.
Table 4.
Summary of Data Inputs, Assumptions, and Limitations of Russell Equation and Projection Costing Methods
A. Data input
|
B. Reliance on underlying assumptions
|
C. Major limitation in both methods is an understatement of CCM costs
|
Even supposing that the data, the assumptions and the projections/estimations methodologies (Table 4) are all technically acceptable, both costing methods may lead to underestimation of CCM costs for three reasons. First, only CCM services rendered in an ICU setting are included. CCM costs associated with CCM services administered outside the typical ICU setting (i.e., Post Anesthesia Care Unit, Emergency Department) are not captured. Second, physician charges for CCM services even in the ICU are not included. Finally, the main use parameter is ICU days, thus, the fixed costs of unoccupied ICU beds may not be fully included.
Future directions
Both the HCRIS and AHA national datasets should be enhanced and data made more accessible. In our opinion, the most practical approach is to upgrade the ICU section of the proprietary AHA survey rather than HCRIS, because it is unlikely that the CMS (federal government) will amend HCRIS, whereas the AHA may be more receptive to suggestions. Within the AHA survey, we recommend the following five enhancements. First, the ICU categories should be updated to match current ICU types. Second, clear instructions regarding data input by ICU type should be included with the survey. Third, the AHA should request parameters of use (days and/or daily census) by ICU type. Fourth, the AHA adjusted inpatient cost per day calculations should be validated. Fifth, the hospital categories of the AHA should be broadened to include an “academic hospital” category.
We believe that the Russell equation for estimating national CCM costs offers the cleanest, most transparent approach to estimating CCM costs. With the upgrades in the AHA dataset that we advocate, the entire Russell Equation could be solved quite readily. Nevertheless, we understand that the projection methodology is also a recognized approach to gaining large scale information from select groups of hospitals. Therefore, we suggest that the proprietary or investigator-based projection costing methods be cognizant of the new approach to national estimations recently introduced by the Healthcare Cost and Utilization Project (HCUP) (47).
The next generation of CCM bed and cost studies, regardless of their methodologies, should try to account for the absent CCM physician costs. Additionally, large studies should analyze the US by hospital types and regions to adjust for hospital and regional differences (48). Adult and pediatric CCM beds and costs should also be evaluated separately. Finally, future studies of CCM Medicare and Medicaid use should address the shifting of enrollees from traditional fee-for-service to managed care because the current databases only track fee-for-service excluding managed care. This issue is increasingly important as Medicare and Medicaid managed care have approximately 30% and 75% penetration nationally, respectively (49;50).
Conclusions
This review walks the reader though the maze of arcane datasets and costing calculations for CCM in the US. An understanding of the valuable data on ICU beds and use in the HCRIS and AHA national hospital databases and the broad outlines of the CCM costing methodologies is necessary for the intensivist to fully appreciate the subtleties of studies that address national ICU bed supply, occupancy rates, and ICU costs. With this background of national benchmarks, and in concert with the increasing focus on CCM administrative issues, we believe the intensivist, and even the hospital administrator, will be better suited to interact with each other and have a starting point for CCM resource discussions. We are optimistic that this review will aid intensivists, and encourage young investigators, as they continue to grapple with the perennial questions asked nationally and locally about whether the number and utilization of ICU beds is appropriate or not, or if CCM is properly resourced or not.
Acknowledgments
Copyright form disclosures: Dr. Halpern served as a board member for Pronia Medical and Instrumentation Labs and consulted for Cardiopulmonary Corp. Dr. Pastores lectured for the American College of Physicians (Faculty speaker for critical care medicine update at ACP annual congress) and Staten Island University Hospital (Speaker at Medical Grand Rounds). His institution received grant support from Spectral Diagnostics (Principal investigator for septic shock trial) and Bayer HealthCare (Principal investigator for gram-negative pneumonia trial in mechanically ventilated patients).
The authors acknowledge Elaine Ciccaroni, Medical Graphics, Memorial Sloan Kettering Cancer Center, New York for preparation of the figure and tables.
Footnotes
No financial or other potential conflicts of interest exist for the authors.
Contributor Information
Neil A Halpern, Critical Care Medicine, Department of Anesthesiology and Critical Care Medicine, Memorial Sloan Kettering Cancer Center, New York, NY, Professor of Medicine in Clinical Anesthesiology, Professor of Clinical Medicine, Weill Cornell Medical College New York, NY.
Stephen M. Pastores, Critical Care Medicine Service, Department of Anesthesiology and Critical Care Medicine, Memorial Sloan Kettering Cancer Center, New York, NY, Professor of Medicine in Anesthesiology, Professor of Medicine, Weill Cornell Medical College New York, NY.
References
- 1.Halpern NA, Pastores SM. Critical care medicine in the United States 2000–2005: An analysis of bed numbers, occupancy rates, payer mix, and costs. Crit Care Med. 2010;38:65–71. doi: 10.1097/CCM.0b013e3181b090d0. [DOI] [PubMed] [Google Scholar]
- 2.Society of Critical Care Medicine. Critical Care Statistics. [Last accessed April, 27, 2015]; http://www.sccm.org/Communications/Pages/CriticalCareStats.aspx.
- 3.Gooch RA, Kahn JM. ICU Bed Supply, Utilization, and Health Care Spending: An Example of Demand Elasticity. JAMA. 2014;311:567–8. doi: 10.1001/jama.2013.283800. [DOI] [PubMed] [Google Scholar]
- 4.Wunsch H. Is there a Starling curve for intensive care? Chest. 2012 Jun;141:1393–9. doi: 10.1378/chest.11-2819. [DOI] [PMC free article] [PubMed] [Google Scholar]
- 5.Rubenfeld GD, Rhodes A. How many intensive care beds are enough? Intensive Care Med. 2014;40:451–2. doi: 10.1007/s00134-014-3215-x. [DOI] [PubMed] [Google Scholar]
- 6.Kahn JM, Rubenfeld GD. The Myth of the Workforce Crisis: Why the United States Does Not Need More Intensivist Physicians. Am J Respir Crit Care Med. 2015;191:128–34. doi: 10.1164/rccm.201408-1477CP. [DOI] [PubMed] [Google Scholar]
- 7.Halpern NA, Pastores SM, Oropello JM, Kvetan V. Critical care medicine in the United States: addressing the intensivist shortage and image of the specialty. Crit Care Med. 2013;41:2754–61. doi: 10.1097/CCM.0b013e318298a6fb. [DOI] [PubMed] [Google Scholar]
- 8.Garland A. Improving the ICU: part 1. Chest. 2005;127:2151–64. doi: 10.1378/chest.127.6.2151. [DOI] [PubMed] [Google Scholar]
- 9.Garland A. Improving the ICU: part 2. Chest. 2005;127:2165–79. doi: 10.1378/chest.127.6.2165. [DOI] [PubMed] [Google Scholar]
- 10.Halpern SD. ICU capacity strain and the quality and allocation of critical care. Curr Opin Crit Care. 2011;17:648–57. doi: 10.1097/MCC.0b013e32834c7a53. [DOI] [PubMed] [Google Scholar]
- 11.Murphy DJ, Ogbu OC, Coopersmith CM. ICU director data: using data to assess value, inform local change, and relate to the external world. Chest. 2015;147:1168–78. doi: 10.1378/chest.14-1567. [DOI] [PMC free article] [PubMed] [Google Scholar]
- 12.Halpern NA. Innovative designs for the smart ICU: part 1: from initial thoughts to occupancy. Chest. 2014;145(2):399–403. doi: 10.1378/chest.13-0003. [DOI] [PubMed] [Google Scholar]
- 13.St.Andre A. The formation, elements of success, and challenges in managing a critical care program: part I. Crit Care Med. 2015;43(4):874–9. doi: 10.1097/CCM.0000000000000855. [DOI] [PubMed] [Google Scholar]
- 14.Fortis S, Weinert C, Bushinski R, et al. A health system-based critical care program with a novel tele-ICU: implementation, cost, and structure details. J Am Coll Surg. 2014 Oct;219:676–83. doi: 10.1016/j.jamcollsurg.2014.04.015. [DOI] [PubMed] [Google Scholar]
- 15.Irwin RS, Flaherty HM, French CT, et al. Interdisciplinary collaboration: the slogan that must be achieved for models of delivering critical care to be successful. Chest. 2012 Dec;142:1611–9. doi: 10.1378/chest.12-1844. [DOI] [PubMed] [Google Scholar]
- 16.St.Andre A. The Formation, Elements of Success, and Challenges in Managing a Critical Care Program: Part II. Crit Care Med. 2015;43:1096–101. doi: 10.1097/CCM.0000000000000856. [DOI] [PubMed] [Google Scholar]
- 17.Iwashyna TJ, Christie JD, Kahn JM, et al. Uncharted paths: hospital networks in critical care. Chest. 2009;135:827–33. doi: 10.1378/chest.08-1052. [DOI] [PMC free article] [PubMed] [Google Scholar]
- 18.Sinuff T, Kahnamoui K, Cook DJ, et al. Rationing critical care beds: a systematic review. Crit Care Med. 2004 Jul;32:1588–97. doi: 10.1097/01.ccm.0000130175.38521.9f. [DOI] [PubMed] [Google Scholar]
- 19.Centers for Medicare and Medicaid Services. Cost Reports. [Last accessed April 27, 2015]; http://www.cms.gov/Research-Statistics-Data-and-Systems/Downloadable-Public-Use-Files/Cost-Reports/index.html.
- 20.AHA Hospital Statistics 2015 Edition. Chicago, IL: American Hospital Assocation Health Forum; 2015. [Google Scholar]
- 21.Halpern NA, Pastores SM, Greenstein RJ. Critical care medicine in the United States 1985–2000: an analysis of bed numbers, use, and costs. Crit Care Med. 2004;32(6):1254–9. doi: 10.1097/01.ccm.0000128577.31689.4c. [DOI] [PubMed] [Google Scholar]
- 22.Pastores SM, Dakwar J, Halpern NA. Costs of critical care medicine. Crit Care Clin. 2012;28(1):1–10. doi: 10.1016/j.ccc.2011.10.003. [DOI] [PubMed] [Google Scholar]
- 23.Prin M, Wunsch H. The Role of Stepdown Beds in Hospital Care. Am J Respir Crit Care Med. 2014;190(1):1210–6. doi: 10.1164/rccm.201406-1117PP. [DOI] [PMC free article] [PubMed] [Google Scholar]
- 24.Wunsch H, Wagner J, Herlim M, et al. ICU occupancy and mechanical ventilator use in the United States. Crit Care Med. 2013;41:2712–9. doi: 10.1097/CCM.0b013e318298a139. [DOI] [PMC free article] [PubMed] [Google Scholar]
- 25.Halpern NA, Pastores SM, Thaler HT, Greenstein RJ. Changes in critical care beds and occupancy in the United States 1985–2000: Differences attributable to hospital size. Crit Care Med. 2006;34:2105–12. doi: 10.1097/01.CCM.0000227174.30337.3E. [DOI] [PubMed] [Google Scholar]
- 26.Tierney LT, Conroy KM. Optimal occupancy in the ICU: a literature review. Aust Crit Care. 2014;27:77–84. doi: 10.1016/j.aucc.2013.11.003. [DOI] [PubMed] [Google Scholar]
- 27.Society of Critical Care Medicine. Critical care units: A descriptive analyses. 3-1-2005. Des Plaines, IL: Society of Critical Care Medicine; [Google Scholar]
- 28.Iwashyna TJ, Kramer AA, Kahn JM. Intensive care unit occupancy and patient outcomes. Crit Care Med. 2009;37(5):1545–57. doi: 10.1097/CCM.0b013e31819fe8f8. [DOI] [PMC free article] [PubMed] [Google Scholar]
- 29.Centers for Medicare and Medicaid Services. Medicare Provider Analysis and Review (MEDPAR) File. [Last accessed April 27, 2015]; http://www.cms.gov/Research-Statistics-Data-and-Systems/Files-for-Order/IdentifiableDataFiles/MedicareProviderAnalysisandReviewFile.html.
- 30.Center for Medicare and Medicaid Services. Transmittal 1104. Centers for Medicare and Medicaid Services; [Last accessed April 27, 2015]. CMS 1450. CMS Manual System. Pub 100-04 Medicare Claims Processing. http://www.cms.gov/Regulations-and-Guidance/Guidance/Transmittals/Downloads/R1104CP.pdf. [Google Scholar]
- 31.Cooper LM, Linde-Zwirble WT. Medicare intensive care unit use: analysis of incidence, cost, and payment. Crit Care Med. 2004;32(11):2247–53. doi: 10.1097/01.ccm.0000146301.47334.bd. [DOI] [PubMed] [Google Scholar]
- 32.Milbrandt EB, Kersten A, Rahim MT, et al. Growth of intensive care unit resource use and its estimated cost in Medicare. Crit Care Med. 2008;36(9):2504–10. doi: 10.1097/CCM.0b013e318183ef84. [DOI] [PubMed] [Google Scholar]
- 33.Halpern NA, Pastores SM, Thaler HT, Greenstein RJ. Critical care medicine use and cost among Medicare beneficiaries 1995–2000: major discrepancies between two United States federal Medicare databases. Crit Care Med. 2007;35(3):692–9. doi: 10.1097/01.CCM.0000257255.57899.5D. [DOI] [PubMed] [Google Scholar]
- 34.Halpern N, Pastores S. Understanding the Russell equation and projection estimates to describe critical care costs in the United States. Int Care Med. 2015 doi: 10.1007/s00134-015-3876-0. in press. [DOI] [PubMed] [Google Scholar]
- 35.Kahn JM. Understanding economic outcomes in critical care. Curr Opin Crit Care. 2006;12:399–404. doi: 10.1097/01.ccx.0000244117.08753.38. [DOI] [PubMed] [Google Scholar]
- 36.Seidel J, Whiting PC, Edbrooke DL. The costs of intensive care. Continuing Education in Anaesthesia. Critical Care & Pain. 2006;6:160–163. [Google Scholar]
- 37.Pines JM, Fager SS, Milzman DP. A review of costing methodologies in critical care studies. Journal of Critical Care. 2002;17:181–6. doi: 10.1053/jcrc.2002.35811. [DOI] [PubMed] [Google Scholar]
- 38.Wunsch H, Gershengorn H, Scales DC. Economics of ICU organization and management. Crit Care Clin. 2012;28:25–37. doi: 10.1016/j.ccc.2011.09.004. [DOI] [PMC free article] [PubMed] [Google Scholar]
- 39.Berenson RA. Intensive care units: Clinical outcomes, costs, and decision making. Washington, D.C.: Office of Technology Assessment prepared for US Congress; 1984. [Google Scholar]
- 40.Jacobs P, Edbrooke D, Hibbert C, et al. Descriptive patient data as an explanation for the variation in average daily costs in intensive care. Anaesthesia. 2001;56:643–7. doi: 10.1046/j.1365-2044.2001.02052.x. [DOI] [PubMed] [Google Scholar]
- 41.Dasta JF, McLaughlin TP, Mody SH, Piech CT. Daily cost of an intensive care unit day: the contribution of mechanical ventilation. Crit Care Med. 2005;33:1266–71. doi: 10.1097/01.ccm.0000164543.14619.00. [DOI] [PubMed] [Google Scholar]
- 42.Halpern N, Bettes L, Greenstein R. Federal and nationwide intensive care units and healthcare costs:1986–1992. Crit Care Med. 1994;22:2001–2007. [PubMed] [Google Scholar]
- 43.Coopersmith CM, Wunsch H, Fink MP, et al. A comparison of critical care research funding and the financial burden of critical illness in the United States. Crit Care Med. 2012;40:1072–9. doi: 10.1097/CCM.0b013e31823c8d03. [DOI] [PubMed] [Google Scholar]
- 44.Elliott D, Davidson JE, Harvey MA, et al. Exploring the scope of post-intensive care syndrome therapy and care: engagement of non-critical care providers and survivors in a second stakeholders meeting. Crit Care Med. 2014;42:2518–26. doi: 10.1097/CCM.0000000000000525. [DOI] [PubMed] [Google Scholar]
- 45.Wunsch H, Linde-Zwirble WT, Angus DC, et al. The epidemiology of mechanical ventilation use in the United States. Crit Care Med. 2010;38:1947–53. doi: 10.1097/CCM.0b013e3181ef4460. [DOI] [PubMed] [Google Scholar]
- 46.Agency for Healthcare Research and Quality (AHRQ) Healthcare Cost and Utilization Project (HCUP) [Last accessed April 27, 2015]; http://www.hcup-us.ahrq.gov/ [PubMed]
- 47.Houchens RL, Ross DN, Elixhauser A, Jiang J Healthcare Cost and Utilization Project. Natiowide Inpatient Sample Redesign. [Last accessed April 27, 2015];Final Report. 2015 Deliverable # 1308.11. http://www.hcup-us.ahrq.gov/db/nation/nis/reports/NISRedesignFinalReport040914.pdf.
- 48.Wallace DJ, Angus DC, Seymour CW, et al. Critical Care Bed Growth in the United States: a Comparison of Regional and National Trends. Am J Respir Crit Care Med. 2015;191:410–6. doi: 10.1164/rccm.201409-1746OC. [DOI] [PMC free article] [PubMed] [Google Scholar]
- 49.The Henry J Kaiser Family Foundation. Medicare Advantage Fact Sheet. [Last accessed April 27, 2015];2015 http://kff.org/medicare/fact-sheet/medicare-advantage-fact-sheet/
- 50.Centers for Medicare and Medicaid Services. MEDICAID Managed Care Enrollment Report. [Last accessed April 27, 2015];2015 Available from: URL: http://www.medicaid.gov/Medicaid-CHIP-Program-Information/By-Topics/Data-and-Systems/Downloads/2011-Medicaid-MC-Enrollment-Report.pdf.