

Abstract
Mounting evidence in humans supports an etiological role for the microbiota in inflammatory atherosclerosis. Atherosclerosis is a progressive disease characterized by accumulation of inflammatory cells and lipids in vascular tissue. While retention of lipoprotein into the sub-endothelial vascular layer is believed to be the initiating stimulus leading to the development of atherosclerosis, activation of multiple pathways related to vascular inflammation and endothelial dysfunction sustain the process by stimulating recruitment of leukocytes and immune cells into the sub-endothelial layer. The Gram-negative oral pathogen Porphyromonas gingivalis has been associated with the development and acceleration of atherosclerosis in humans and these observations have been validated in animal models. It has been proposed that common mechanisms of immune signaling link stimulation by lipids and pathogens to vascular inflammation. Despite the common outcome of P. gingivalis and lipid feeding on atherosclerosis progression, we established that these pro-atherogenic stimuli induced distinct gene signatures in the ApoE-/- mouse model of atherosclerosis. In this study, we further defined the distinct roles of dietary lipids and P. gingivalis infection on atherosclerosis progression and the gut microbiota. We demonstrate that diet-induced lipid lowering resulted in less atherosclerotic plaque in ApoE-/- mice compared to ApoE-/- mice continuously fed a Western diet. However, the effect of diet-induced lipid lowering on plaque accumulation was blunted by P. gingivalis infection. Using principal component analysis and hierarchical clustering, we demonstrate that dietary intervention as well as P. gingivalis infection result in distinct bacterial communities in fecal and cecal samples of ApoE-/- mice as compared to ApoE-/- mice continuously fed either a Western diet or a normal chow diet. Collectively, we identified distinct microbiota changes accompanying atherosclerotic plaque, suggesting a future avenue for investigation on the impact of the gut microbiota, diet, and P. gingivalis infection on atherosclerosis.
Keywords: Oral Microbiota, Gut Microbiota, Lipids, Immunity, Inflammation, Atherosclerosis
1.Introduction
One of the most well-defined risk factors for the development of atherosclerosis is diet-induced obesity, which is on the rise in Western societies [1]. Dietary fat activates inflammatory and immune pathways, enhances leukocyte adhesion and promotes endothelial dysfunction, all of which are associated with the progression of atherosclerosis [2]. Monocyte differentiation into tissue resident macrophages that engulf and oxidize lipids to become inflammatory foam cells leads to end-stage atherosclerosis [2].
Chronic infections also contribute to atherosclerosis formation independent of traditional risk factors including obesity and unfavorable lipid profiles [3]. The Gram-negative anaerobe, Porphyromonas gingivalis, has been associated with the development and acceleration of atherosclerosis in humans and these observations have been validated in animal models [4-8]. P. gingivalis is an oral pathogen responsible for periodontal disease, one of the most common chronic diseases with a prevalence of approximately 50% in the adult population [9]. Similar to endogenous mediators arising from excessive dietary lipids, P. gingivalis is pro-atherogenic in mouse models [6-8, 10-14]. Many of the studies examining the mechanisms responsible for the development of atherosclerosis in the presence of high fat feeding or P. gingivalis infection have employed ApoE-/- mice, which have hypercholesterolemia that is five times higher than strain-matched controls and spontaneously develop a modest degree of atherosclerosis in the aorta in the absence of additional stimuli [15]. Atherosclerotic plaque is significantly increased in ApoE-/- mice by the addition of P. gingivalis oral infection [14]. Chronic high fat feeding of ApoE-/- mice results in the greatest degree of aortic plaque burden, likely due to the nature of the model: high fat feeding imposes an additional tripling of plasma cholesterol upon the ApoE-/- phenotype of a five-fold increase [15, 16]. A recent study from our laboratory comparing genome-wide aortic gene expression changes in ApoE-/- mice following P. gingivalis oral infection vs. high fat diet identified gene signatures and pathways that were distinct to each of these proatherogenic stimuli [17], suggesting that vascular inflammation leading to atherosclerosis can arise from different mechanisms.
Recent evidence in humans supports an etiological role for the intestinal microbiota in inflammatory atherosclerosis [18, 19]. The gastrointestinal tract is the largest reservoir of microbes in humans and is comprised of predominantly commensal bacteria [20, 21]. The intestinal microbiota is important for maintenance of mucosal barrier functions, metabolism, and immune development and homeostasis. In the oral cavity, it is now recognized that P. gingivalis is a keystone pathogen that initiates a conversion from a symbiotic community to microbial dysbiosis, resulting in oral inflammation and periodontitis [22]. However, it is not known if P. gingivalis oral infection also promotes a shift in the intestinal microbiota from a healthy state to a disease-promoting state. In the present study, we defined the distinct roles of dietary lipids and P. gingivalis oral infection on atherosclerosis progression and the associated intestinal microbiome. We demonstrate that diet-induced lipid lowering resulted in less atherosclerotic plaque in ApoE-/- mice compared to ApoE-/- mice continuously fed a Western diet. However, the effect of diet-induced lipid lowering on plaque accumulation was blunted by P. gingivalis infection. Using principal component analysis and hierarchical clustering, we demonstrate that dietary intervention as well as P. gingivalis infection result in distinct bacterial communities in fecal and cecal samples of ApoE-/- mice compared to ApoE-/-mice continuously fed either a Western diet or a normal chow diet. We identified distinct microbiota changes accompanying the degree of atherosclerotic plaque, suggesting a future avenue for investigation of the impact of intestinal microbiota, diet, and P. gingivalis infection on atherosclerosis progression.
2. Material and Methods
2.1 Ethics statement
All experiments were carried out in accordance with the recommendations in the Guide for the Care and Use of Laboratory Animals of the National Institutes of Health, and the Boston University Institutional Animal Care and Use Committee approved the study protocols. All experimental procedures involving pathogenic bacteria were carried out with approval from the Boston University Institutional Biosafety Committee.
2.2 Mouse randomization and treatment groups
Male ApoE-/- mice on C57BL/6 background (Jackson Laboratory) of 8 weeks of age were randomly assigned into one of the following four groups: normal chow (NC) for 22 weeks (Teklad Global 2018 (18% kcal from fat), Envigo, Madison, WI) (n=6); Western diet (WD) for 22 weeks (TD.88137 (42% kcal from fat with 0.2% cholesterol), Envigo, Madison, WI) (n=6), Western diet for 11 weeks followed by normal chow for 11 weeks (WD-NC) (n=7), or Western diet for 11 weeks followed by normal chow for 11 weeks and P. gingivalis oral infection at weeks 12-14 (WD-NC+Pg) (n=15) following the infection protocol previously published by our group that results in the acceleration of atherosclerosis in ApoE-/- mice [14] (Figure 1). All mice were euthanized after 22 weeks (Figure 1). The Western diet TD.88137 was used because it has been shown to accelerate atherosclerosis in ApoE-/- mice [15, 16] (Figure 1).
Figure 1. Experimental protocol.
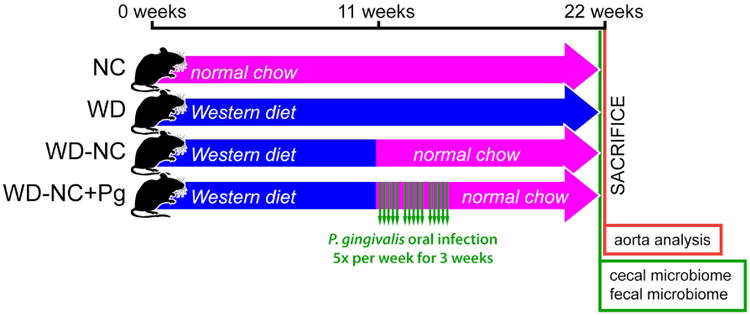
Four treatment groups were studied: NC=normal chow for 22 weeks (n=6), WD=Western diet for 22 weeks (n=6), WD-NC=Western diet for 11 weeks followed by normal chow for 11 weeks (n=7), WD-NC+Pg=Western diet for 11 weeks followed by normal chow for 11 weeks and P. gingivalis oral infection at midpoint (n=15). All mice were sacrificed at 22 weeks; analysis of plaque index in the aorta and its main braches was performed and fecal and cecal samples were collected at this time.
2.3 Determination of plaque index
Following euthanasia, the aortic arch and its three major branches (innominate, left common carotid, left subclavian arteries) were dissected and imaged using a microscope assembly with camera at a magnification of 2.5 × (Olympus SZ61; Olympus DP71). Plaque formation in four areas (aortic arch, innominate artery, left common carotid artery, and left subclavian artery) was quantified. Six grades of plaque were assigned to each region and scored from 0-5 based on the percent plaque area vs. total blood vessel area: 0, no plaque; 1, 1-20%; 2, 21-40%; 3, 41-60%; 4, 61-80%; 5, 81-100%. Numbers from all four regions were summed to generate the total plaque index. Data were analyzed by one-way ANOVA using Bonferroni Post Test (GraphPad Prism, v.5.0F). A Pearson correlation coefficient was calculated for the plaque index versus the relative abundance of phylum Bacteroidetes in cecal samples (GraphPad Prism, v.5.0F).
2.4 Fecal and cecal microbiome analysis
Prior to euthanasia, fecal pellets were collected from each mouse directly into individual sterile microcentrifuge tubes and stored at -80°C for DNA extraction and analysis. Following euthanasia, the cecum was removed and the cecal content samples were placed into individual sterile microcentrifuge tubes and stored at -80°C for DNA extraction and analysis. Fecal and cecal samples were homogenized using a bead-based tissue disrupter (TissueLyser II, Qiagen) followed by phenol-chloroform extraction (Trizol, Invitrogen) and ethanol precipitation. Isolated DNA was purified (AllPrep DNA/RNA Mini Kit, Qiagen).
Library preparation, sequencing, and QIIME analysis were performed by the Tufts University Core Facility Genomics Core. For each sample, an amplicon library of the 16S rRNA gene was constructed by performing PCR using primers flanking the variable region 4 (V4) (note: the primer pairs are actually on the constant region of 16sRNA), followed by a nested PCR to introduce Illumina adaptors. These 16S rRNA amplicon libraries were then mixed in equal molar concentration and sequenced with an Illumina MiSeq using MiSeq V2 chemistry and paired-end 250 format. The resulting raw data was converted to fastq format using bcl2fastq from Illumina. Computational analyses, including pairwise UniFrac distances [23], were performed using the open source software platform QIIME Version 1.8.0 (http://qiime.org) [24]. Each sequence was compared against the Greengenes database (http://greengenes.secondgenome.com, May 2013 release) and assigned to corresponding operational taxonomic units (OTUs) based on a minimum 97% identity (closed OTU picking) [25]. The frequency of OTUs from all samples were summarized at multiple taxonomy levels. Alpha and beta diversity analyses were also performed. All samples were rarefied to 32,000 sequences per sample.
2.5 Principal component analysis and hierarchical clustering
Normalized OTU tables for fecal and cecal samples, with accompanying metadata of treatment group, plaque index score, site of collection, and original mouse cage, were imported into Qlucore Omics Explorer 3.0 (Qlucore AB, Lund, Sweden) for statistical analysis and dynamic identification of microbiome differences by absolute abundance between the four treatment groups. A multiple group comparison was used to assign p-values to the OTUs, data were log2-transformed, and the data were filtered based on those p-values. PCA plots were generated based on treatment group (p<0.01) and plaque index (p<0.01). Hierarchically clustered heatmaps based on treatment group were generated (p<0.01 and p<1.35e-7).
2.6 LEfSe
To elucidate community biomarkers of treatment effects, differential abundance of the OTUs across treatment groups was assessed using LEfSe in the online Galaxy workflow framework (http://huttenhower.sph.harvard.edu/galaxy/). Prior to downstream analysis, sequences assigned to chloroplast and mitochondria were removed. The effect size of each differentially abundant feature was estimated by linear discriminant analysis (LDA) of normalized OTU tables evaluated with the recommended parameters (α=0.05, LDA score threshold=2.0). LDA plots and cladograms of the results were generated.
3. Results
3.1 Impact of diet and P. gingivalis oral infection on plaque index
To define the distinct roles of dietary lipids and P. gingivalis infection on atherosclerosis progression, atherosclerotic plaque was measured in mice in each of the 4 experimental groups (Figure 1). Representative images of atherosclerotic plaque are shown in Figure 2A and quantification of plaque (plaque index) is shown in Figure 2B. As expected, plaque index was the highest in mice placed on a Western diet for 22 weeks (WD). Mice switched to a normal chow diet following 11 weeks on a Western diet (WD-NC) had a significantly lower plaque index compared to mice in the WD group. Mice that were infected with P. gingivalis and switched to a normal chow diet following 11 weeks on a Western diet (WD-NC+Pg) had a significantly higher plaque index than non-infected mice that were also switched to a normal chow diet following 11 weeks on a Western diet (WD-NC). ApoE-/- mice fed a normal chow diet for 22 weeks (NC) had the lowest atherosclerotic plaque index of all four groups. These results confirm results from prior studies on plaque accumulation following a Western diet (NC vs. WD) and demonstrate that P. gingivalis infection contributes to plaque development in ApoE-/- mice independent of increased dietary lipids (WD-NC+Pg vs. WD-NC).
Figure 2. Atherosclerotic plaque development in the aorta and its main branches.
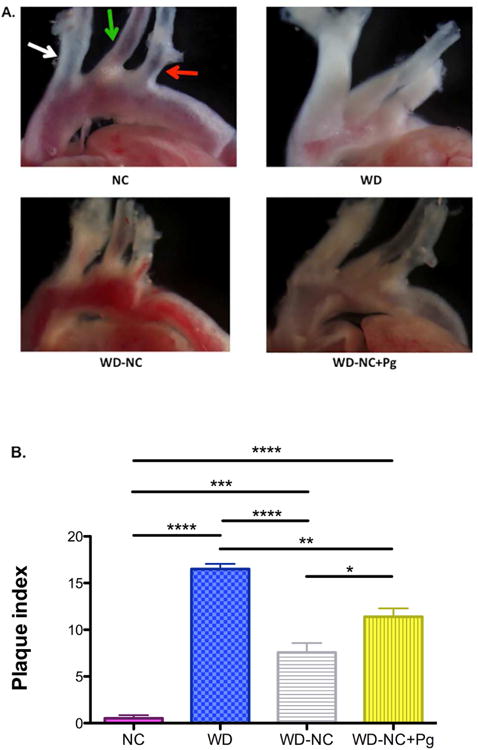
A. Representative images showing differential plaque accumulation among the four treatment groups. white arrow=innominate artery, green arrow=left common carotid artery, red arrow=left subclavian artery B. Quantitative assessment of plaque development among the four treatment groups, shown as plaque index. Plaque formation in the aortic arch, innominate artery, left common carotid artery, and left subclavian artery was quantified. 6 grades were assigned based on the percent plaque area vs. total blood vessel area: 0, no plaque; 1, 1-20%; 2, 21-40%; 3, 41-60%; 4, 61-80%; 5, 81-100%. Numbers from all four locations were summed to generate the plaque index. NC=normal chow for 22 weeks (n=6), WD=Western diet for 22 weeks (n=6), WD-NC=Western diet for 11 weeks followed by normal chow for 11 weeks (n=7), WD-NC+Pg=Western diet for 11 weeks followed by normal chow for 11 weeks and P. gingivalis oral infection at midpoint (n=15). Data were analyzed by one-way ANOVA (p<0.0001) using Bonferroni Post Test: *p<0.05, **p<0.01, ***p<0.001, ****p<0.0001.
3.2 Impact of diet and P. gingivalis oral infection on relative abundance of bacterial taxa
3.2.1 Relative abundance of Phyla Bacteroidetes and Firmicutes in cecal samples
Several epidemiological studies have reported differences in relative abundance of specific microbial communities in diseased versus healthy control subjects [26-28]. To examine the impact of diet and P. gingivalis oral infection on the relative abundance of bacteria in the gut, we sequenced DNA extracted from cecal samples obtained from mice in all 4 experimental groups. The cecal samples from the WD group had approximately 2.5 times higher relative abundance of phylum Bacteroidetes compared to cecal samples from the NC group (23.1% vs. 9.3%; range 16.2-39.9% vs. 5.4-11.5%, respectively) (Figure 3A). The relative abundance of phylum Bacteroidetes in cecal samples from the WD-NC group ranged from 9.6-18.6%, with an average of 13.1%, compared to a range of 4.8-28.0%, with an average of 16.9%, in the WD-NC+Pg group (Figure 3A). These differences in relative abundance of Bacteroidetes were confined to a single taxon, family S24-7. Plaque accumulation correlated (Pearson r=0.65) with the relative abundance of phylum Bacteroidetes in cecal samples (Figure 3B).
Figure 3. Relative abundance of phyla in cecal samples.
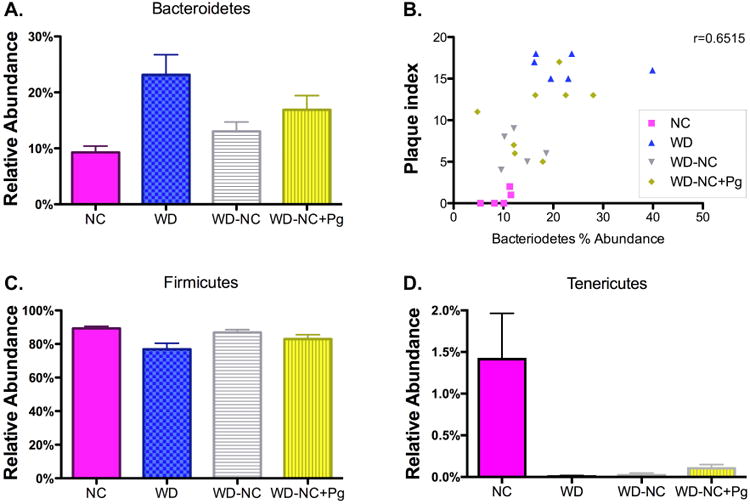
A. Phylum Bacteroidetes (family S24-7). Data were analyzed by one-way ANOVA (p=0.0128). B. Linear correlation between plaque index and relative abundance of phylum Bacteroidetes (S24-7) in cecal samples. Pearson r = 0.6515, p=0.0006. C. Phylum Firmicutes. Data were analyzed by one-way ANOVA (p=0.0245). D. Phylum Tenericutes. Data were analyzed by one-way ANOVA (p=0.0007). NC=normal chow for 22 weeks (n=5), WD=Western diet for 22 weeks (n=6), WD-NC=Western diet for 11 weeks followed by normal chow for 11 weeks (n=6), WD-NC+Pg=Western diet for 11 weeks followed by normal chow for 11 weeks and P. gingivalis oral infection at midpoint (n=8).
The cecal samples from the WD group had a lower relative abundance of phylum Firmicutes compared to the cecal samples from the NC group (76.8% vs. 89.3%; range 60.0-83.8% vs. 85.5-92.7%, respectively) (Figure 3C). The relative abundance of phylum Firmicutes in the cecal samples from the WD-NC group ranged from 81.4-90.4%, with an average of 86.9%, compared to a range of 71.9-95.2%, with an average of 83.0%, in the WD-NC+Pg group (Figure 3C). The majority of these differences in relative abundance were confined to class Clostridia, but we also observed differences in class Bacilli (Supplementary Figure 1A-B). The relative abundance of class Bacilli ranged from 0.0-0.2%, with an average of 0.1%, in the NC group; from 0.1-2.2%, with an average of 0.9%, in the WD group; from 0.1-0.3%, with an average of 0.2%, in the WD-NC group; and from 0.0-0.3%, with an average of 0.1%, in the WD-NC+Pg group (Supplementary Figure 1A). The relative abundance of class Clostridia ranged from 85.3-92.7%, with an average of 89.2%, in the NC group; from 57.2-83.4%, with an average of 75.6%, in the WD group; from 81.2-90.0%, with an average of 86.7%, in the WD-NC group; and from 71.7-95.0%, with an average of 82.8%, in the WD-NC+Pg group (Supplementary Figure 1B). The family Lachnospiraceae and family Ruminococcaceae accounted for most of the differences in relative abundance of class Clostridia (Supplementary Figure 1C-D). The relative abundance of family Lachnospiraceae ranged from 3.8-14.0%, with an average of 9.3%, in the NC group; from 9.1-13.4%, with an average of 11.7%, in the WD group; from 7.1-14.6%, with an average of 11.0%, in the WD-NC group; and from 5.4-13.3%, with an average of 8.9%, in the WD-NC+Pg group (Supplementary Figure 1C). The relative abundance of family Ruminococcaceae ranged from 3.5-15.7%, with an average of 9.6%, in the NC group; from 15.6-28.6%, with an average of 20.3%, in the WD group; from 8.1-13.1%, with an average of 11.6%, in the WD-NC group; and from 6.9-12.0%, with an average of 9.8%, in the WD-NC+Pg group (Supplementary Figure 1D). These results are consistent with several studies demonstrating dysbiosis of the gut microbiota following a Western diet (NC vs. WD) [29, 30]. Dietary intervention (WD-NC) partially resolved Western diet-induced dysbiosis; importantly, we demonstrated that P. gingivalis oral infection blunts this resolution (WD-NC vs. WD-NC+Pg).
3.2.2 Relative abundance of bacterial taxa in fecal and cecal samples
In cecal samples, the relative abundance of phylum Tenericutes ranged from 0.1-3.2%, with an average of 1.4%, in the NC group; in all other groups, the relative abundance of phylum Tenericutes was <1% for all mice (Figure 3D). The relative abundance of phylum Actinobacteria, phylum Cyanobacteria, and phylum Proteobacteria in the cecal contents was <1% for all mice in all treatment groups (data not shown). No significant differences in relative abundance of bacterial taxa were seen in the fecal samples from the four treatment groups (data not shown).
3.3 Impact of diet and P. gingivalis oral infection on alpha and beta diversity
We next examined alpha and beta bacterial diversity, which measures variation within a sample and between samples, respectively. As expected, alpha diversity, as determined by Chao1 (species richness) and confirmed by the number of observed species and phylogenetic diversity, was significantly decreased in the WD group (Table 1, Figure 4A, p<0.0001). Alpha diversity, as described by phylogenetic diversity, was also significantly decreased in the WD-NC+Pg group vs. the NC group (data not shown, p<0.05). Alpha diversity, as described by Shannon index (richness and evenness), was significantly increased in the WD-NC group (Table 1, Figure 4B, p<0.0001). Beta diversity was measured using unweighted and weighted UniFrac, which consider presence or absence of OTUs and OTU abundance, respectively. Unweighted UniFrac revealed distinct clusters for the WD group vs. the NC group; a third cluster was comprised WD-NC and WD-NC+Pg groups (Supplementary Figure 2A). Using weighted UniFrac, the WD group separated from the other treatment groups by PC2 (Supplementary Figure 2B). As expected, the mice continuously fed a Western diet dramatically differed in bacterial abundance compared to the mice that were fed a normal chow diet for the final 11 weeks.
Table 1. Summary of alpha diversity measures.
| NC | WD | WD-NC | WD-NC+Pg | p value | |
|---|---|---|---|---|---|
| Chao1 | 738.2±77.85 | 590.8±63.38 | 706.8±41 | 710.4±62.88 | <0.0001 |
| Shannon | 5.581±0.776 | 5.8±0.249 | 6.095±0.1711 | 5.668±0.5046 | <0.0001 |
| Observed Species | 597±70.4 | 489.5±54.85 | 585.9±31.21 | 584.9±45.84 | <0.0001 |
| PD Whole Tree | 31.6±2.467 | 27.11±2.533 | 30.76±1.569 | 30.67±1.718 | <0.0001 |
Figure 4. Alpha diversity measures.
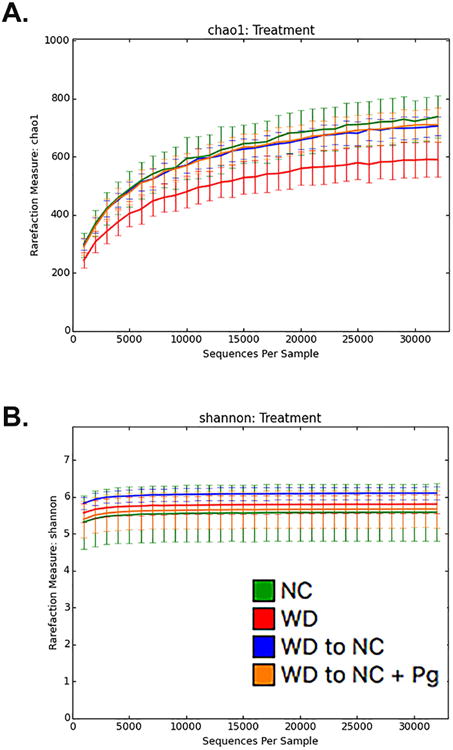
Rarefaction analysis of fecal and cecal samples. A. Chao1 (richness) and B. Shannon Index (abundance and evenness). Lines represent the mean+/-standard deviation. The analysis was performed on a randomly selected subset of 1,000-32,000 sequences per sample over 10 iterations.
3.4 PCA/heatmap - Effect of diet and/or oral infection with P. gingivalis
By first filtering OTUs for significance then clustering them into components, PCA identifies the OTUs most strongly responsible for divergence between treatment group communities and clusters them into components based on the similarity of their effect [31]. Using Qlucore Omics Explorer, we evaluated correlations between dynamically adjusted p-values by Principal Component Analysis (PCA) and hierarchical clustering in order to isolate the primary OTUs responsible for the between-group variance. We observed distinct clusters by treatment group, indicating that treatment had a significant impact on community composition (p<0.01, 577 significant OTUs out of 2406) (Figure 5A, Video1). PCA by treatment group showed a strong separation along the PC1 axis (25%) between the WD group and the three groups that were fed a normal chow diet for the final 11 weeks (Figure 5A, Video1). The NC and WD-NC groups clustered independently from the WD-NC+Pg group along the PC2 axis (11%); the WD group fell between these clusters (Figure 5A, Video1). The NC group clustered independently along the PC3 axis (8%) from the three groups that were fed a Western diet for the initial 11 weeks (Figure 5A, Video1). These results demonstrate that each treatment group had a unique microbial community profile. Notably, separation along the PC1 axis described a qualitative community difference based on final diet, while separation along the PC3 axis described a qualitative community difference based on initial diet.
Figure 5. Hierarchical clustering and PCA.
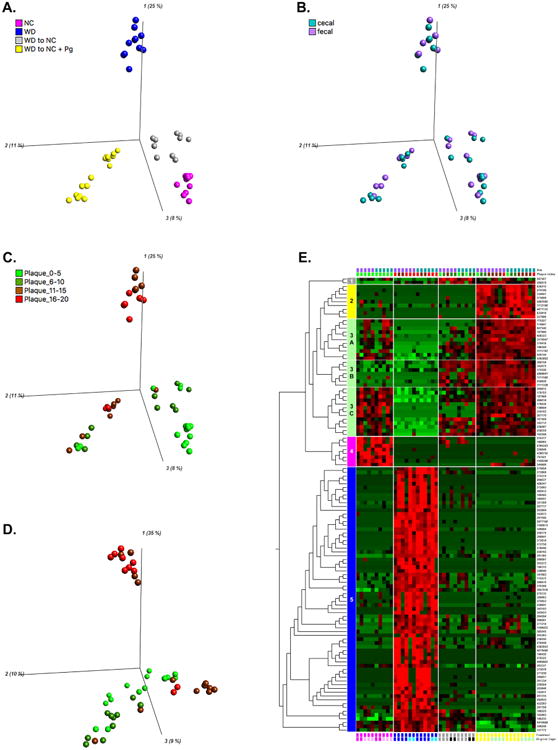
A-C. PCA based on treatment group. PC1 (25%), PC2 (11%), PC3 (8%). Log2 transformed, 577/2406 variables were significant, p<0.01, q<0.04166 D. PCA based on plaque index category. PC1 (35%), PC2 (10%), PC3 (9%). Log2 transformed, 246/2406 variables were significant, p<0.01, q< 0.096312 E. Heatmap based on treatment group, metadata group memberships (site of sample collection, plaque index, treatment group, original cage) are indicated by colored blocks at the top or bottom of the heatmap. Log2 transformed, Top 5% (120 variables), p<1.35e-7, q<2.6311e-6. NC=normal chow for 22 weeks (cages 10 and 18), WD=Western diet for 22 weeks (cages 7 and 12), WD-NC=Western diet for 11 weeks followed by normal chow for 11 weeks (cages 11 and 15), WD-NC+Pg=Western diet for 11 weeks followed by normal chow for 11 weeks and P. gingivalis oral infection at midpoint (cages 8 and 9).
Interestingly, we observed that the WD-NC+Pg group diverged into two subclusters, at a p-value of 0.01 (Figure 5A, Video1). Each treatment group consisted of mice housed in two separate cages. When examining the treatment-based clusters, superimposition of the cage occupancy metadata revealed that the two WD-NC+Pg subclusters were products of a cage effect (Supplementary Figure 3A). However, as the stringency of the model was increased, the WD-NC+Pg subclusters merged into a single cluster (Supplementary Figure 3B, Video 2). While we did observe a cage effect, it was secondary to the effect of the treatment group on microbial community. These results are consistent with previous gut microbiome studies demonstrating cage effects [32, 33].
To validate the combination of cecal and fecal samples for PCA and hierarchical clustering, we performed PCA by site of sample collection and found no significant separation between cecal and fecal samples (data not shown). In addition, superimposing the site of sample collection onto the treatment-based PCA plot indicated that the community profile was unique to the mouse of origin, not the site of collection (Figure 5B).
To examine clustering by plaque index we binned plaque index data into four groups (0-5, 6-10, 11-15, and 16-20). Superimposing the plaque index category onto the treatment-based PCA plot revealed that plaque index correlated strongly with treatment (Figure 5C). This is consistent with the correlation observed between plaque index and relative abundance of phylum Bacteroidetes (Figure 3B). As expected, all WD samples fell into the two highest categories of plaque index, while all NC samples fell within the two lowest categories (Figure 5C). With one exception, all WD-NC samples also fell within the two lowest plaque index categories (Figure 5C). All four plaque index categories were represented in the WD-NC+Pg group; however, one subcluster consisted only of the two highest categories, similar to the WD group (Figure 5C). The WD-NC+Pg plaque index categories were consistent with the observed clustering described by the cage effect. We also performed PCA by plaque index category, which revealed two distinct clusters (Figure 5D). One cluster was composed of the WD group and the other cluster was composed of the three groups that were fed a normal chow diet for the final 11 weeks (Figure 5D). Interestingly, this analysis separated the samples with the two highest plaque index categories into different clusters, suggesting unique microbial community profiles are associated with plaque accumulation in a treatment-dependent manner.
A heatmap of the 577 significant OTUs identified by treatment-based PCA (p<0.01) revealed five clusters that identified distinct patterns of OTU abundance responsible for the treatment-based separation observed by PCA (Supplementary Figure 3C). The top 5% of these OTUs were selected for further investigation (p<1.35e-7) (Figure 5E). Hierarchical clustering at this level of analysis revealed five distinct clusters. Cluster 1 (grey) consisted of 2 OTUs (260679 and 287507, both of the phylum Firmicutes) that were highly abundant in the WD-NC and WD-NC+Pg groups (Figure 5E, Table 2). Cluster 2 (yellow) consisted of 9 OTUs (order Clostridiales) that were highly abundant in the WD-NC+Pg group, distinguishing this group from all non-infected groups (Figure 5E, Table 2). Cluster 3 (mint) represented OTUs that were highly abundant in the WD-NC+Pg group (Figure 5E, Table 2). Cluster 3A (11 OTUs, family S24-7, phylum Bacteriodetes; order Clostridiales) and cluster 3C (13 OTUs, order Clostridiales) represented OTUs of increased abundance in the NC and WD-NC groups, while 3B (7 OTUs, order Clostridiales) was of high abundance in the WD-NC group but low in the NC group (Figure 5E, Table 2). Cluster 4 (pink) represented 8 OTUs that were highly abundant in the NC group versus the other treatment groups; taxonomically, this cluster consisted of phylum Tenericutes, order Clostridiales, and genus Anaeroplasma (Figure 5E, Table 2). Cluster 5 (blue) (family S24-7, phylum Bacteriodetes; order Clostridiales; order Lactobacilliales) represented 70 OTUs that were highly abundant in the WD group (Figure 5E, Table 2). As expected, the WD group was associated with the largest number of OTUs (cluster 5) significantly contributing to differentiation between treatment groups. Of specific interest, order Lactobacillales was only present in this cluster. The three groups that were fed a normal chow diet for the final 11 weeks shared similar profiles based on cluster 3, but the WD-NC+Pg group had a higher abundance of these OTUs compared to the NC and WD-NC groups. Another taxon of interest was family S24-7, of which one OTU was distinctly elevated in association with the WD group while another was distinctly elevated in association with the WD-NC+Pg group. The WD-NC group and the WD-NC+Pg group also shared a similar profile based on cluster 1 as well. The phylum Tenericutes and the genus Anaeroplasma were uniquely associated with the NC group (cluster 4).
Table 2.
Hierarchical clustering. Top 120 OTUs out of 2406.
| Taxonomy | OTU ID | p value | q value | Cluster |
|---|---|---|---|---|
| Firmicutes Clostridia Clostridiales | 260679 | 1.57E-08 | 4.07E-07 | 1 |
| Lachnospiraceae | 287507 | 2.68E-08 | 6.18E-07 | 1 |
| Firmicutes Clostridia Clostridiales | 839215 | 1.90E-19 | 3.52E-17 | 2 |
| 273806 | 1.86E-13 | 1.72E-11 | 2 | |
| 833816 | 2.35E-13 | 2.09E-11 | 2 | |
| 274106 | 5.23E-12 | 3.00E-10 | 2 | |
| 4471135 | 6.62E-11 | 2.95E-09 | 2 | |
| 334697 | 1.44E-09 | 5.11E-08 | 2 | |
| 4483585 | 4.20E-08 | 9.28E-07 | 2 | |
| 1112190 | 9.04E-08 | 1.91E-06 | 2 | |
| 227886 | 9.83E-08 | 2.04E-06 | 2 | |
| Bacteroidetes Bacteroidia Bacteroidales S24-7 | 445144 | 3.98E-09 | 1.23E-07 | 3A |
| Firmicutes Clostridia Clostridiales | 175227 | 2.16E-14 | 2.36E-12 | 3A |
| 4393892 | 5.39E-12 | 3.01E-10 | 3A | |
| 174418 | 4.88E-11 | 2.21E-09 | 3A | |
| 174847 | 1.21E-10 | 5.08E-09 | 3A | |
| 608323 | 7.04E-09 | 1.99E-07 | 3A | |
| 3176547 | 3.27E-08 | 7.35E-07 | 3A | |
| Lachnospiraceae | 197600 | 9.78E-10 | 3.56E-08 | 3A |
| Coprococcus | 607540 | 1.08E-07 | 2.20E-06 | 3A |
| Ruminococcaceae | 196349 | 3.67E-16 | 5.19E-14 | 3A |
| 1111782 | 2.51E-08 | 5.99E-07 | 3A | |
| Firmicutes Clostridia Clostridiales | 342075 | 4.36E-16 | 5.83E-14 | 3B |
| 260156 | 1.24E-12 | 9.04E-11 | 3B | |
| 259820 | 3.84E-10 | 1.52E-08 | 3B | |
| 1111328 | 7.42E-10 | 2.79E-08 | 3B | |
| 174320 | 9.17E-08 | 1.92E-06 | 3B | |
| Lachnospiraceae | 2808641 | 1.65E-14 | 1.89E-12 | 3B |
| Ruminococcaceae | 1111580 | 3.20E-10 | 1.28E-08 | 3B |
| Firmicutes Clostridia Clostridiales | 260018 | 2.94E-17 | 5.06E-15 | 3C |
| 187989 | 2.29E-11 | 1.10E-09 | 3C | |
| 179703 | 7.41E-11 | 3.24E-09 | 3C | |
| 182712 | 2.59E-09 | 8.78E-08 | 3C | |
| 307170 | 6.46E-09 | 1.87E-07 | 3C | |
| 269815 | 2.05E-08 | 5.10E-07 | 3C | |
| Lachnospiraceae | 319702 | 8.52E-13 | 6.62E-11 | 3C |
| 136604 | 2.05E-12 | 1.33E-10 | 3C | |
| 258559 | 2.91E-09 | 9.49E-08 | 3C | |
| Ruminococcaceae Oscillospira | 167509 | 1.02E-12 | 7.63E-11 | 3C |
| 176836 | 1.11E-07 | 2.24E-06 | 3C | |
| Ruminococcus | 192598 | 1.70E-11 | 8.34E-10 | 3C |
| 238487 | 2.18E-10 | 8.90E-09 | 3C | |
| Firmicutes Clostridia Clostridiales | 797021 | 3.88E-12 | 2.34E-10 | 4 |
| 259846 | 1.26E-11 | 6.44E-10 | 4 | |
| 1106290 | 2.94E-11 | 1.39E-09 | 4 | |
| 180065 | 1.11E-08 | 2.96E-07 | 4 | |
| 215317 | 1.60E-08 | 4.09E-07 | 4 | |
| Lachnospiraceae | 4364243 | 9.72E-09 | 2.69E-07 | 4 |
| Ruminococcaceae | 344906 | 1.67E-09 | 5.83E-08 | 4 |
| Tenericutes Mollicutes Anaeroplasmatales Anaeroplasmataceae Anaeroplasma | 4390755 | 2.80E-09 | 9.36E-08 | 4 |
| Bacteroidetes Bacteroidia Bacteroidales S24-7 | 182893 | 3.80E-09 | 1.21E-07 | 5 |
| Firmicutes Bacilli Lactobacillales Streptococcaceae Lactococcus | 1100972 | 5.83E-24 | 2.81E-21 | 5 |
| 4468805 | 3.71E-08 | 8.27E-07 | 5 | |
| Firmicutes Clostridia Clostridiales | 278440 | 6.56E-28 | 5.26E-25 | 5 |
| 272758 | 5.78E-24 | 2.81E-21 | 5 | |
| 258165 | 5.27E-21 | 1.58E-18 | 5 | |
| 259175 | 1.34E-20 | 3.57E-18 | 5 | |
| 272619 | 4.43E-20 | 9.27E-18 | 5 | |
| 272889 | 8.01E-17 | 1.20E-14 | 5 | |
| 189585 | 3.45E-14 | 3.61E-12 | 5 | |
| 275653 | 1.59E-13 | 1.53E-11 | 5 | |
| 184451 | 8.25E-13 | 6.61E-11 | 5 | |
| 3957916 | 1.66E-12 | 1.18E-10 | 5 | |
| 270396 | 2.26E-12 | 1.43E-10 | 5 | |
| 272092 | 3.33E-12 | 2.05E-10 | 5 | |
| 351309 | 5.92E-12 | 3.23E-10 | 5 | |
| 385545 | 9.69E-12 | 5.07E-10 | 5 | |
| 260001 | 3.07E-11 | 1.42E-09 | 5 | |
| 343923 | 1.22E-10 | 5.08E-09 | 5 | |
| 265912 | 4.69E-10 | 1.82E-08 | 5 | |
| 263899 | 6.16E-10 | 2.35E-08 | 5 | |
| 269037 | 9.23E-10 | 3.42E-08 | 5 | |
| 266091 | 3.99E-09 | 1.23E-07 | 5 | |
| 406247 | 5.34E-09 | 1.58E-07 | 5 | |
| 274958 | 5.81E-09 | 1.70E-07 | 5 | |
| 1108453 | 1.05E-08 | 2.88E-07 | 5 | |
| 271230 | 1.11E-08 | 2.96E-07 | 5 | |
| 273078 | 1.27E-08 | 3.37E-07 | 5 | |
| 343183 | 1.47E-08 | 3.84E-07 | 5 | |
| 264294 | 1.64E-08 | 4.15E-07 | 5 | |
| 270448 | 1.69E-08 | 4.23E-07 | 5 | |
| 274374 | 2.22E-08 | 5.41E-07 | 5 | |
| 261315 | 2.66E-08 | 6.18E-07 | 5 | |
| 271219 | 5.20E-08 | 1.13E-06 | 5 | |
| 276325 | 1.31E-07 | 2.63E-06 | 5 | |
| Clostridiaceae | 193672 | 1.56E-22 | 5.36E-20 | 5 |
| 4383953 | 2.33E-08 | 5.59E-07 | 5 | |
| 265363 | 6.83E-08 | 1.45E-06 | 5 | |
| SMB53 | 196315 | 4.76E-13 | 3.95E-11 | 5 |
| Lachnospiraceae | 275132 | 1.03E-10 | 4.43E-09 | 5 |
| 743911 | 1.99E-09 | 6.84E-08 | 5 | |
| 309963 | 2.92E-09 | 9.49E-08 | 5 | |
| 258641 | 3.82E-09 | 1.21E-07 | 5 | |
| 269657 | 2.13E-08 | 5.22E-07 | 5 | |
| 261334 | 2.68E-08 | 6.18E-07 | 5 | |
| [Ruminococcus] gnavus | 267717 | 2.48E-20 | 5.98E-18 | 5 |
| 181683 | 3.79E-13 | 3.26E-11 | 5 | |
| 263946 | 4.23E-12 | 2.48E-10 | 5 | |
| 175575 | 1.54E-11 | 7.72E-10 | 5 | |
| 262633 | 4.32E-09 | 1.32E-07 | 5 | |
| Peptostreptococcaceae | 261590 | 1.91E-32 | 4.59E-29 | 5 |
| Ruminococcaceae | 2877100 | 1.37E-23 | 5.48E-21 | 5 |
| 346804 | 4.62E-20 | 9.27E-18 | 5 | |
| 269070 | 1.20E-15 | 1.45E-13 | 5 | |
| 188225 | 9.24E-12 | 4.94E-10 | 5 | |
| 261799 | 1.14E-09 | 4.09E-08 | 5 | |
| 4070490 | 4.86E-09 | 1.46E-07 | 5 | |
| 258550 | 2.69E-08 | 6.18E-07 | 5 | |
| 190420 | 4.37E-08 | 9.56E-07 | 5 | |
| 349246 | 1.08E-07 | 2.20E-06 | 5 | |
| Oscillospira | 266841 | 1.74E-29 | 2.10E-26 | 5 |
| 180235 | 6.21E-16 | 7.87E-14 | 5 | |
| 259504 | 1.99E-12 | 1.33E-10 | 5 | |
| 422283 | 6.60E-09 | 1.89E-07 | 5 | |
| 263337 | 9.31E-09 | 2.61E-07 | 5 | |
| 4410988 | 2.73E-08 | 6.20E-07 | 5 | |
| 157772 | 5.27E-08 | 1.13E-06 | 5 | |
| Ruminococcus | 261365 | 3.88E-17 | 6.22E-15 | 5 |
| 263272 | 6.16E-14 | 6.17E-12 | 5 | |
| 338640 | 1.75E-12 | 1.20E-10 | 5 |
3.5 LDA/Cladogram - Impact of diet and P. gingivalis oral infection
3.5.1 Cecal samples
We next utilized linear discriminant analysis (LDA) effect size (LEfSe), which determines the OTUs most likely to explain differences between groups by combined testing of statistical significance, biological consistency, and effect relevance [34]. LEfSe was applied to the microbiota data from the three groups that were fed a normal chow diet during the final 11 weeks (NC, WD-NC, WD-NC+Pg) and identified 19 differentially abundant taxa (α = 0.05) with an LDA score higher than 2.0, respectively (Figure 6A). At the phylum level, Bacteroidetes was most abundant in the WD-NC+Pg group, while Tenericutes and Proteobacteria were most abundant in the NC group. At the family level, S24-7 was most abundant in the WD-NC+Pg group, Lactobacillaceae was most abundant in the WD-NC group, and Anaeroplasmataceae was most abundant in the NC group (Figure 6A). Several genera from phylum Firmicutes were also significantly different between these three treatment groups and were most abundant in the WD-NC group (Figure 6A).
Figure 6. Linear discriminant analysis effect size (LEfSe) of cecal samples.
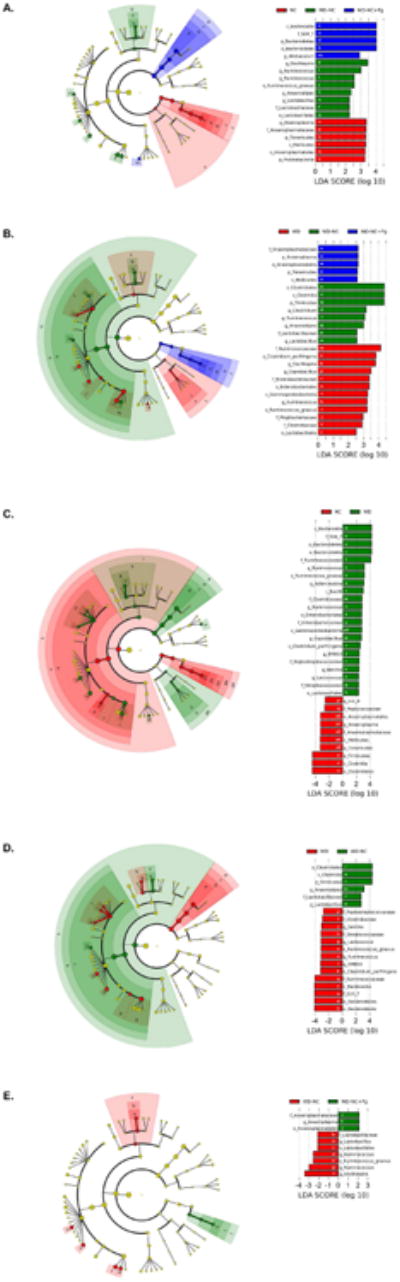
A. NC vs. WD-NC vs. WD-NC+Pg. B. WD vs. WD-NC vs. WD-NC+Pg. C. NC vs. WD. D. WD vs. WD-NC. E. WD-NC vs. WD-NC+Pg. Left side= linear discriminant analysis (LDA) plots, listing differentially abundant taxa (α = 0.05) with an LDA score higher than 2.0. The taxon name is preceded by one of the following: p_=phylum, c_=class, o_=o_order, f_=f_family, g_=genus, s_=species. Colored bars indicate LDA score as well as the group in which that taxon was most abundant. White letters within the colored bars correspond to the cladogram, on the right.
LEfSe was applied to the microbiota data from the three groups that were fed a Western diet during the first 11 weeks (WD, WD-NC, WD-NC+Pg) and identified 25 differentially abundant taxa (α = 0.05) with an LDA score higher than 2.0, respectively (Figure 6B). At the phylum level, Tenericutes was most abundant in the WD-NC+Pg group and Firmicutes was most abundant in the WD-NC group (Figure 6B). At the family level, Anaeroplasmataceae was most abundant in the WD-NC+Pg group, Lactobacillaceae was most abundant in the WD-NC group, and Ruminococcaceae, Enterobacteriaceae, Mogibacteriaceae, and Clostridiaceae were most abundant in the WD group (Figure 6B).
To assess the impact of diet on the gut microbiota of ApoE-/- mice, LEfSe was applied to the microbiota data from the NC and WD groups. This analysis identified 32 differentially abundant taxa (α = 0.05) with an LDA score higher than 2.0 (Figure 6C). At the phylum level, Bacteroidetes was significantly higher and Tenericutes and Firmicutes were significantly lower in the WD group compared to the NC group (Figure 6C). At the family level, S24-7, Ruminococcaceae, Clostridiaceae, Enterobacteriaceae, Peptostreptococcaceae, and Streptococcaceae were significantly higher and Peptococcaceae and Anaeroplasmataceae were significantly lower in the WD group compared to the NC group (Figure 6C).
To assess the impact of switching from a Western diet to a normal chow diet on the gut microbiota of ApoE-/- mice, LEfSe was applied to the microbiota data from the WD and WD-NC groups. This analysis identified 20 differentially abundant taxa (α = 0.05) with an LDA score higher than 2.0 (Figure 6D). At the phylum level, Bacteroidetes was significantly higher and Firmicutes was significantly lower in the WD group compared to the WD-NC group (Figure 6D). At the family level, Peptostreptococcaceae, Clostridiaceae, Streptococcaceae, Ruminococcaceae, and S24-7 were significantly higher and Lactobacillaceae was significantly lower in the WD group compared to the WD-NC group (Figure 6D).
To assess the impact of P. gingivalis on the gut microbiota of ApoE-/- mice that had been switched to a normal chow diet after being fed a Western diet for 11 weeks, LEfSe was applied to the microbiota data from the WD-NC and WD-NC+Pg groups and identified 10 differentially abundant taxa (α = 0.05) with an LDA score higher than 2.0, respectively (Figure 6E). There were no differentially abundant phyla. At the family level, Anaeroplasmataceae was significantly higher and Lactobacillaceae was significantly lower in the WD-NC+Pg group compared to the WD-NC group (Figure 6E). At the genus level, Anaeroplasma was significantly higher in the WD-NC+Pg group compared to the WD-NC group, while several genera from phylum Firmicutes were significantly higher in the WD-NC group compared to the WD-NC+Pg group (Figure 6E).
3.5.2 Fecal samples
Linear discriminant analysis effect size (LEfSe) was applied to the microbiota data from the three groups that were fed a normal chow diet during the final 11 weeks (NC, WD-NC, WD-NC+Pg) and identified 6 differentially abundant taxa (α = 0.05) with an LDA score higher than 2.0, respectively (Supplementary Figure 4A). There were no differentially abundant phyla. At the family level, Erysipelotrichaceae was most abundant in the fecal samples of the WD-NC+Pg group and Anaeroplasmataceae was most abundant in the NC group (Supplementary Figure 4A).
LEfSe was applied to the microbiota data from the three groups that were fed a Western diet during the first 11 weeks (WD, WD-NC, WD-NC+Pg). This analysis identified 23 differentially abundant taxa (α = 0.05) with an LDA score higher than 2.0, respectively (Supplementary Figure 4B). At the phylum level, Tenericutes was most abundant in the WD-NC+Pg group (Supplementary Figure 4B). At the family level, Mogibacteriaceae, Enterococcaceae, Erysipelotrichaceae, Enterobacteriaceae, Clostridiaceae, and Ruminococcaceae were most abundant in the WD group (Supplementary Figure 4B).
To assess the impact of diet on the gut microbiota of ApoE-/- mice, LEfSe was applied to the microbiota data from the NC and WD groups. This analysis identified 24 differentially abundant taxa (α = 0.05) with an LDA score higher than 2.0, respectively (Supplementary Figure 4C). At the phylum level, Tenericutes was significantly higher in the NC group compared to the WD group (Supplementary Figure 4C). At the family level, Ruminococcaceae, Clostridiaceae, Mogibacteriaceae, Streptococcaceae, Peptostreptococcaceae, and Enterococcaceae were significantly higher in the WD group compared to the NC group, while Peptococcaceae and Anaeroplasmataceae were significantly higher in the NC group compared to the WD group (Supplementary Figure 4C).
To assess the impact of switching from a Western diet to a normal chow diet on the gut microbiota of ApoE-/- mice, LEfSe was applied to the microbiota data from the WD and WD-NC groups. This analysis identified 18 differentially abundant taxa (α = 0.05) with an LDA score higher than 2.0, respectively (Supplementary Figure 4D). There were no differentially abundant phyla. At the family level, Ruminococcaceae, Clostridiaceae, Erysipelotrichaceae, Mogibacteriaceae, Streptococcaceae, Peptostreptococcaceae, Staphylococcaceae, and Enterobacteriaceae were significantly higher in the WD group compared to the WD-NC group (Supplementary Figure 4D).
To assess the impact of P. gingivalis on the gut microbiota of ApoE-/- mice that had been switched to a normal chow diet after being fed a Western diet for 11 weeks, LEfSe was applied to the microbiota data from the WD-NC and WD-NC+Pg groups. This analysis identified 6 differentially abundant taxa (α = 0.05) with an LDA score higher than 2.0, respectively (Supplementary Figure 4E). There were no differentially abundant phyla. At the family level, Erysipelotrichaceae was significantly higher in the WD-NC+Pg group compared to the WD-NC group (Supplementary Figure 4E). At the genus level, Anaeroplasma was significantly higher in the WD-NC+Pg group compared to the WD-NC group (Supplementary Figure 4E).
4. Discussion
Our results confirmed that dietary lipids induced extensive aortic plaque accumulation and established that lowering of dietary lipids resulted decreased levels of plaque. However, the effect of diet-induced lipid lowering on plaque accumulation was blunted by P. gingivalis oral infection. Furthermore, we demonstrate that dietary lipids and P. gingivalis oral infection distinctly alter the intestinal microbiota associated with atherosclerosis development. We postulated that the dysbiosis induced by dietary lipids and P. gingivalis oral infection could be characterized by a decreased community complexity and overgrowth of specific commensal bacteria. Indeed, our analysis revealed decreased alpha diversity in both the WD and the WD-NC+Pg groups compared to the NC group. Previous studies have shown a decrease in alpha diversity in disease compared to healthy controls [35-39]. Analysis of beta diversity also demonstrated that the WD group clustered separately from the other three treatment groups by both unweighted and weighted UniFrac. While we also expected the NC, WD-NC, and WD-NC+PG groups to cluster separately, this was not observed as the WD-NC and WD-NC+Pg groups clustered together. Thus, the presence or absence of taxa described a unique effect of switching from a Western diet to a normal chow diet. Interestingly, only dietary lipids altered community diversity when comparing between groups (beta diversity), but both dietary lipids and P. gingivalis oral infection reduced community complexity (alpha diversity).
We observed that differences in relative abundance of Bacteroidetes were confined to the family S24-7. Family S24-7 was lowest in the NC group and switching from a Western diet to normal chow (WD-NC) reduced the abundance of S24-7. However, the WD-NC+Pg group had increased S24-7 compared to the WD-NC group. These changes in abundance of S24-7 correlated significantly with aortic plaque index. Dietary lipids induced a dysbiosis of the cecal microbiota characterized by an increase in the family S24-7 (phylum Bacteroidetes) and a decrease in the phylum Firmicutes; these results were unexpected based on previous studies. Previous studies reported that P. gingivalis oral infection results in an increase in Bacteroidetes and a decrease in Firmicutes in ileal contents and fecal samples [40, 41]. In contrast, high-fat diet-induced atherosclerosis has been reported to be associated with an increase in Firmicutes and a decrease in Bacteroidetes in fecal samples [42, 43]. As it is well-established that bacterial “specialized metabolites”, i.e., products of bacterial metabolism, can contribute to disease states [29], additional studies are required to determine the mechanism underlying the correlation between S24-7 and plaque index.
Since PCA and hierarchical clustering are unsupervised methods, they were appropriate for this study, which is the first to compare changes in the gut microbiome of ApoE-/- mice in response to high fat feeding. As expected, the WD group serparated by PCA most strongly from the three groups ending on a normal chow diet. We also observed that each of the four groups clustered individually, indicating a distinct effect of P. gingivalis oral infection. Our results suggest that switching to a normal chow diet after 11 weeks on a Western diet results in partial return of the microbial community profile to a normal chow makeup; however, microbial memory is retained as the rescue was incomplete. Interestingly, the microbiota rescue was inhibited by P. gingivalis oral infection, which resulted in another distinct microbial community, demonstrating for the first time a mechanism by which P. gingivalis-induced dysbiosis of the gut microbiota may contribute to systemic inflammation. These unique community profiles correlated with differences in plaque index. Members of Ruminococcus, Oscillospira, and Lachnospiraceae were all elevated in the WD group. These groups are associated with pathogenesis of diabetes in NOD mice [44]. The high abundance of Anaeroplasma (phylum Tenericutes) in the NC group distinguished these mice from mice initially fed a Western diet. Among mice initially fed a Western diet, the WD-NC+Pg group was distinguished by a higher abundance of Anaeroplasma. The mouse with the highest abundance of Anaeroplasma in the WD-NC+Pg group had a very low plaque index, similar to the mice in the NC group. These results suggest that elevated dietary lipids induced shifts in the microbiota that were correlated with plaque accumulation. A lipid-lowering dietary intervention resulted in less plaque accumulation and was characterized by a microbiome profile that was similar to that of mice continuously fed a normal chow diet. P. gingivalis oral infection enhanced plaque accumulation and altered the microbiota in a diet-independent manner.
Collectively, this study has identified distinct microbiota changes accompanying atherosclerotic plaque, suggesting a future avenue for investigation on the impact of the gut microbiota, diet, and P. gingivalis oral infection on atherosclerosis. Such studies will examine the kinetic impact of diet-induced lipid lowering in the context of the gut microbiota. We will utilize a variety of diets to define the impact of specific dietary fat types on atherosclerosis and gut microbiome alterations. Finally, to distinguish between diet-induced effects, independent of microbiota, these studies will be performed under germ-free conditions.
4.1 Conclusions
Our results suggest that, similar to what is observed in the oral cavity [22], P. gingivalis may be a keystone pathogen that modulates the commensal gut microflora leading to dysbiosis associated with systemic vascular inflammation.
Supplementary Material
Supplementary Figure 1. Relative abundance of bacterial taxa in cecal contents. Phylum Firmicutes. A. Class Bacilli. Data were analyzed by one-way ANOVA (p=0.0171). B-D. Class Clostridia (Order Clostridiales). B. Class Clostridia (Order Clostridiales). Data were analyzed by one-way ANOVA (p=0.0187). C. Family Lachnospiraceae. Data were analyzed by one-way ANOVA (p=0.2952). D. Family Ruminococcaceae. Data were analyzed by one-way ANOVA (p<0.0001). NC=normal chow for 22 weeks (n=5), WD=Western diet for 22 weeks (n=6), WD-NC=Western diet for 11 weeks followed by normal chow for 11 weeks (n=6), WD-NC+Pg=Western diet for 11 weeks followed by normal chow for 11 weeks and P. gingivalis oral infection at midpoint (n=8).
Supplementary Figure 2. Beta diversity measures. A. Unweighted UniFrac. B. Weighted UniFrac.
Supplementary Figure 3. Hierarchical clustering and PCA. A. PCA based on treatment group. PC1 (25%), PC2 (11%), PC3 (8%). Log2 transformed, 577/2406 variables were significant, p<0.01, q<0.0416. B. PCA based on treatment group. PC1 (54%), PC2 (10%), PC3 (6%). Log2 transformed, Top 5% (120 variables), p<1.35e-7, q<2.6311e-6. C. Heatmap based on treatment group, metadata group memberships (site of sample collection, plaque index, treatment group, original cage) are indicated by colored blocks at the top or bottom of the heatmap. Log2 transformed, 577/2406 variables were significant, p<0.01, q<0.0416. NC=normal chow for 22 weeks (cages 10 and 18), WD=Western diet for 22 weeks (cages 7 and 12), WD-NC=Western diet for 11 weeks followed by normal chow for 11 weeks (cages 11 and 15), WD-NC+Pg=Western diet for 11 weeks followed by normal chow for 11 weeks and P. gingivalis oral infection at midpoint (cages 8 and 9).
Supplementary Figure 4. Linear discriminant analysis effect size (LEfSe) of fecal samples. A. NC vs. WD-NC vs. WD-NC+Pg. B. WD vs. WD-NC vs. WD-NC+Pg. C. NC vs. WD. D. WD vs. WD-NC. E. WD-NC vs. WD-NC+Pg. Left side= linear discriminant analysis (LDA) plots, listing differentially abundant taxa (α = 0.05) with an LDA score higher than 2.0. The taxon name is preceded by one of the following: p_=phylum, c_=class, o_=o_order, f_=f_family, g_=genus, s_=species. Colored bars indicate LDA score as well as the group in which that taxon was most abundant. White letters within the colored bars correspond to the cladogram, on the right.
Highlights.
The impact of lipid lowering on atherosclerotic plaque accumulation is blunted by P. gingivalis oral infection
Dietary intervention and P. gingivalis oral infection result in distinct bacterial communities in fecal and cecal samples of ApoE-/- mice
P. gingivalis is a keystone pathogen that modulates commensals leading to dysbiosis of the gut microbiota that is associated with systemic vascular inflammation.
Acknowledgments
This work was supported by the National Institutes of Health with a grant from the NIAID P01 AI078894. We thank the Tufts University Core Facility Genomics Core for sequencing and technical support and are grateful to Albert Tai, PhD, for providing technical and bioinformatics support. We are also grateful for Samrawit Mekasha and George Papadopoulos for technical assistance.
Footnotes
Publisher's Disclaimer: This is a PDF file of an unedited manuscript that has been accepted for publication. As a service to our customers we are providing this early version of the manuscript. The manuscript will undergo copyediting, typesetting, and review of the resulting proof before it is published in its final citable form. Please note that during the production process errors may be discovered which could affect the content, and all legal disclaimers that apply to the journal pertain.
References
- 1.Fleg JL, et al. Secondary prevention of atherosclerotic cardiovascular disease in older adults: a scientific statement from the american heart association. Circulation. 2013;128(22):2422–46. doi: 10.1161/01.cir.0000436752.99896.22. [DOI] [PMC free article] [PubMed] [Google Scholar]
- 2.Hansson GK. Inflammation, atherosclerosis, and coronary artery disease. N Engl J Med. 2005;352(16):1685–95. doi: 10.1056/NEJMra043430. [DOI] [PubMed] [Google Scholar]
- 3.Elkind MS. Infectious burden: a new risk factor and treatment target for atherosclerosis. Infect Disord Drug Targets. 2010;10(2):84–90. doi: 10.2174/187152610790963519. [DOI] [PMC free article] [PubMed] [Google Scholar]
- 4.Kiechl S, et al. Chronic infections and the risk of carotid atherosclerosis: prospective results from a large population study. Circulation. 2001;103(8):1064–70. doi: 10.1161/01.cir.103.8.1064. [DOI] [PubMed] [Google Scholar]
- 5.Li L, et al. Porphyromonas gingivalis infection accelerates the progression of atherosclerosis in a heterozygous apolipoprotein E-deficient murine model. Circulation. 2002;105(7):861–7. doi: 10.1161/hc0702.104178. [DOI] [PubMed] [Google Scholar]
- 6.Maekawa T, et al. Chronic oral infection with Porphyromonas gingivalis accelerates atheroma formation by shifting the lipid profile. PLoS One. 2011;6(5):e20240. doi: 10.1371/journal.pone.0020240. [DOI] [PMC free article] [PubMed] [Google Scholar]
- 7.Gibson FC, 3rd, et al. Innate immune recognition of invasive bacteria accelerates atherosclerosis in apolipoprotein E-deficient mice. Circulation. 2004;109(22):2801–6. doi: 10.1161/01.CIR.0000129769.17895.F0. [DOI] [PubMed] [Google Scholar]
- 8.Hayashi C, et al. Porphyromonas gingivalis accelerates inflammatory atherosclerosis in the innominate artery of ApoE deficient mice. Atherosclerosis. 2011;215(1):52–9. doi: 10.1016/j.atherosclerosis.2010.12.009. [DOI] [PMC free article] [PubMed] [Google Scholar]
- 9.Hussain M, Stover CM, Dupont A. P. gingivalis in Periodontal Disease and Atherosclerosis - Scenes of Action for Antimicrobial Peptides and Complement. Front Immunol. 2015;6:45. doi: 10.3389/fimmu.2015.00045. [DOI] [PMC free article] [PubMed] [Google Scholar]
- 10.Papadodima O, et al. Application of an integrative computational framework in trancriptomic data of atherosclerotic mice suggests numerous molecular players. Adv Bioinformatics. 2012;2012:453513. doi: 10.1155/2012/453513. [DOI] [PMC free article] [PubMed] [Google Scholar]
- 11.Bjorkbacka H, et al. Reduced atherosclerosis in MyD88-null mice links elevated serum cholesterol levels to activation of innate immunity signaling pathways. Nat Med. 2004;10(4):416–21. doi: 10.1038/nm1008. [DOI] [PubMed] [Google Scholar]
- 12.Michelsen KS, et al. Lack of Toll-like receptor 4 or myeloid differentiation factor 88 reduces atherosclerosis and alters plaque phenotype in mice deficient in apolipoprotein E. Proc Natl Acad Sci U S A. 2004;101(29):10679–84. doi: 10.1073/pnas.0403249101. [DOI] [PMC free article] [PubMed] [Google Scholar]
- 13.Hayashi C, et al. Protective role for TLR4 signaling in atherosclerosis progression as revealed by infection with a common oral pathogen. J Immunol. 2012;189(7):3681–8. doi: 10.4049/jimmunol.1201541. [DOI] [PMC free article] [PubMed] [Google Scholar]
- 14.Papadopoulos G, et al. A mouse model for pathogen-induced chronic inflammation at local and systemic sites. J Vis Exp. 2014;(90):e51556. doi: 10.3791/51556. [DOI] [PMC free article] [PubMed] [Google Scholar]
- 15.Plump AS, et al. Severe hypercholesterolemia and atherosclerosis in apolipoprotein E-deficient mice created by homologous recombination in ES cells. Cell. 1992;71(2):343–53. doi: 10.1016/0092-8674(92)90362-g. [DOI] [PubMed] [Google Scholar]
- 16.Nakashima Y, et al. ApoE-deficient mice develop lesions of all phases of atherosclerosis throughout the arterial tree. Arterioscler Thromb. 1994;14(1):133–40. doi: 10.1161/01.atv.14.1.133. [DOI] [PubMed] [Google Scholar]
- 17.Kramer CD, et al. Distinct gene signatures in aortic tissue from ApoE-/- mice exposed to pathogens or Western diet. BMC Genomics. 2014;15:1176. doi: 10.1186/1471-2164-15-1176. [DOI] [PMC free article] [PubMed] [Google Scholar]
- 18.Jonsson AL, Backhed F. Role of gut microbiota in atherosclerosis. Nat Rev Cardiol. 2017;14(2):79–87. doi: 10.1038/nrcardio.2016.183. [DOI] [PubMed] [Google Scholar]
- 19.van den Elsen LW, et al. Embracing the gut microbiota: the new frontier for inflammatory and infectious diseases. Clin Transl Immunology. 2017;6(1):e125. doi: 10.1038/cti.2016.91. [DOI] [PMC free article] [PubMed] [Google Scholar]
- 20.Panda S, Guarner F, Manichanh C. Structure and functions of the gut microbiome. Endocr Metab Immune Disord Drug Targets. 2014;14(4):290–9. doi: 10.2174/1871530314666140714120744. [DOI] [PubMed] [Google Scholar]
- 21.Jandhyala SM, et al. Role of the normal gut microbiota. World J Gastroenterol. 2015;21(29):8787–803. doi: 10.3748/wjg.v21.i29.8787. [DOI] [PMC free article] [PubMed] [Google Scholar]
- 22.Hajishengallis G. The inflammophilic character of the periodontitis-associated microbiota. Mol Oral Microbiol. 2014;29(6):248–57. doi: 10.1111/omi.12065. [DOI] [PMC free article] [PubMed] [Google Scholar]
- 23.Lozupone C, Knight R. UniFrac: a new phylogenetic method for comparing microbial communities. Appl Environ Microbiol. 2005;71(12):8228–35. doi: 10.1128/AEM.71.12.8228-8235.2005. [DOI] [PMC free article] [PubMed] [Google Scholar]
- 24.Caporaso JG, et al. QIIME allows analysis of high-throughput community sequencing data. Nat Methods. 2010;7(5):335–6. doi: 10.1038/nmeth.f.303. [DOI] [PMC free article] [PubMed] [Google Scholar]
- 25.Edgar RC. Search and clustering orders of magnitude faster than BLAST. Bioinformatics. 2010;26(19):2460–1. doi: 10.1093/bioinformatics/btq461. [DOI] [PubMed] [Google Scholar]
- 26.Foxman B, Martin ET. Use of the Microbiome in the Practice of Epidemiology: A Primer on -Omic Technologies. Am J Epidemiol. 2015;182(1):1–8. doi: 10.1093/aje/kwv102. [DOI] [PMC free article] [PubMed] [Google Scholar]
- 27.Robinson CK, Brotman RM, Ravel J. Intricacies of assessing the human microbiome in epidemiologic studies. Ann Epidemiol. 2016;26(5):311–21. doi: 10.1016/j.annepidem.2016.04.005. [DOI] [PMC free article] [PubMed] [Google Scholar]
- 28.Vogtmann E, Goedert JJ. Epidemiologic studies of the human microbiome and cancer. Br J Cancer. 2016;114(3):237–42. doi: 10.1038/bjc.2015.465. [DOI] [PMC free article] [PubMed] [Google Scholar]
- 29.Sharon G, et al. Specialized metabolites from the microbiome in health and disease. Cell Metab. 2014;20(5):719–30. doi: 10.1016/j.cmet.2014.10.016. [DOI] [PMC free article] [PubMed] [Google Scholar]
- 30.Murphy EA, Velazquez KT, Herbert KM. Influence of high-fat diet on gut microbiota: a driving force for chronic disease risk. Curr Opin Clin Nutr Metab Care. 2015;18(5):515–20. doi: 10.1097/MCO.0000000000000209. [DOI] [PMC free article] [PubMed] [Google Scholar]
- 31.Joliffe IT, Morgan BJ. Principal component analysis and exploratory factor analysis. Stat Methods Med Res. 1992;1(1):69–95. doi: 10.1177/096228029200100105. [DOI] [PubMed] [Google Scholar]
- 32.Lundberg R, et al. Microbiota composition of simultaneously colonized mice housed under either a gnotobiotic isolator or individually ventilated cage regime. Sci Rep. 2017;7:42245. doi: 10.1038/srep42245. [DOI] [PMC free article] [PubMed] [Google Scholar]
- 33.McCafferty J, et al. Stochastic changes over time and not founder effects drive cage effects in microbial community assembly in a mouse model. ISME J. 2013;7(11):2116–25. doi: 10.1038/ismej.2013.106. [DOI] [PMC free article] [PubMed] [Google Scholar]
- 34.Segata N, et al. Metagenomic biomarker discovery and explanation. Genome Biol. 2011;12(6):R60. doi: 10.1186/gb-2011-12-6-r60. [DOI] [PMC free article] [PubMed] [Google Scholar]
- 35.Manichanh C, et al. Reduced diversity of faecal microbiota in Crohn's disease revealed by a metagenomic approach. Gut. 2006;55(2):205–11. doi: 10.1136/gut.2005.073817. [DOI] [PMC free article] [PubMed] [Google Scholar]
- 36.Turnbaugh PJ, et al. A core gut microbiome in obese and lean twins. Nature. 2009;457(7228):480–4. doi: 10.1038/nature07540. [DOI] [PMC free article] [PubMed] [Google Scholar]
- 37.Kostic AD, Xavier RJ, Gevers D. The microbiome in inflammatory bowel disease: current status and the future ahead. Gastroenterology. 2014;146(6):1489–99. doi: 10.1053/j.gastro.2014.02.009. [DOI] [PMC free article] [PubMed] [Google Scholar]
- 38.Giongo A, et al. Toward defining the autoimmune microbiome for type 1 diabetes. ISME J. 2011;5(1):82–91. doi: 10.1038/ismej.2010.92. [DOI] [PMC free article] [PubMed] [Google Scholar]
- 39.Chen J, et al. An expansion of rare lineage intestinal microbes characterizes rheumatoid arthritis. Genome Med. 2016;8(1):43. doi: 10.1186/s13073-016-0299-7. [DOI] [PMC free article] [PubMed] [Google Scholar]
- 40.Nakajima M, et al. Oral Administration of P. gingivalis Induces Dysbiosis of Gut Microbiota and Impaired Barrier Function Leading to Dissemination of Enterobacteria to the Liver. PLoS One. 2015;10(7):e0134234. doi: 10.1371/journal.pone.0134234. [DOI] [PMC free article] [PubMed] [Google Scholar]
- 41.Arimatsu K, et al. Oral pathobiont induces systemic inflammation and metabolic changes associated with alteration of gut microbiota. Sci Rep. 2014;4:4828. doi: 10.1038/srep04828. [DOI] [PMC free article] [PubMed] [Google Scholar]
- 42.Chan YK, et al. High fat diet induced atherosclerosis is accompanied with low colonic bacterial diversity and altered abundances that correlates with plaque size, plasma A-FABP and cholesterol: a pilot study of high fat diet and its intervention with Lactobacillus rhamnosus GG (LGG) or telmisartan in ApoE-/- mice. BMC Microbiol. 2016;16(1):264. doi: 10.1186/s12866-016-0883-4. [DOI] [PMC free article] [PubMed] [Google Scholar]
- 43.Rom O, et al. Acrolein increases macrophage atherogenicity in association with gut microbiota remodeling in atherosclerotic mice: protective role for the polyphenol-rich pomegranate juice. Arch Toxicol. 2017;91(4):1709–1725. doi: 10.1007/s00204-016-1859-8. [DOI] [PubMed] [Google Scholar]
- 44.Krych L, et al. Gut microbial markers are associated with diabetes onset, regulatory imbalance, and IFN-gamma level in NOD mice. Gut Microbes. 2015;6(2):101–9. doi: 10.1080/19490976.2015.1011876. [DOI] [PMC free article] [PubMed] [Google Scholar]
Associated Data
This section collects any data citations, data availability statements, or supplementary materials included in this article.
Supplementary Materials
Supplementary Figure 1. Relative abundance of bacterial taxa in cecal contents. Phylum Firmicutes. A. Class Bacilli. Data were analyzed by one-way ANOVA (p=0.0171). B-D. Class Clostridia (Order Clostridiales). B. Class Clostridia (Order Clostridiales). Data were analyzed by one-way ANOVA (p=0.0187). C. Family Lachnospiraceae. Data were analyzed by one-way ANOVA (p=0.2952). D. Family Ruminococcaceae. Data were analyzed by one-way ANOVA (p<0.0001). NC=normal chow for 22 weeks (n=5), WD=Western diet for 22 weeks (n=6), WD-NC=Western diet for 11 weeks followed by normal chow for 11 weeks (n=6), WD-NC+Pg=Western diet for 11 weeks followed by normal chow for 11 weeks and P. gingivalis oral infection at midpoint (n=8).
Supplementary Figure 2. Beta diversity measures. A. Unweighted UniFrac. B. Weighted UniFrac.
Supplementary Figure 3. Hierarchical clustering and PCA. A. PCA based on treatment group. PC1 (25%), PC2 (11%), PC3 (8%). Log2 transformed, 577/2406 variables were significant, p<0.01, q<0.0416. B. PCA based on treatment group. PC1 (54%), PC2 (10%), PC3 (6%). Log2 transformed, Top 5% (120 variables), p<1.35e-7, q<2.6311e-6. C. Heatmap based on treatment group, metadata group memberships (site of sample collection, plaque index, treatment group, original cage) are indicated by colored blocks at the top or bottom of the heatmap. Log2 transformed, 577/2406 variables were significant, p<0.01, q<0.0416. NC=normal chow for 22 weeks (cages 10 and 18), WD=Western diet for 22 weeks (cages 7 and 12), WD-NC=Western diet for 11 weeks followed by normal chow for 11 weeks (cages 11 and 15), WD-NC+Pg=Western diet for 11 weeks followed by normal chow for 11 weeks and P. gingivalis oral infection at midpoint (cages 8 and 9).
Supplementary Figure 4. Linear discriminant analysis effect size (LEfSe) of fecal samples. A. NC vs. WD-NC vs. WD-NC+Pg. B. WD vs. WD-NC vs. WD-NC+Pg. C. NC vs. WD. D. WD vs. WD-NC. E. WD-NC vs. WD-NC+Pg. Left side= linear discriminant analysis (LDA) plots, listing differentially abundant taxa (α = 0.05) with an LDA score higher than 2.0. The taxon name is preceded by one of the following: p_=phylum, c_=class, o_=o_order, f_=f_family, g_=genus, s_=species. Colored bars indicate LDA score as well as the group in which that taxon was most abundant. White letters within the colored bars correspond to the cladogram, on the right.