

SUMMARY
Overcoming metabolic stress is a critical step in tumor growth. Acetyl-CoA generated from glucose and acetate uptake is important for histone acetylation and gene expression. However, how acetyl-CoA is produced under nutritional stress is unclear. We demonstrate here that glucose deprivation results in AMPK-mediated acetyl-CoA synthetase 2 (ACSS2) phosphorylation at S659, which exposed the nuclear localization signal of ACSS2 for importin α5 binding and nuclear translocation. In the nucleus, ACSS2 binds to transcription factor EB and translocates to lysosomal and autophagy gene promoter regions, where ACSS2 incorporates acetate generated from histone acetylation turnover to locally produce acetyl-CoA for histone H3 acetylation in these regions and promote lysosomal biogenesis, autophagy, cell survival, and brain tumorigenesis. In addition, ACSS2 S659 phosphorylation positively correlates with AMPK activity in glioma specimens and grades of glioma malignancy. These results underscore the significance of nuclear ACSS2-mediated histone acetylation in maintaining cell homeostasis and tumor development.
Keywords: ACSS2, nucleus, acetyl-CoA, TFEB, AMPK, lysosomal biogenesis, autophagy, tumor development
Graphical abstract
INTRODUCTION
Histone acetylation plays instrumental roles in regulating chromatin architecture, DNA replication, and gene transcription by recruiting proteins containing bromodomains, altering subnuclear localization and the structure of chromatin, and neutralizing histone-positive charges, which may loosen interactions between histones and DNA (Li et al., 2007). Histone acetylation can be dynamically regulated by families of histone acetyltransferases and histone deacetylases, which add or remove acetyl units from lysine residues of histones (Kurdistani and Grunstein, 2003; Li et al., 2007). Acetyl coenzyme A (CoA) is a central intermediate of carbon sources that not only fuels ATP production via the tricarboxylic acid (TCA) cycle and functions as an essential building block for the synthesis of fatty acids but also is the obligatory acetyl donor for lysine acetylation reactions in mammalian cells critical for cell growth and survival (Cai et al., 2011). In eukaryotes, biosynthesis of acetyl-CoA is thought to occur in the needed subcellular compartment because it is membrane-impermeable and very unstable owing to a high-energy thioester bond between the acetyl and CoA groups (Sutendra et al., 2014). Acetyl-CoA can be generated by cytoplasmic ATP-citrate lyase (ACL), the mitochondrial pyruvate dehydrogenase complex (PDC), and cytoplasmic and mitochondrial acetyl-CoA synthetase (ACSS) from citrate, pyruvate, and acetate, respectively. Intriguingly, all three enzymes are also present in the nucleus (Sutendra et al., 2014; Takahashi et al., 2006; Wellen et al., 2009). ACL, using glucose oxidation-derived mitochondrial citrate as its substrate, is a major regulator for nuclear acetyl-CoA generation in mammalian cells in nutrient-rich environments, whereas growth signals, such as serum and epidermal growth factor, promote the PDC-dependent nuclear acetyl-CoA generation and histone acetylation (Sutendra et al., 2014; Takahashi et al., 2006). An important, but largely unaddressed question is how cells regulate histone acetylation under metabolic stress conditions, such as hypoxia, in which the amount of nutrients such as glucose, acetate, and growth factors are limited, as often seen in tumor microenvironments.
The mammalian genome contains ACSS genes encoding for three enzymes capable of catalyzing the ATP-dependent synthesis of acetyl-CoA via the ligation of acetate and CoA: ACSS1 and ACSS3 are mitochondrial proteins, whereas ACSS2 is localized to the cytoplasmic and nuclear compartments of mammalian cells (Comerford et al., 2014; Fujino et al., 2001). ACSS2, which is expressed in a large proportion of human tumors, is responsible for the majority of cellular acetate uptake (Comerford et al., 2014; Lyssiotis and Cantley, 2014; Mashimo et al., 2014). Under hypoxic and low-serum conditions, ACSS2 promotes acetate utilization and maintains cancer cell growth (Schug et al., 2015). ACSS2 depletion or deficiency largely inhibited tumor cell growth and tumor formation in mice (Comerford et al., 2014; Mashimo et al., 2014). These findings highlighted a critical role for acetate consumption in the production of lipid biomass for tumor growth. However, whether ACSS2 regulates tumor development by directly regulating gene expression, especially under metabolic stress, in which extracellular acetate is limited, is unclear.
In the present study, we found that glucose deprivation resulted in 5′ AMP-activated protein kinase (AMPK)-mediated ACSS2 phosphorylation at S659 and exposure of the nuclear localization signal (NLS) of ACSS2 for nuclear translocation in glioblastoma (GBM) cells. In complexes with transcription factor EB (TFEB), nuclear ACSS2 activates lysosomal and autophagosomal genes by locally producing acetyl-CoA for histone H3 acetylation in the promoter regions of these genes by utilizing acetate generated from the turnover of histone acetylation. Nuclear activity of ACSS2 is required for glucose deprivation-induced lysosomal biogenesis and autophagy, cell survival, and tumor growth.
RESULTS
ACSS2 S659 phosphorylation by AMPK induces nuclear translocation of ACSS2
To determine the role of ACSS2 in counteracting metabolic stress, we treated U87 human glioblastoma cells with glucose-deprived DMEM for 1 h. Immunofluorescent analysis demonstrated that ACSS2 (Figure 1A), but not ACSS1 or ACSS3 (Figure S1A), translocated into the nucleus (Figure 1A). Cell fractionation analysis demonstrated that glucose deprivation, which resulted in serine-threonine kinase liver kinase B1 (LKB1)-dependent phosphorylation and activation of AMPK as expected (Figure 1B, left panel) (Jeon et al., 2012; Shackelford and Shaw, 2009), caused translocation of more than 90% of cytosolic ACSS2 into the nucleus (Figure 1B, right panel). Similar to glucose deprivation, treatment with the glucose metabolism inhibitor 2-deoxy-D-glucose (2-DG) (Figures S1B and S1C) but not with sorbitol (Figure S1D) induced nuclear translocation of ACSS2 in a 2-DG dosage- and time-dependent manner.
Figure 1. ACSS2 S659 phosphorylation by AMPK induces nuclear translocation of ACSS2.
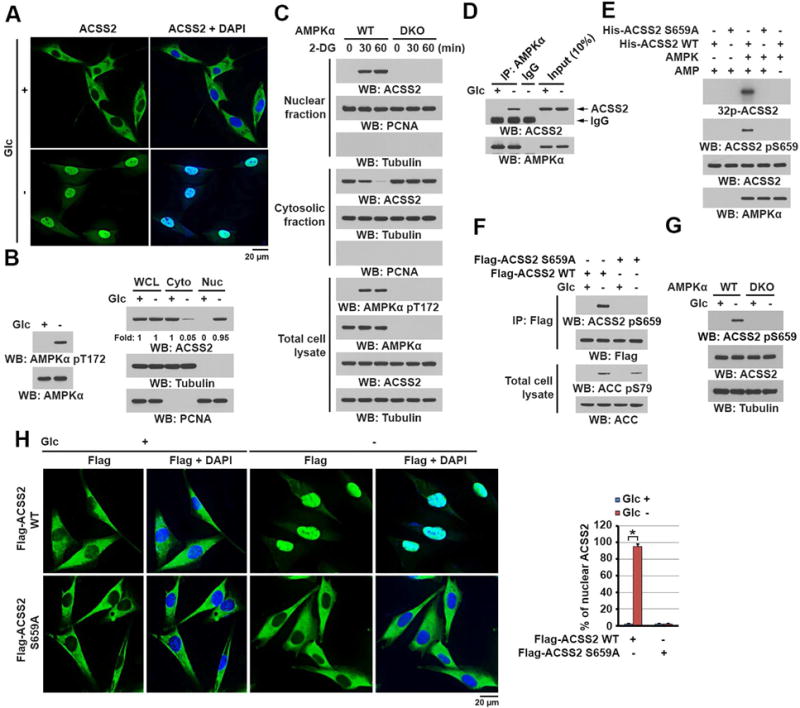
(B–G) Immunoblot analyses were performed with the indicated antibodies.
(A) U87 cells were deprived of glucose for 1 h. Immunofluorescent analyses were performed with an anti-ACSS2 antibody. DAPI (blue) was used to stain the nuclei.
(B) U87 cells were deprived of glucose for 1 h. Total cell lysates and cytosolic and nuclear fractions were prepared. Activation of AMPK is reflected by AMPKα T172 phosphorylation.
(C) WT and AMPKα1 and AMPKα2 double-knockout (DKO) MEFs were treated with 2-DG (25 mM) for the indicated periods. Total cell lysates and cytosolic and nuclear fractions were prepared.
(D) U87 cells were deprived of glucose for 10 min. Immunoprecipitation with an anti-AMPKα antibody was performed.
(E) Purified AMPK was mixed with the indicated bacterially purified His-ACSS2 proteins and [γ-32P] ATP in the presence or absence of AMP (100 μM). Autoradiographic analysis was performed.
(F) U87 cells expressing the indicated Flag-ACSS2 proteins were deprived of glucose for 1 h. Immunoprecipitation with an anti-Flag antibody was performed. Activation of AMPK is reflected by its substrate acetyl CoA carboxylase (ACC) S79 phosphorylation.
(G) WT and AMPKα1/2 DKO MEFs were deprived of glucose for 1 h. Total cell lysates were prepared.
(H) U87 cells expressing the indicated Flag-ACSS2 proteins were deprived of glucose for 1 h. Immunofluorescent analyses were performed with an anti-Flag antibody. The percentage of nuclear ACSS in 20 cells in each group were quantitated (right panel) using the ImageJ software program. A two tailed Student’s t test was used. ∗ represents P < 0.001.
See also Figure S1.
To identify the mechanism underlying nuclear translocation of ACSS2, we examined the potential involvement of AMPK, a key metabolic regulator that governs glucose and lipid metabolism in response to alterations in nutrient and intracellular energy levels (Mo et al., 2015; Shackelford and Shaw, 2009). The heterotrimeric protein AMPK is formed by its α, β, and γ subunits, and the α subunit can exist as either the α1 or α2 isoform (Mo et al., 2015; Shackelford and Shaw, 2009). Pretreatment of U87 cells with the AMPK inhibitor compound C, which inhibited AMPK-dependent acetyl-CoA carboxylase (ACC) phosphorylation, blocked glucose deprivation-induced nuclear translocation of ACSS2 (Figure S1E). In agreement with this finding, ACSS2 failed to translocate into the nucleus in glucose deprivation-treated mouse embryonic fibroblasts (MEFs) with AMPKα1/2 deficiency (Figure 1C). In contrast, treatment with the AMPK activator A769662 or metformin induced nuclear translocation of ACSS2 (Figure S1F). To further elucidate the relationship between AMPK and ACSS2, we conducted a co-immunoprecipitation assay and found that glucose deprivation induced the binding of endogenous ACSS2 to endogenous AMPKα (Figure1D), but not to ERK1/2 MAP kinases (Figure S1G). Ca2+/calmodulin-dependent protein kinase kinase β (CaMKKβ) and LKB1 phosphorylates AMPK at T172, leading to its activation (Oakhill et al., 2010). Incubation of purified His-ACSS2 with purified WT AMPKα2 or AMPKα2 T172A (Figure S1H, left panel) in the presence or absence of purified CaMKKβ showed that CaMKKβ-phosphorylated AMPKα2, but not nonphosphorylated WT AMPKα2 or AMPKα2 T172A, bound to ACSS2, indicating that activation of AMPK is required for direct binding of AMPK to ACSS2 (Figure S1H, right panel).
An in vitro protein phosphorylation assay demonstrated that purified bacteria-expressed His-AMPK phosphorylated purified bacteria-expressed His-ACSS2 in the presence but not absence of the AMPK activator AMP (Figure 1E). Analysis of the ACSS2 amino acid sequence using the Scansite revealed that ACSS2 S659, which is an evolutionarily conserved residue in different species, is a potential phosphorylation residue in a putative AMPK substrate motif (Figure S1I). Mutation of ACSS2 S659 into Ala abrogated AMPK-mediated ACSS2 phosphorylation, which was detected using an antibody specifically recognizing ACSS2 pS659 (Figure 1E). In addition, glucose deprivation-induced (Figures 1F and 1G) and 2-DG–induced (Figure S1J) ACSS2 S659 phosphorylation was abolished by ACSS2 S659A expression (Figure 1F), AMPK α deficiency (Figure 1G), and compound C treatment (Figure S1J). Importantly, the ACSS2 S659A mutant failed to translocate into the nucleus upon glucose deprivation as detected by immunofluorescent (Figure 1H) and immunoblot (Figure S1K) analysis. These results indicated that AMPK phosphorylated ACSS2 at S659, which induced nuclear translocation of ACSS2.
ACSS2 S659 phosphorylation exposes the NLS of ACSS2 to bind to importin α5
To determine whether ACSS2 contains a NLS that is exposed for importin binding only after AMPKα-dependent phosphorylation of ACSS2, we mutated the Arg 664/665 in the putative NLS sequences (amino acids 656–668) close to the carboxy-terminus of ACSS2 into alanine (Figure 2A). Immunofluorescent (Figure 2B) and cell fractionation (Figure 2C) analyses demonstrated that Flag-ACSS2 R664/665A, unlike wild-type (WT) ACSS2, was unable to translocate into the nucleus upon glucose deprivation. This result indicated that the NLS containing R664/665 in ACSS2 is essential for glucose deprivation-induced nuclear translocation of ACSS2.
Figure 2. ACSS2 phosphorylation at S659 exposes the NLS of ACSS2 to bind to importin α5.
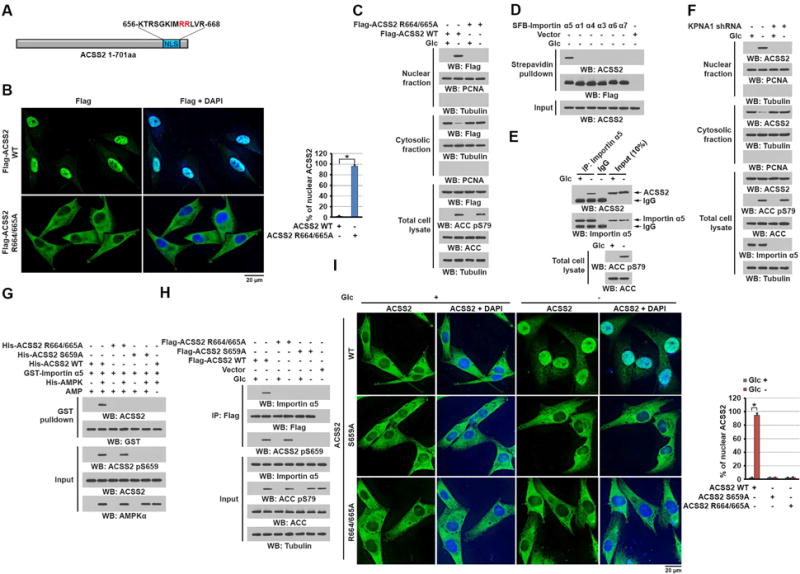
(C–H) Immunoblotting analyses were performed with the indicated antibodies.
(A) Schematic of ACSS2 showing its potential NLS predicted by the NLStradamus tool.
(B and C) U87 cells expressing the indicated Flag-ACSS2 proteins were deprived of glucose for 1 h. Immunofluorescent analyses were performed with an anti-Flag antibody and the percentage of nuclear ACSS in 20 cells in each group were quantitated (right panel) using the ImageJ software program (B). Total cell lysates and cytosolic and nuclear fractions were prepared (C). A two tailed Student’s t test was used. ∗ represents P < 0.001. (D) U87 cells expressing the indicated SFB-tagged importin α proteins were deprived of glucose for 10 min. A pull-down assay with streptavidin agarose beads was performed.
(E) U87 cells were deprived of glucose for 10 min. Immunoprecipitation with an anti-importin α5 antibody was performed.
(F) U87 cells with or without importin α5 depletion were deprived of glucose for 1 h. Total cell lysates and cytosolic and nuclear fractions were prepared.
(G) Purified GST-importin α5 was mixed with the indicated purified His-ACSS2 proteins in the presence or absence of active AMPK. A GST pull-down assay was performed.
(H) U87 cells expressing the indicated Flag-ACSS2 proteins were deprived of glucose for 10 min. Immunoprecipitation with an anti-Flag antibody was performed.
(I) Parental and the indicated U87 cells with knock-in of ACSS2 S659A or R664/665A were deprived of glucose for 1 h. Immunofluorescent analyses were performed with an anti-ACSS2 antibody. The percentage of nuclear ACSS in 20 cells in each group were quantitated (right panel) using the ImageJ software program. A two tailed Student’s t test was used. ∗ represents P < 0.001.
See also Figure S2.
Importin α functions as an adaptor that links NLS-containing proteins with importin β, which then docks the ternary complex at the nuclear-pore complex to facilitate translocation of these proteins across the nuclear envelope. Six importin α family members (α1, α3, α4, α5, α6, and α7) have been identified in humans (Yang et al., 2012). Glucose deprivation induced the binding of ACSS2 to SFB-tagged importin α5 but not to importin α1, α3, α4, α6, or α7 (Figure 2D). This was validated by a co-immunoprecipitation assay demonstrating that endogenous ACSS2 bound to endogenous importin α5 upon glucose deprivation (Figure 2E). In addition, depletion of importin α5 using KPNA1 (coding for importin α5) short hairpin RNA largely blocked glucose deprivation-induced nuclear translocation of ACSS2 (Figure 2F), indicating an essential role for importin α in nuclear translocation of ACSS2.
To determine whether AMPK-mediated ACSS2 S659 phosphorylation plays a role in the binding of ACSS2 to importin α5, we mixed purified WT His-ACSS2, His-ACSS2 S659A, or His-ACSS2 R664/665A with GST-importin α5 in the presence or absence of purified His-AMPK and/or AMP. As shown in Figure 2G, WT His-ACSS2 alone did not bind to importin α5. However, inclusion of AMPK in the presence but not the absence of AMP enabled ACSS2 to interact with importin α5. In contrast, inclusion of His-ACSS2 S659A or His-ACSS2 R664/665A (Figure 2G) or presence of compound C (Figure S2A) inhibited the binding of ACSS2 to importin α5. These in vitro results were supported by a co-immunoprecipitation assay demonstrating that glucose deprivation induced the binding of endogenous importin α5 to WT Flag-ACSS2 but not to Flag-ACSS2 S659A or Flag-ACSS2 R664/665A (Figure 2H). These results strongly suggested that phosphorylation of ACSS2 S659 by AMPK leads to exposure of intramolecularly masked R664/665 in the ACSS2 NLS for binding to importin α5, which is required for nuclear translocation of ACSS2.
We next used the CRISPR/Cas9 genome editing knock-in technology to replace endogenous ACSS2 with ACSS2 S659A, ACSS2 R664/665A, or catalytically inactive ACSS2 T363K in U87 and U251 glioblastoma cells (Figures S2B and S2C) (Ingram-Smith et al., 2006). Expression of ACSS2 S659A and ACSS2 R664/665A, which had catalytic activity comparable with that of WT ACSS2 (Figure S2D), blocked glucose deprivation-induced nuclear translocation of ACSS2 as demonstrated by immunofluorescent (Figure 2I) and immunoblot (Figure S2D) analyses. Of note, expression of ACSS2 R664/665A was still phosphorylated at S659 (Figure S2E). In contrast, the catalytically inactive ACSS2 T363K mutant (Ingram-Smith et al., 2006) (Figure S2C) was still able to translocate into the nucleus of U87 and U251 cells (Figures S2F and S2G), indicating that the observed subcellular redistribution of ACSS2 occurred independently of its catalytic activity. Taken together, these results indicated that AMPK phosphorylates ACSS2 at S659, which promotes the binding of ACSS2 to importin α5 and subsequent nuclear translocation of ACSS2.
TFEB-associated ACSS2 binds to the promoter regions of lysosomal and autophagy genes and promotes expression of these genes
To determine the nuclear function of ACSS2, we immunoprecipitated it, analyzed its interacting proteins (Table S1), and observed that an approximately 70-kDa protein interacted with ACSS2 in U87 cells only under glucose-deprivation condition (Figure 3A). We identified this protein as TFEB via mass spectrometry (Figure S3A). TFEB functions as a master gene in lysosomal biogenesis by coordinating expression of lysosomal hydrolases and membrane proteins and in expression of genes involved in autophagy (Sardiello et al., 2009). Both lysosomal biogenesis and autophagy are specifically required for maintenance of intracellular amino acid pools (Perera et al., 2015). It was shown that AMPK regulates TFEB-dependent regulation of lysosomes (Young et al., 2016). It was also reported that mammalian target of rapamycin (mTOR)-dependent TFEB phosphorylation at S211, which triggered the binding of 14-3-3 proteins to TFEB, caused TFEB to be retained in the cytosol (Roczniak-Ferguson et al., 2012; Settembre et al., 2012). Co-immunoprecipitation analyses demonstrated that TFEB bound to ACSS2 in the nucleus but not in the cytosol in U87 cells (Figure 3B). As expected, glucose deprivation, which inhibited mTOR activity (Mo et al., 2015; Shackelford and Shaw, 2009), resulted in the nuclear translocation and co-localization of TFEB with ACSS2 (Figure S3C). Of note, depletion of TFEB and reconstituted expression of an RNA interference-resistant (r) TFEB R245/248A nuclear translocation-deficient mutant (Roczniak-Ferguson et al., 2012) blocked glucose deprivation-induced nuclear translocation of TFEB but not of ACSS2 (Figure S3B), indicating that TFEB and ACSS2 separately translocated into the nucleus, where they formed a complex. This finding was further supported by mTOR inhibition induced by amino acid withdrawal or treatment with the mTOR inhibitor Torin 1, which did not affect AMPK activity, resulted in nuclear translocation of TFEB but not of ACSS2 (Figure S3C).
Figure 3. TFEB-associated ACSS2 binds to the promoter regions of lysosomal and autophagy genes and promotes expression of these genes.
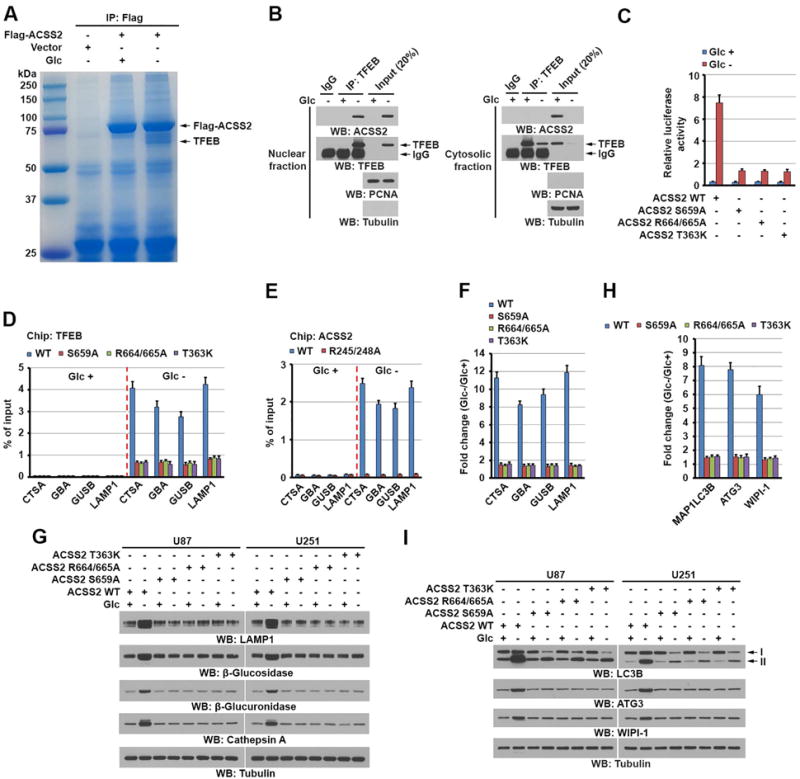
(B, G and I) Immunoblotting analyses with the indicated antibodies were performed.
(A) U87 cells with or without expressing Flag-ACSS2 were deprived of glucose for 1 h. Immunoprecipitates of Flag-ACSS2 with an anti-Flag antibody were separated using sodium dodecyl sulfate (SDS)-polyacrylamide gel electrophoresis (PAGE) and stained with Coomassie Brilliant Blue. The indicated protein band was excised for mass spectrometric analysis and identified as TFEB (peptide hits, 92).
(B) U87 cells were deprived of glucose for 1 h. Cytosolic and nuclear fractions were prepared. Immunoprecipitation with an anti-TFEB antibody was performed.
(C) Parental U87 cells and the indicated clones of cells with ACSS2 S659A, R664/665A, or T363K knock-in were infected with luciferase-reporter lentiviruses carrying four tandem copies of intact CLEAR elements. These cells were treated with or without glucose starvation for 10 h. Transcription was measured according to firefly luciferase activity. Luciferase activities were normalized to the cell numbers obtained from the duplicated samples. The data are presented as the mean ± standard deviation (SD) for triplicate samples.
(D) Parental and the indicated U87 cells with knock-in of ACSS2 S659A, R664/665A, or T363K mutant were deprived of glucose for 1 h. ChIP analyses using an anti-TFEB antibody were performed. The histogram shows the amount of immunoprecipitated DNA expressed as a percentage of the total input DNA. The data are presented as the mean ± SD for triplicate samples.
(E) Endogenous TFEB-depleted U87 cells with reconstituted expression of WT rTFEB or rTFEB R245/248A were treated with or without glucose starvation for 1 h. ChIP analyses were performed using an anti-ACSS2 antibody. The histogram shows the amount of immunoprecipitated DNA expressed as a percentage of the total input DNA. The data are presented as the mean ± SD for triplicate samples.
(F and G) Parental and the indicated U87 and U251 cells with knock-in of ACSS2 S659A, R664/665A, or T363K mutant were deprived of glucose for 10 h. Quantitative polymerase chain reaction (PCR) analysis (F) of the mRNAs of the indicated genes in U87 cells (F) and immunoblot analyses of U87 and U251 cells (G) with the indicated antibodies were performed. Data were normalized for β-actin mRNA levels and presented as fold changes induced by glucose deprivation (F).
(H) Parental and the indicated U87 cells with knock-in of ACSS2 S659A, R664/665A, or T363K mutant were deprived of glucose for 10 h. Quantitative PCR analysis of the mRNAs of the indicated genes was performed. Data were normalized for β-actin mRNA levels and presented as fold changes induced by glucose deprivation. The data are presented as the mean ± SD for triplicate samples.
(I) Parental and the indicated U87 or U251 cells with knock-in of ACSS2 S659A, R664/665A, or T363K mutant were deprived of glucose for 10 h. Immunoblot analyses with the indicated antibodies were performed.
See also Figures S3, S4, S5 and Tables S1, S2, S3.
To determine the role of ACSS2 S659 phosphorylation in the interaction between ACSS2 and TFEB, we depleted endogenous ACSS2 in U87 cells and expressed NLS-ACSS2 S659A fusion protein (Figure S3D), which contained the NLS of SV40 large T-antigen and ACSS2 S659A and was localized in the nucleus without glucose deprivation (Figure S3E). Glucose deprivation induced the binding of NLS-ACSS2 S659A to TFEB (Figure S3F). These results indicated that ACSS2 S659 phosphorylation, which is required for its nuclear translocation, is not directly involved in the interaction with TFEB.
We next expressed the TFEB R245/248A in ACSS2 R664/665A knock-in U87 cells (Figure S3G) and revealed their interaction upon glucose deprivation (Figure S3H). These results suggested that cytosolic and importin binding-deficient TFEB R245/248A released from 14-3-3 by AMPK-dependent mTOR inhibition is able to bind to cytosolic and importin-binding deficient ACSS2 R664/665A. However, WT TFEB did not bind to ACSS2 R664/665A, suggesting that importin has greater ability to bind to TFEB than does ACSS2 R664/665A. This finding was supported by immunblotting analysis showing that depletion of importin 8 (IPO 8), which is specific for TFEB-nuclear translocation (Perera et al., 2015), enabled WT TFEB to bind to ACSS2 R664/665A in response to glucose deprivation (Figure S3I). These results strongly suggested that glucose deprivation resulted in accessibility of AMPK-phosphorylated WT ACSS2 and dephosphorylated WT TFEB to importin for separate nuclear translocation.
To determine the interaction regions of TFEB and ACSS2, we performed an in vitro binding assay by mixing purified WT ACSS2, WT TFEB, and different truncation mutants of both ACSS2 and TFEB. Figure S3J shows that non-phosphorylated WT ACSS2 binds to non-phosphorylated WT TFEB, and their interaction requires the N-termini of both proteins. In addition, co-immunoprecipitation analyses did not detect complex formation of ACSS2 with the other TFE family members (Perera et al., 2015), TFE3, TFEC or MITF (Figure S3K), suggesting that ACSS2 specifically binds to TFEB.
To determine whether the binding of ACSS2 to TFEB regulates the transcriptional activity of TFEB, we infected U87 cells with luciferase-reporter lentiviruses containing the Coordinated Lysosomal Expression and Regulation (CLEAR) element, a motif recognized by TFEB. A luciferase assay demonstrated that glucose deprivation induced TFEB activation in U87 cells with knock-in of WT ACSS2. This induction was largely inhibited in U87 cells with knock-in of ACSS2 S659A, ACSS2 R664/665A, or inactive ACSS2 T363K (Figure 3C). These results indicated that TFEB activation is dependent on nuclear translocation of ACSS2 and its catalytic activity.
TFEB activation upregulates expression of lysosomal genes, including the lysosomal enzymes cathepsin A (encoded by CTSA), β-glucuronidase (encoded by GBA), and β-glucosidase (encoded by GUSB), as well as the lysosomal membrane protein LAMP1 (encoded by LAMP1) (Sardiello et al., 2009). A chromatin immunoprecipitation (ChIP) assay with antibodies against TFEB or ACSS2 demonstrated that glucose deprivation results in the binding of TFEB (Figure 3D) and ACSS2 (Figure 3E) to the promoter regions of CTSA, GBA, GUSB, and LAMP1; in addition, the binding TFEB and ACSS2 was blocked by knock-in of ACSS2 mutants (S659A, R664/665A, and T363K) and reconstituted expression of the nuclear translocation-deficient rTFEB R245/248A mutant, respectively. These results indicated that TFEB and ACSS2 are mutually required for their binding to the promoter regions of lysosomal genes. In line with these findings, glucose deprivation induced mRNA (Figure 3F) and protein (Figure 3G) expression for these lysosomal genes, which was largely abrogated by knock-in of ACSS2 mutants (S659A, R664/665A, and T363K). The effect of expression of these mutants was rescued by overexpression WT Flag-ACSS2 (Figure S4A). In contrast, ACSS2 R664/665A expression did not alter the mRNA levels of glucose deprivation-upregulated and non-TFEB target genes p21, cpt1c, and cyclin G (Figure S4B) (Bungard et al., 2010). These findings indicated that the binding of ACSS2 to the promoter regions of lysosomal genes and the catalytic activity of ACSS2 are required for expression of these genes.
It is known that TFEB activation also upregulates expression of genes involved in autophagy formation (Perera et al., 2015), and glucose deprivation increases autophagy (Russell et al., 2014). As expected, we found that glucose deprivation induced the binding of TFEB (Figure S4C) and ACSS2 (Figure S4D) to the promoter regions of MAP1LC3B, ATG3, and WIPI-1 as well as mRNA (Figure 3H) and protein (Figure 3I) expression of these genes; this induction was blocked by knock-in of the ACSS2 S659A, R664/665A, and T363K mutants (Figures 3H and 3I) whereas the lysosomal inhibitor, chloroquine, had no effect on the inhibited LC3B expression mediated by ACSS2 R664/665A (Figure S4E). These results suggested that glucose deprivation enhanced-autophagosomal gene expression, which is regulated by nuclear ACSS2/TFEB-dependent gene transcription, is not induced by potential lysosomal defect. In addition, compound C treatment blocked glucose deprivation-induced expression of both autophagosomal and lysosomal genes in GBM cells (Figure S4F) while reconstituited expression of ACSS2 R664/665A in H1299 non-small cell lung cancer cells and PANC-1 pancreatic carcinoma cells (Figure S4G) also blocked these gene expression (Figures S4H and S4I) and lysosomal and autophagic expansion (Figures S4J and S4K), suggesting the observed effects are not cell line- or tumor type-dependent. Of note, reconstituted expression of phosphomimic ACSS2 S659D mutant (Figure S4L), which translocated into the nucleus in the absence of glucose deprivation (Figure S4M), failed to induce TFEB-dependent gene expression (Figure S4N), suggesting that nuclear translocation of both ACSS2 and TFEB are required for TFEB-dependent gene expression.
To determine the global genomic regulation by ACSS2 and TFEB, we performed chromatin immunoprecipitation combined with high-throughput sequencing (ChIP–seq) experiments using an anti-ACSS2 or anti-TFEB antibody. Notably, we found 81% of the ACSS2 target genes were also TFEB target genes, including genes related autophagy and lysosomal pathways (Figures S5A and S5B, Tables S2 and S3). The peak scores corresponding to the union of binding sites between ACSS2 and TFEB ChIP showed significant correlation (Pearson correlation coefficient = 0.53, P < 0.001) (Figure S5C). In addition, signals from both ACSS2 and TFEB ChIP were enriched at transcription start site (TSS) regions (−1k to +1k bp) upon glucose deprivation and the overall binding profile of ACSS2 ChIP is highly similar to TFEB ChIP (Figure S5D). Transcription factor motif analysis indicated a single dominant de novo motif for both ACSS2 and TFEB ChIP with a high degree of concordance (Figure S5E). The overlapping region of both motifs corresponded to the E-box sequence (5′-CANNTG-3′) that TFEB recognizes. In addition, the combination of the left flanking GT of ACSS2 motif, the overlapping region and the right flanking AC of TFEB motif exactly corresponded to the CLEAR-box sequence (5′-GTCACGTGAC-3′) which is specifically recognized by TFEB and presents in the regulatory regions of many lysosomal and autophagosomal genes. Indeed, we found the genes related to lysosomal and autophagosomal pathways were significantly enriched in the ACSS2 ChIP peaks (P < 0.001 for both pathways) (Figure S5F). Together, these results support the theory of TFEB, in complex with nuclear ACSS2, binding to the promoter regions of lysosomal and autophagosomal gene in order to promote the expression of these genes.
Nuclear ACSS2 mediates local generation of acetyl-CoA and subsequent histone H3 acetylation in the promoter regions of lysosomal and autophagosomal genes
ACSS2 produces acetyl-CoA from acetate (Watkins et al., 2007). However, glucose deprivation and limited amount of acetate in regular DMEM restrict the production of acetyl-CoA from citrate by ACL, from pyruvate by PDC, and from medium-uptake acetate by cytosolic ACSS2. As expected, glucose deprivation and regular DMEM culture resulted in a large reduction of nuclear acetyl-CoA levels in U87 cells (Figure 4A). Intriguingly, knock-in of ACSS2 S659A, R664/665A, and T363K caused a further reduction of nuclear acetyl-CoA levels (Figure 4A), indicating that nuclear ACSS2 is involved in production of nuclear acetyl-CoA. In line with this finding and the results revealing the binding of ACSS2 to the promoter regions of the lysosomal (Figure 3E) and autophagosomal genes (Figure S4D), a ChIP assay with an anti-total acetylated histone H3 antibody demonstrated that glucose deprivation induced histone H3 acetylation in the promoter regions of lysosomal (Figure 4B) and autophagosomal (Figure 4C) genes in U87 cells. Similar results were also observed using an anti-H3K9 acetylation and an anti-total acetylated histone H2B antibodies (Figures S5G and S5H). Importantly, knock-in of ACSS2 S659A, R664/665A, and T363K mutants (Figures 4B and 4C) or compound C treatment (Figure S5I) blocked histone H3 acetylation in these promoter regions, whereas depletion of ACL or PDHA1 had little effect on this acetylation (Figure S5J). Of note, ACSS2 R664/665A expression also blocked glucose deprivation-induced histone H3 Arg17 dimethylation in the autophagosomal gene promoters (Figure S5K), and H3 Arg17 dimethylation was known be regulated by co-activator-associated arginine methyltransferase 1 (CARM1) in complex with TFEB (Shin et al., 2016). These results indicated that nuclear ACSS2 plays an instrumental role in nuclear acetyl-CoA production and subsequent histone H3 acetylation and methylation at the promoter regions of lysosomal and autophagosomal genes upon glucose deprivation.
Figure 4. Nuclear ACSS2 mediates local generation of acetyl-CoA and subsequent histone H3 acetylation in the promoter regions of lysosomal and autophagosomal genes.
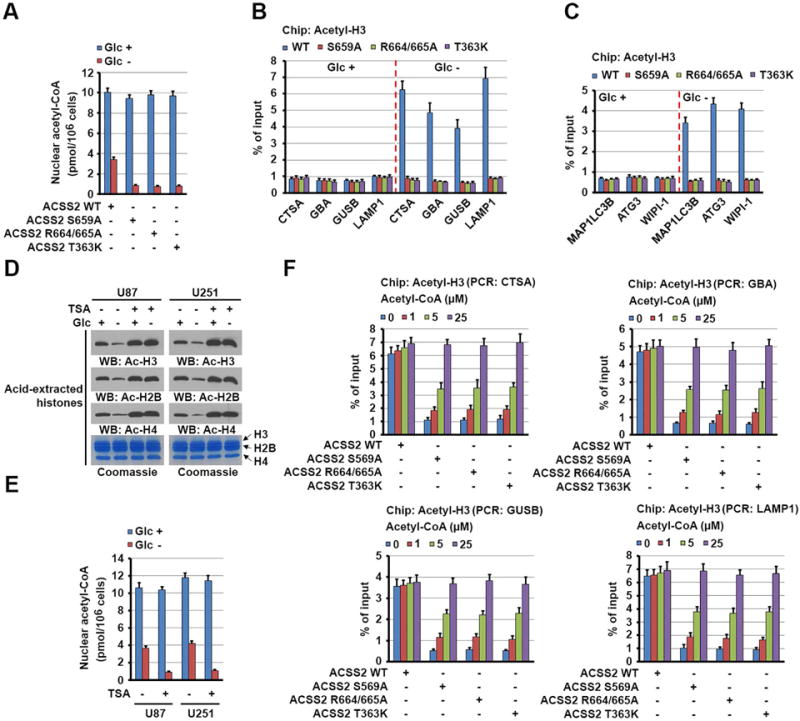
(A–C) Parental and the indicated U87 cells with knock-in of ACSS2 S659A, R664/665A, or T363K mutant were deprived of glucose for 1 h. The levels of nuclear acetyl-CoA were measured (A). ChIP analyses using an anti-acetylated H3 antibody were performed. PCR with the primers against the promoter regions of the indicated lysosomal (B) and autophagosomal (C) genes was performed. The histogram shows the amount of immunoprecipitated DNA expressed as a percentage of the total input DNA. The data are presented as the mean ± SD for triplicate samples.
(D and E) U87 and U251 cells were deprived of glucose for 1 h in the absence or presence of TSA (500 nM). Acid-extracted histones visualized using Coomassie Blue staining were subjected to immunoblot analyses of acetylated histone levels with the indicated antibodies (D). Nuclear fractions of the cells were prepared, and the levels of nuclear acetyl-CoA were measured (E).
(F) Parental and the indicated U87 cells with knock-in of ACSS2 S659A, R664/665A, or T363K mutant were deprived of glucose for 1 h. The cells were permeabilized with digitonin (30 μg/ml) for 5 min and treated with the indicated concentrations of acetyl-CoA for 30 min. ChIP analyses using an anti-acetylated H3 antibody were performed. The histogram shows the amount of immunoprecipitated DNA expressed as a percentage of the total input DNA. The data are presented as the mean ± SD for triplicate samples.
See also Figure S5.
Given the limited amount of exogenous acetate in DMEM, we hypothesized that ACSS2 uses acetate released from deacetylated proteins to produce acetyl-CoA for epigenetic regulation (Lyssiotis and Cantley, 2014). Because the half-life of histone acetylation is on the order of minutes, a considerable fraction of acetate can be produced in vivo by the turnover of histone acetylation (Comerford et al., 2014). To confirm this, we examined the total acetylation levels in U87 and U251 cells for histones H3, H4, and H2B, which decreased markedly upon glucose deprivation (Figure 4D), although we detected increased histone H3 acetylation in the promoter regions of lysosomal and autophagosomal genes. Of note, pretreatment of the cells with the histone deacetylase inhibitor TSA, which blocked glucose-deprivation-induced reductions in the total acetylation levels of the three histones (Figure 4D), decreased nuclear acetyl-CoA levels (Figure 4E) and largely reduced glucose deprivation-induced histone H3 acetylation in the promoter regions of lysosomal genes (Figure S5L) and these gene expression (Figure S5M). In agreement with these results, addition of acetyl-CoA to regular DMEM-cultured and digitonin-permeabilized cells rescued inhibited histone H3 acetylation in the promoter regions of lysosomal (Figure 4F) and autophagosomal (data not shown) genes in U87 cells with knock-in of ACSS2 S659A, R664/665A, and T363K mutants in a dose-dependent manner (Figure 4F). Taken together, these results strongly suggested that lysosomal and autophagosomal gene promoter-associated ACSS2 utilizes the acetate generated by turnover of histone acetylation to produce acetyl-CoA, which is required for local histone H3 acetylation in the promoter regions of lysosomal and autophagosomal genes.
Nuclear ACSS2 promotes lysosomal biogenesis and autophagy
To determine the functional consequence of nuclear translocation of ACSS2, we performed immunofluorescent analyses of U87 cells, which demonstrated increased staining intensity for the lysosome membrane protein LAMP1 under glucose deprivation (Figure 5A); this increased staining was blocked by knock-in of the ACSS2 S659A, R664/665A, and T363K mutants. Similarly, glucose deprivation-induced autophagy, as evidenced by increased numbers of endogenous LC3B (Figure 5B) and GFP-LC3 puncta (Figure S6A) in the cells and increased conversion of LC3B-I to LC3B-II (a phosphatidylethanolamine derivative of LC3-I) (Figure 3I), was inhibited by knock-in of the ACSS2 S659A, R664/665A, and T363K mutants. Consistently, electron microscopic analyses of U87 cells demonstrated that glucose deprivation induced marked increases in lysosome and autophagosome numbers per cell, and this increase was blocked by knock-in of the ACSS2 R664/665A and T363K mutants (Figure 5C). As expected, glucose deprivation for 24 h decreased the survival of U87 cells, and the observed cell death rate was largely enhanced by knock-in of ACSS2 S659A, R664/665A or T363K mutant (Figure 5D), indicating that glucose deprivation-induced autophagy and lysosomal biogenesis are required for cell survival in response to this metabolic stress.
Figure 5. Nuclear ACSS2 promotes lysosomal biogenesis and autophagy.
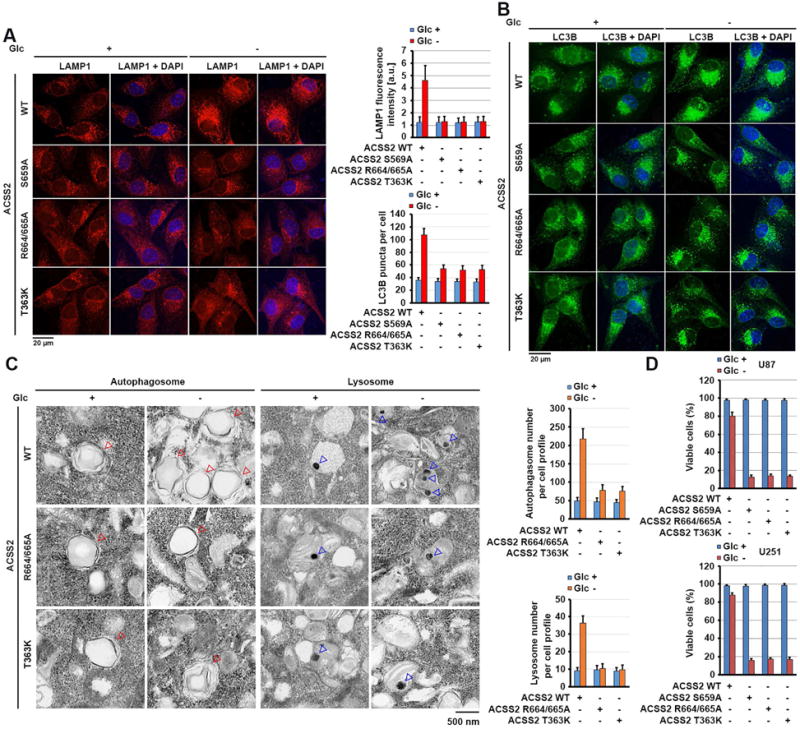
(A and B) Parental and the indicated U87 cells with ACSS2 S659A, R664/665A, or T363K knock-in were deprived of glucose for 10 h. Immunofluorescent analyses were performed with anti-LAMP1 (A) and anti-LC3B (B) antibodies. The immunofluorescence intensity in 100 cells (A) or the numbers of LC3B puncta in 20 cells (B) was quantitated using the ImageJ software program.
(C) Parental and the indicated U87 cells with knock-in of ACSS2 R664/665A or T363K mutant were deprived of glucose for 10 h. Electron microscopic analyses were performed. The blue and red arrows point to the lysosome and autophagosome, respectively (left panel). The lysosomes and autophagosomes in 10 cells in each group were quantitated (right panel).
(D) Parental and the indicated U87 cells with knock-in of ACSS2 S659A, ACSS2 R664/665A, or T363K mutant were deprived of glucose for 24 h and stained with trypan blue (0.5%). The viable cells were counted.
See also Figure S6.
Nuclear ACSS2 promotes brain tumorigenesis
To examine the role of regulation of autophagy and lysosomal biogenesis by ACSS2 in tumorigenesis, we expressed doxcycline-inducible ACSS2 shRNA in U87 cells (Figure S6B) and subcutaneously injected these cells into the flank regions of nude mice. We showed that expression of ACSS2 shRNA in established tumors inhibited tumor growth (Figures S6C, S6D, and S6E), Ki67 expression (Figure S6F), and TFEB-targeted gene expression (Figure S6G). In addition, we intracranially injected athymic nude mice with U87 cells with or without knock-in of the ACSS2 S659A, R664/665A, or T363K mutant. Expression of these ACSS2 mutants inhibited tumor growth (Figure 6A), indicating that the nuclear function of ACSS2 to counteract nutritional stress promotes tumor growth. To further support this finding, we inhibited glucose utilization by tumor cells via intraperitoneal injection of 2-DG. In line with the finding that glucose deprivation reduced U87 and U251 cell survival (Figure 5D), treatment with 2-DG reduced the growth of tumors expressing WT ACSS2 (Figure 6A). In contrast, we observed greater inhibition of the growth of tumors with knock-in of ACSS2 S659A, R664/665A, or T363K mutant (Figure 6A). Immunohistochemical (IHC) analyses of tumor tissues with specificity-validated antibodies (Figure S6H) demonstrated that a tumor expressing WT ACSS2 had higher basal levels of nuclear ACSS2 expression, ACSS2 S659 phosphorylation, and LAMP-1 and LC3B expression than did tumors expressing S659A or R664/665A (Figure S6I). 2-DG treatment resulted in a further increase in the levels of nuclear ACSS2 expression, ACSS2 S659 phosphorylation, and LAMP-1 and LC3B expression in the tumor expressing WT ACSS2 but not in tumors expressing S659A or R664/665A. In addition, ACSS2 T363K-expressing tumors exhibited accumulation of nuclear ACSS2 and enhanced ACSS2 S659 phosphorylation without alteration of the expression of LAMP-1 and LC3B upon treatment with 2-DG. These results indicated that inhibition of glycolysis results in the nuclear translocation of ACSS2, which enhances autophagy and lysosomal biogenesis for maintenance of cellular homeostasis during tumor growth.
Figure 6. Nuclear ACSS2 promotes brain tumorigenesis.
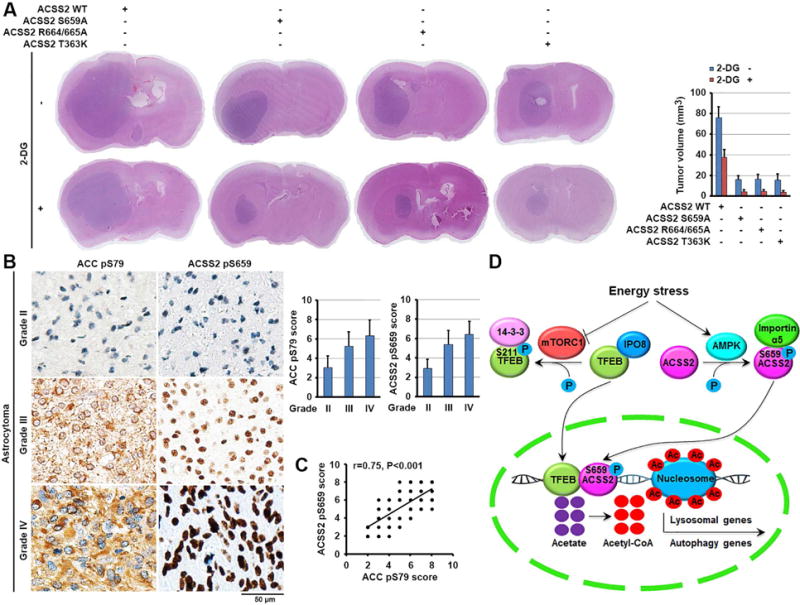
(A) Parental and the indicated U87 cells with knock-in of ACSS2 S659A, ACSS2 R664/665A, or T363K mutant were intracranially injected into athymic nude mice. Two weeks after tumor-cell injection, 0.2 ml of 2-DG (500 mg/kg) was delivered to the mice via intraperitoneal administration daily for 14 days. Hematoxylin- and eosin (H&E)-stained coronal brain sections show representative tumor xenografts (left panel). The tumor volume was calculated (right panel).
(B, C) Twenty eight diffuse astrocytoma (grade II), 30 anaplastic astrocytoma (grade III) and 58 glioblastoma (grade IV) specimens were immunohistochemically stained with the indicated antibodies. Representative photos of tumors are shown (left). Data represent the mean ± SD of 28 diffuse astrocytoma specimens, 30 anaplastic astrocytoma and 58 glioblastoma specimens (right) (B). Pearson correlation test was used (C). Note that some of the dots on the graphs represent more than one specimen (i.e., some scores overlapped). p < 0.001.
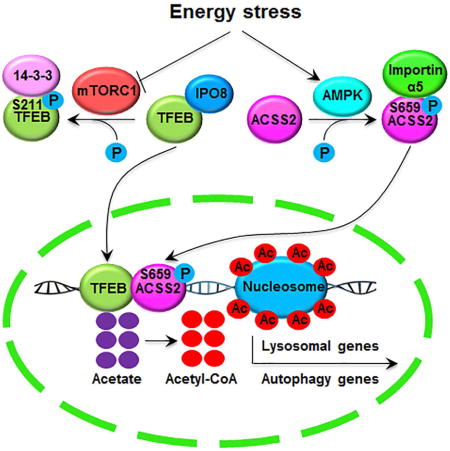
(D) A mechanism of nuclear ACSS2-enhanced lysosomal biogenesis and autophagy. Glucose deprivation resulted in AMPK-phosphorylation-dependent formation of an ACSS2 and TFEB complex in the promoter regions of lysosomal and autophagy genes, where ACSS2 incorporated acetate from the turnover of histone acetylation into acetyl-CoA for histone H3 acetylation, gene expression, and enhanced lysosomal biogenesis and autophagy.
See also Figure S6.
We next performed IHC analyses and revealed that phosphorylation levels of ACSS2 S659 and ACC S79 in samples from patients (28 cases) with low-grade diffuse astrocytoma (World Health Organization [WHO] grade II; median survival time >5 years) were significantly lower than those from patients with anaplastic astrocytoma (30 cases) (grade III), and glioblastoma (58 cases) (grade IV) (Figure 6B) (Furnari et al., 2007). In addition, we revealed that levels of ACSS2 pS659 correlated with the levels of ACC pS79 in the glioma specimens (Figure 6C). Quantification of the staining on a scale of 0 to 8 showed that these correlations were significant (Figure 6C). These results support a role of ACSS2 S659 phosphorylation in clinical aggressiveness of human glioma.
DISCUSSION
Cancer metabolism is programmed to facilitate survival and proliferation of cancer cells in the nonnative tumor microenvironment (Lyssiotis and Cantley, 2014). A rapidly growing tumor encounters nutritional stresses, and enhanced lysosomal biogenesis and autophagy are important in counteracting these stresses. This counteraction is mediated by autophagy-dependent delivery of intracellular proteins, lipids, and organelles to the lysosomal compartment, where the resulting breakdown products, such as amino acids, nucleosides, carbohydrates, and fatty acids, provide substrates for both biosynthesis and energy generation, maintaining cellular homeostatsis (Levine and Kroemer, 2008; Mizushima et al., 2008; Rabinowitz and White, 2010). In addition, the lysosome plays an important role in degradation of macromolecules received from the secretory, endocytic, and phagocytic pathways; plasma membrane repair; cellular clearance and secretion; signaling regulation; and immune response (Settembre et al., 2013). In the present study, we demonstrated that glucose deprivation or treatment of tumor cells with 2-DG resulted in AMPK-mediated phosphorylation of ACSS2 at S659 for exposure of the NLS of ACSS2 and its resulting recognition by importin α5 and subsequent nuclear translocation. In the nuclei of tumor cells, ACSS2 formed complexes with TFEB, which was released from mTORC1-medicated cytosolic retention, these complexes were guided by TFEB to TFEB-regulated promoter regions of lysosomal and autophagosomal genes. Acetyl-CoA locally produced by ACSS2 using acetate generated from nuclear protein deacetylation was then used for histone H3 acetylation in these promoter regions, leading to the expression of lysosomal and autophagosomal genes for enhanced lysosomal biogenesis and autophagy. Inhibition of nuclear translocation of ACSS2 abrogated glucose deprivation-induced lysosomal biogenesis and autophagy, reduced tumor cell survival, and inhibited brain tumorigenesis (Figure 6D).
In a tumor microenvironment with ample nutrients and oxygen, tumor cells generate nuclear acetyl-CoA for histone acetylation and gene expression regulation by ACL-catalyzed glucose oxidation-derived mitochondrial citrate and PDC-catalyzed pyruvate (Sutendra et al., 2014; Takahashi et al., 2006). Acetate is used as a nutritional source by cancer cells in an ACSS2-dependent manner, supplying a significant fraction of the carbon within the fatty acid and phospholipid pools and promoting lipid synthesis (Gao et al., 2016; Schug et al., 2015). Rapid tumor growth inevitably leads to metabolic stress, which tumor cells have to overcome to maintain their growth (Jones and Thompson, 2009). We demonstrated that with a lack of sufficient glucose and acetate in the tumor microenvironment, nuclear translocation of ACSS2 provides a rapid way to reconvert the acetate generated from deacetylation of histones or other nuclear proteins to acetyl-CoA for use in reacetylating histones in the promoter regions of lysosomal and autophagosomal genes for cell survival and growth. This finding elucidates an instrumental interplay between reprogramming of metabolism and, epigenetically, gene expression in cancer cells, which is mediated by gene promoter region-generated acetyl-CoA by nuclear ACSS2. Inhibition of the nuclear function of ACSS2 synergistically enhanced the effect of treatment with 2-DG on brain tumor growth, strongly suggesting that a rational combination of inhibition of glycolysis and the nuclear function of ACSS2 is an efficient approach for treatment of human cancer.
STAR★Methods
Contact for Reagent and Resource Sharing
Further information and requests for reagents may be directed to, and will be fulfilled by, the lead contact, Dr. Zhimin Lu (zhiminlu@mdanderson.org).
Experimental Model and Subject Details
Xenograft studies
For the orthotropic brain tumor model, GBM cells (1 × 10⁶) were injected intracranially (in 5 μl of DMEM per mouse) with WT or mutated ACSS2 into 4-week-old male athymic nude mice (six mice/group). The injections were performed as described previously (Yang et al., 2011). 2-DG– based treatments were initiated 14 days after intracranial injection of tumor cells. 2-DG (0.2 ml [500 mg/kg]) was delivered via intraperitoneal administration daily for the duration of the experiment. Animals were sacrificed 28 days after cell injection. For the subcutaneous tumor model, GBM cells (1 × 10⁶) expressing the inducible non-target shRNA or ACSS2 shRNA were subcutaneously injected (in 100 μl of DMEM per injection) into left or right flanks of 4-week-old male athymic nude mice (n = 5), respectively. Doxycycline treatment was initiated 9 days after subcutaneous injection of tumor cells. Doxycycline (2 mg/ml in 5% sucrose) was delivered via drinking water during the experiment. Tumor size was measured every 3 days, and the mice were sacrificed 27 days after cell injection. The brain or dissected tumor of each mouse was harvested and weighted, fixed in 4% formaldehyde, and embedded in paraffin. Tumor formation and phenotype were determined via histologic analysis of H&E-stained sections. Tumor volume was calculated using the following formula with length a and width b: V = ab2/2. The animals were administered treatment in accordance with relevant institutional and national guidelines and regulations. The use of animals in this study was approved by the Institutional Review Board at The University of Texas MD Anderson Cancer Center.
Histologic evaluation and immunohistochemical staining
Mouse tumor samples were fixed and prepared for staining. The samples were stained with Mayer’s hematoxylin and eosin (BioGenex). Slides were then mounted using Universal mount (Research Genetics).
The immunohistochemical staining was performed using the VECTASTAIN ABC kit (VECTOR LABORATORIES, CA) according to manufacturer’s instructions. Sections of paraffin-embedded xenograft tissue were stained with antibodies against ACSS2, ACSS2 pS659, LAMP1, LC3B or nonspecific IgG as a negative control. The tissue sections from paraffin-embedded human GBM specimens were stained with antibodies against phospho-ACC S79, phospho-ACSS2 S659, or nonspecific IgG as a negative control. We quantitatively scored the tissue sections according to the percentage of positive cells and staining intensity, as previously defined (Li et al., 2016). We assigned the following proportion scores: 0 if 0% of the tumor cells showed positive staining, 1 if 0% to 1%, 2 if 2% to 10%, 3 if 11% to 30%, 4 if 31% to 70%, and 5 if 71% to 100%. We also rated the intensity of staining on a scale of 0 to 3: 0, negative; 1, weak; 2, moderate; and 3, strong. We then combined the proportion and intensity scores to obtain a total score (range: 0, 2–8). All patients had received standard adjuvant radiotherapy after surgery, which was followed by treatment with an alkylating agent (temozolomide in most cases). The use of human brain tumor specimens and the database was approved by the Institutional Review Board at Capital Medical University and The University of Texas MD Anderson Cancer Center.
Cell lines and cell culture conditions
The human glioblastoma cell lines U87 and U251 authenticated using short tandem repeat profiling in The University of Texas MD Anderson Cancer Center and AMPKα1/2 double-knockout mouse embryonic fibroblasts (a gift from B. Viollet, Institut Cochin, Paris, France), H1299 human lung carcinoma cells, and PANC-1 human pancreas ductal adenocarcinoma cells were maintained in Dulbecco’s modified Eagle’s medium (DMEM) supplemented with 10% dialyzed bovine calf serum (HyClone).
Method Details
Materials
Rabbit polyclonal antibody recognizing phosphorylated ACSS2 S659 was obtained from Jiaxing Xinda Biological Technology. A peptide containing ACSS2 pS659 was injected into rabbits. The rabbit serum was collected and purified using an affinity column conjugated with nonphosphorylated ACSS2 S659 peptide to exclude antibodies recognizing nonphosphorylated ACSS2 followed by an affinity column conjugated with phosphorylated ACSS2 S659 peptide to bind to and purify the phosphorylated ACSS2 S659 antibody. The phosphorylated ACSS2 S659 antibody was then eluted and concentrated. Working concentrations of 1 μg/ml and 5 μg/ml were used for immunoblotting.
Rabbit polyclonal antibodies recognizing ACSS2, ACL, and importin α5 were obtained from GeneTex. Rabbit polyclonal antibodies recognizing AMPKα, AMPKα pT172, ATG3, ACC, ACC pS79, and chloroquine were obtained from Cell Signaling Technology. Compound C, rabbit polyclonal antibodies against acetyl-histone H3, acetyl-histone H4, acetyl-histone H2B, and Ki67 were obtained from Millipore. A mouse monoclonal antibody recognizing proliferating cell nuclear antigen was obtained from BD Transduction Laboratories. Rabbit polyclonal antibodies recognizing H3R17me2, acetyl-H3K9, LC3B and LAMP1 were obtained from Abcam. Monoclonal antibodies against GST, tubulin, β-glucosidase, β-glucuronidase, WIPI-1, TFEB, IPO 8 and PDHA1, human IPO8 siRNA, control siRNA, A769662 were purchased from Santa Cruz Biotechnology. A mouse monoclonal antibody against Flag, anti-Flag M2 agarose beads, streptavidin-conjugated agarose beads, DAPI, 2-Deoxy-D-glucose (2-DG), sorbitol, doxycycline, adenosine 5′-monophosphate (AMP), metformin, digitonin, trichostatin A (TSA), phenylmethylsulfonyl fluoride (PMSF), CoA, ATP, sodium acetate, bovine serum albumin, purine nucleoside phosphorylase (PNP), and yeast pyrophosphatase were purchased from Sigma. Nucleoside analog MESG [2-Amino-6-mercapto-7-methylpurine, inner salt] was purchased from Setareh Biotech (Eugene, OR). Horseradish peroxidase- or fluorescent-conjugated goat anti-mouse, rabbit secondary antibodies, anti-cathepsin A antibody, TFEB cDNA, ACSS1 cDNA, and ACSS3 cDNA were obtained from Thermo Fisher Scientific. Active AMPK and CAMKKβ recombinant proteins were purchased from SignalChem. HyFect transfection reagents were obtained from Denville Scientific. [γ-32P]-ATP was purchased from MP Biomedicals. PX458 plasmid used for gene editing was obtained from Addgene (Ran et al., 2013). pcDNA3.1-(HA)2− TFE3 and pEGFP-C1-MITF plasmids are a gift of Nabeel Bardeesy from Harvard Medical School (Perera et al., 2015). pEYFP-N1-TFEC plasmid is a gift of Richard Youle from National Institutes of Health (Nezich et al., 2015).
In vitro kinase assay
Kinase reactions were performed as described previously (Ji et al., 2009). In brief, purified recombinant AMPK or CAMKKβ (10 ng) was incubated with ACSS2 or AMPKα (100 ng) in 25 μl of kinase buffer (50 mM Tris-HCl, pH 7.5, 100 mM KCl, 5 mM MgCl2, 1 mM Na3VO4, 50 μM DTT, 5% glycerol, 50 μM ATP, 10 μCi of [γ32P]-ATP) at 25 °C for 1 h. The reactions were terminated with the addition of SDS-PAGE loading buffer and heated to 100 °C. The reaction mixtures were then subjected to SDS-PAGE.
Purification of recombinant proteins
Expression of His-ACSS2, His-ACSS2 truncations, His-TFEB, Flag-ACSS2, His-TFEB truncations, Flag-TFEB, and glutathione S-transferase (GST)-importin α5 was induced in bacteria, and these proteins were purified as described previously (Xia et al., 2007). Briefly, BL21(DE3) cells expressing (His)6-, GST-tagged or Flag-tagged ACSS2, TFEB, and importin α5 were cultured in 250 ml of LB medium and treated with isopropyl β-D-1-thiogalactopyranoside (IPTG) for 16 h at 30 °C before lysis via sonication. Flag-tagged WT AMPKα2 and AMPKα2 T172A recombinant proteins were expressed in 293T cells. Briefly, a pcDNA3.1 plasmid (10 μg) expressing Flag-tagged WT AMPKα2 or AMPKα2 T172A recombinant proteins was transfected into 293T cells seeded in a 15cm-diameter dish with confluence of 70%. Forty eight hours after transfection, the cells were incubated with fresh DMEM supplemented with 10% bovine calf serum for 1 h and then harvested with a non-denaturing lysis buffer (20 mM Tris HCl pH 8.0, 137 mM NaCl, 1% NP-40). For (His)6-tagged proteins, cell lysates were loaded onto a Ni-NTA column (GE Healthcare Life Sciences) followed by washing with five column volumes of 20 mM imidazole and subsequent elution with 250 mM imidazole. For GST-tagged proteins, cell lysates were loaded onto a GSTrap HP column (GE Healthcare Life Sciences) followed by washing with five column volumes of phosphate-buffered saline (PBS) and subsequent elution with 10 mM reduced glutathione. For Flag-tagged proteins, cell lysates were loaded onto a column containing ANTI-FLAG M2 agarose affinity gel followed by washing with five column volumes of phosphate-buffered saline (PBS) and subsequent elution with 100 μg/ml 3 × Flag peptide. The proteins in 10-kDa spin columns were desalted via washing twice with ice-cold PBS. The proteins were then loaded onto a HiPrep 16/60 Sephacryl S-200 HR gel filtration column (GE Healthcare Life Sciences) to remove contaminated proteins. The purification efficiency was examined using SDS-PAGE and colloidal Coomassie Brilliant Blue (G-250) staining, with superior sensitivity (as low as 1 ng of protein per band) (Dyballa and Metzger, 2009).
Immunoprecipitation and immunoblot analysis
Extraction of proteins from cultured cells was performed with a lysis buffer (50 mM Tris-HCl [pH 7.5], 0.1% SDS, 1% Triton X-100, 150 mM NaCl, 1 mM dithiothreitol, 0.5 mM EDTA, 100 M PMSF, 100 M leupeptin, 1 M aprotinin, 100 M sodium orthovanadate, 100 M sodium pyrophosphate, and 1 mM sodium fluoride). Cell extracts were clarified by centrifugation at 13,400 g, and the supernatants (2 mg protein/ml) were subjected to immunoprecipitation with the indicated antibodies. After overnight incubation at 4°C, protein A or G agarose beads were added and left for an additional 3 h. Immunocomplexes were washed with lysis buffer 3 times and then subjected to immunoblot analyses with corresponding antibodies as described previously (Lu et al., 1998). The band intensity was quantified using the Image Lab software program (Bio-Rad).
Transfection
Cells were plated at a density of 4 × 10⁵ per 60-mm diameter dish 18 h prior to transfection. Transfection was performed using HyFect transfection reagent (Denville Scientific, NJ) according to the manufacturer’s instructions (Xia et al., 2007).
Reverse transcriptase-PCR
Total RNA was extracted from cultured tumor cells using TRIzol reagent (Invitrogen) according to the manufacturer’s instructions. Total RNA (1 μg) was used for each sample in a 20-μl reaction using an iScript cDNA synthesis kit (Bio-Rad). One microliter of the cDNA library was used in a 25-μl PCR. Fast SYBR Green Master Mix (Bio-Rad) was used to determine the threshold cycle (Ct) value of each sample using a CFX96 real-time PCR detection system (Bio-Rad). β-actin served as the normalization gene in these studies. The relative expression levels for the target genes were given by 2ΔCt (the Ct of β-actin minus the Ct of the target gene). Primer sequences used for PCR were list in Table S4.
Mass spectrometric analysis
A protein band visualized via Coomassie Brilliant Blue staining was excised from SDS-PAGE and digested in gel in 50 mM ammonium bicarbonate buffer containing RapiGest (Waters Corporation) overnight at 37 °C with 200 ng of modified sequencing-grade trypsin (Promega). The digested samples were analyzed using high-sensitivity liquid chromatography tandem mass spectrometry with an Orbitrap Elite mass spectrometer (Thermo Fisher Scientific). Proteins were identified by searching the fragment spectra against the Swiss-Prot protein database (EBI) using the Mascot search engine (version 2.3; Matrix Science) with the Proteome Discoverer software program (version 1.4; Thermo Fisher Scientific).
GST pull-down assay
Equal amount of His-tagged purified protein (200 ng/sample) were incubated with 100 ng of GST fusion proteins together with glutathione agarose beads in a modified binding buffer (50 mM Tris-HCl [pH 7.5], 1% Triton X-100, 150 mM NaCl, 1 mM dithiothreitol, 0.5 mM EDTA, 100 M PMSF, 100 M leupeptin, 1 M aprotinin, 100 M sodium orthovanadate, 100 M sodium pyrophosphate, and 1 mM sodium fluoride) at 4°C. The glutathione beads were then washed four times with binding buffer and the bound proteins were boiled with 4 × Laemmli buffer prior to electrophoresis on SDS-polyacrylamide gels.
Cell viability analysis
2 × 10⁵ cells were plated in DMEM with 10% bovine calf serum with or without glucose deprivation. The viable cells were counted using trypan blue (0.5%) staining 24 h after seeding. The data were presented as the mean ± SD from three independent experiments.
DNA constructs and mutagenesis
PCR-amplified human ACSS1, ACSS2, ACSS3, importin α5, importin α1, importin α4, importin α3, importin α6, importin α7, TFEB, TFEC, TFE3, and MITF were subcloned into a pCold I, pGEX-4T-1, or pcDNA 3.1 vector. PX458-HF plasmid containing a high-fidelity Streptococcus pyogenes Cas9 bearing mutations of N497/R661/Q695/Q926A(Kleinstiver et al., 2016), pcDNA3.1 Flag-ACSS2 S659A, pcDNA3.1 Flag-ACSS2 R664/665A, pcDNA3.1 Flag-TFEB R245/248A, pCold I ACSS2 S659A, pCold I ACSS2 R664/665A, and pCold I ACSS2 T363K were constructed using a QuikChange site-directed mutagenesis kit (Stratagene). PcDNA3.1 Flag-TFEB contained nonsense mutations of G959A, C960A, and A962G.
pGIPZ shRNA was constructed by ligation of oligonucleotide targeting human ACSS2, KPNA1, or TFEB into the Xho I/Mlu I digested pGIPZ vector and TRIPZ human ACSS2 inducible shRNA was purchased from GE Dharmacon (Lafayette, CO).
ChIP assay
ChIP was performed using a SimpleChIP plus Enzymatic Chromatin IP kit. Chromatin prepared from cells in a 10-cm dish was used to determine total DNA input and for overnight incubation with specific antibodies or normal mouse IgG. Primer sequences used for PCR were list in Table S5.
ChIP–seq analyses
Sequencing libraries were prepared using the NEBNext DNA Library Prep Master Mix Set according to the Illumina’s instructions. The libraries were single-end sequenced on an Illumina HiSeq 2000 (The University of Texas MD Anderson Cancer Center). Sequencing reads were aligned to hs37d5 reference genome using BWA v0.7.12 followed by duplicate reads removal using sambamba v0.6.5 (Tarasov et al., 2015). MACS2′s callpeak function was used with default parameters to call peaks from alignment results (Zhang et al., 2008). To annotate the peaks called by MACS2, the annotatePeaks.pl function of HOMER v4.8.3 was used with GENCODE19 reference gene annotation (Harrow et al., 2012). We then filtered the annotated peaks using the following criteria: each peak must have the “promoter-TSS” annotation, be within the canonical chromosomes as well as having a peak-score ≥ 2. The remaining peaks were further filtered according to desired distance from TSS.
In order to search for motifs present in the surrounding region of the peaks, we used the findMotifsGenome.pl program of HOMER to search for five motifs using the -S 5 option and constrained the search region to be +/−50bp of a peak position using the -size 50 option.
Total annotated, lysosomal, and autophagosomal gene sets, extracted from ENSEMBL GRCh37 (n=63,737), hLGDB database (http://lysosome.unipg.it [n=443]) and HADb database (http://autophagy.lu [n=223]), were used to determine whether the lysosome and autophagy pathways in the ACSS2- or TFEB-binding regions of the genes were significantly enriched via hypergeometric test (Brozzi et al., 2013; Cunningham et al., 2015; Moussay et al., 2011). The hypergeometric test was performed by using the R statistical program. Pearson correlation coefficient was calculated using R for the peaks scores corresponding to the union of the filtered binding sites found in ACSS2 and TFEB ChIP-seqs. Permutation test was performed 12 million times to determine the significance of the correlation. Heatmaps were plotted using bamCoverage, computeMatrix and plotHeatmap tools from the deepTools software suite (Ramirez et al., 2016).
Immunofluorescent analysis
Cells were fixed and incubated with primary antibodies at a dilution of 1:100, fluorescence dye-conjugated secondary antibodies, and DAPI, according to standard protocols. Cells were examined using a deconvolutional microscope (Zeiss, Thornwood, NY) with a 40 × oil immersion objective. Axio Vision 4 software from Zeiss was used to deconvolve Z-series images. AxioVision 4 module co-localization (Zeiss, Thornwood, NY) was used for the co-localization analysis of deconvoluted images (Fang et al., 2007).
Autophagy analyses
Total numbers of LC3B or GFP-LC3B puncta per cell were quantified from confocal images using ImageJ and the Analyse Particles Plugin (a constant threshold for all of the images within each experiment was applied). Twenty cells per condition were used for quantification.
Cell permeabilization
GBM cells (3 × 10⁶) were seeded onto 10-cm dishes. Cell permeabilization then was performed as described previously (Salabei et al., 2014). Briefly, cells were washed with 3× PBS and then incubated in 30 μg/ml digitonin/PBS for 5 min followed by treatment with DMEM containing indicated concentrations of acetyl-CoA.
Subcellular fractionation
Cells at 60% confluence in 60-mm well dishes were treated with or without glucose starvation or 2-DG for indicated times. Nuclear and cytosolic fractions were isolated from the cells using a nuclei/cytosol fractionation kit (BioVision). Nuclear and cytosolic proteins were used in immunoblot analyses.
Measurement of nuclear acetyl-CoA concentrations
Isolation of nuclei was performed using Nuclei PURE Prep kit. Briefly, adherent cells (3 × 10⁶) washed with PBS were scraped from the dishes in the presence of lysis buffer. Cells suspended in lysis buffer were placed on top of a 1.8 M sucrose gradient and then centrifuged at 30,000 × g for 45 min in a precooled swinging bucket ultracentrifuge. Nuclei at the bottom of the centrifuge were collected and washed with the nucleus storage buffer provided in Nuclei PURE Prep kit. Purity of nuclei was assessed by immunoblot, and the acetyl-CoA concentrations in the isolated nuclei were immediately measured using an acetyl-CoA fluorometric assay kit.
Histone acid extraction
Cells (3 × 10⁶) suspended in 10 ml of medium were seeded in 10-cm dishes and treated with or without glucose deprivation. Cells were harvested and lysed in Triton Extraction Buffer (PBS containing 0.5% Triton X-100 [v/v], 2 mM PMSF, 0.02% NaN3 [w/v]). The pellet was collected using a centrifuge and washed twice with Triton Extraction Buffer, and 200 μl of 0.2 N HCl was used to extract the histones overnight at 4 °C. Acid-extracted histones were used in Coomassie Brilliant Blue staining or immunoblot analysis.
Lentiviral infections and luciferase assays
To construct a CLEAR sequence-containing lentiviral reporter vector, an oligonucleotide containing four tandem copies of the CLEAR sequence were inserted into pGreenFire1 lentivector (System Biosciences, CA) containing an EF1-Puro selection cassette by digestion of pGreenFire1 with EcoRI and SpeI restriction enzymes. Lentiviruses were produced by cotransfecting 293FT cells with pGreenFire1-CLEAR and three packaging plasmids (pLP1, pLP2, and pLP/VSVG). Lentiviruses were harvested 72 h after transfection, centrifuged to remove cell debris, and filtered through 0.45 μm membrane (Millipore, Bedford, MA). To avoid multiple genomic integrations of the target gene, a total of 6 × 10⁵ cells seeded in a 6-well plate were infected by 6 × 10⁵ infectious units of lentiviruses (multiplicity of infection [MOI] = 1). The cell pools stably expressing luciferase under promoter of 4×CLEAR-SV40 were generated by treating lentivirus-infected cells with puromycin (5 μg/ml) for 7 days. To determine the ability of the nuclear ACSS2 to promote transcription, the cells were treated with or without glucose starvation, and luciferase assays were performed using a Luciferase Assay System (Promega). Luciferase activities were normalized to the cell number obtained from the duplicated samples.
Electron microscopy
Samples were fixed with a solution containing 3% glutaraldehyde plus 2% paraformaldehyde in 0.1 M cacodylate buffer, pH 7.3, and then washed in 0.1 M sodium cacodylate buffer and treated with 0.1% Millipore-filtered cacodylate-buffered tannic acid, postfixed with 1% buffered osmium tetroxide for 30 min, and stained en bloc with 1% Millipore-filtered uranyl acetate. The samples were dehydrated in increasing concentrations of ethanol, infiltrated, and embedded in LX-112 medium. The samples then were polymerized in a 60 °C oven for approximately 3 days. Ultrathin sections of the samples were cut using an Ultracut microtome (Leica), stained with uranyl acetate and lead citrate in an EM Stainer (Leica), and examined under a JEM-1010 transmission electron microscope (JEOL) at an accelerating voltage of 80 kV. Digital images were obtained using an AMT Imaging System (Advanced Microscopy Techniques).
Genomic editing
Genomic mutations in U87 and U251 cells were created using the CRISPR/Cas9 system as described previously (Sander and Joung, 2014). Single guide RNAs (sgRNAs) were designed to target the genomic areas adjacent to human ACSS2 mutation sites. Annealed guide oligos containing overhangs were inserted into the high-fidelity PX458-HF vector digested with the BbsI restriction enzyme. In a 24-well plate, U87 and U251 cells at 60% confluence were co-transfected with a single-stranded donor oligonucleotide (20 pmoles) used as a template to introduce the mutations and a vector (0.5 g) able to co-express an sgRNA targeting the ACSS2 gene and WT hSpCas9 tagged with green fluorescent protein. Twenty-four hours after transfection, cells were trypsinized and diluted in a medium for single-cell seeding into a 96-well plate, and green fluorescent protein-positive cells were marked and subjected to genomic DNA extraction. Genotyping was performed by sequencing PCR products amplified from primers spanning the mutation area. Primer sequences used for PCR were list in Table S6.
Measurement of ACSS2 activity
ACSS2 converts ATP, acetate, and CoA into AMP, pyrophosphate, and acetyl-CoA. The generation of pyrophosphate was measured using a coupled enzymatic assay. The reaction mixture contained pyrophosphatase, which converts pyrophosphate to phosphate, and purine nucleoside phosphorylase, which converts nucleoside analog (MESG) to a compound that absorbs light at 360 nm in the presence of phosphate. A typical 100-μl reaction mixture in a 96-well plate includes 50 M CoA, 100 μM ATP, 5 mM sodium acetate, 0.2 mM MESG, 0.2% bovine serum albumin, 20 nM ACSS2, 0.4 M purine nucleoside phosphorylase, 1 U/ml yeast pyrophosphatase, 1 mM MgCl2, 150 mM NaCl, and 50 mM HEPES (pH 7.5). The increasing absorbance was read at 360 nm in a kinetic mode for 1 h using a microplate reader (BMG LABTECH).
Quantification and statistical analysis
All data represent the mean ± SD of at least three independent experiments. Sample number (n) indicates the number of independent biological samples in each experiment. Sample numbers and experimental repeats are indicated in figure legends. Pair-wise comparisons were performed using a two-tailed Student T-test unless specifically indicated. P values less than 0.05 were considered significant. Analyses were performed using the Microsoft Excel.
KEY RESOURCES TABLE
| REAGENT or RESOURCE | SOURCE | IDENTIFIER |
|---|---|---|
| Antibodies | ||
| Rabbit polyclonal antibody anti-ACSS2 pS659 | Jiaxing Xinda Biological Technology | N/A |
| Rabbit polyclonal antibody anti-ACSS2 | GeneTex | Cat#GTX30020; RRID: N/A |
| Rabbit polyclonal antibody anti-ACL | GeneTex | Cat#GTX112387; RRID:AB_111678 14 |
| Rabbit polyclonal antibody anti-importin α5 | GeneTex | Cat#GTX112284; RRID:AB_203732 1 |
| Rabbit polyclonal antibody anti-AMPKα | Cell Signaling Technology | Cat#5831; RRID: AB_10622186 |
| Rabbit polyclonal antibody anti-AMPKα pT172 | Cell Signaling Technology | Cat#2535; RRID: AB_331250 |
| Rabbit polyclonal antibody anti-ATG3 | Cell Signaling Technology | Cat#3415; RRID: AB_2059244 |
| Rabbit polyclonal antibody anti-ACC | Cell Signaling Technology | Cat#3676; RRID: AB_2219397 |
| Rabbit polyclonal antibody anti-ACC pS79 | Cell Signaling Technology | Cat#11818; RRID: N/A |
| Rabbit polyclonal antibody anti-acetyl-histone H3 | EMD Millipore | Cat#06-599; RRID:AB_211528 3 |
| Rabbit polyclonal antibody anti-acetyl-histone H4 | EMD Millipore | Cat#06-866; RRID:AB_310270 |
| Rabbit polyclonal antibody anti-acetyl-histone H2B | EMD Millipore | Cat#07-373; RRID:AB_211814 4 |
| Rabbit polyclonal antibody anti-Ki67 | EMD Millipore | Cat#AB9260; RRID:AB_214236 6 |
| Mouse monoclonal antibody anti-PCNA | BD Transduction Laboratories | Cat#610665; RRID:AB_397992 |
| Rabbit polyclonal antibody anti-H3R17me2 | Abcam | Cat#ab8284; RRID:AB_306434 |
| Rabbit polyclonal antibody anti-acetyl-H3K9 | Abcam | Cat#ab4441; RRID:AB_211829 2 |
| Rabbit polyclonal antibody anti-LC3B | Abcam | Cat#ab51520; RRID:AB_881429 |
| Rabbit polyclonal antibody anti-LAMP1 | Abcam | Cat#ab24170; RRID:AB_775978 |
| Mouse monoclonal antibody anti-GST | Santa Cruz Biotechnology | Cat#sc-138; RRID:AB_627677 |
| Mouse monoclonal antibody anti-tubulin | Santa Cruz Biotechnology | Cat#sc-5286; RRID:AB_628411 |
| Mouse monoclonal antibody anti-β-glucosidase | Santa Cruz Biotechnology | Cat#sc-365745; RRID:AB_108468 51 |
| Mouse monoclonal antibody anti-β-glucuronidase | Santa Cruz Biotechnology | Cat#sc-374629; RRID:AB_109890 45 |
| Mouse monoclonal antibody anti-WIPI-1 | Santa Cruz Biotechnology | Cat#sc-376205; RRID:AB_109892 62 |
| Mouse monoclonal antibody anti-TFEB | Santa Cruz Biotechnology | Cat#sc-166736; RRID:AB_225594 3 |
| Mouse monoclonal antibody anti-IPO 8 | Santa Cruz Biotechnology | Cat#sc-398854; RRID: N/A |
| Mouse monoclonal antibody anti-PDHA1 | Santa Cruz Biotechnology | Cat#sc-377092; RRID: N/A |
| Mouse monoclonal antibody anti-Flag | Sigma | Cat#F3165; RRID:AB_259529 |
| Rabbit polyclonal antibody anti-cathepsin A | Thermo Fisher Scientific | Cat#PA5-56629; RRID:AB_263931 2 |
| Bacterial and Virus Strains | ||
| BL21(DE3) | EMD Millipore | Cat#71401-3 |
| TOP10 | Thermo Fisher Scientific | Cat#C404010 |
| Biological Samples | ||
| Human GBM specimens | Capital Medical University and The University of Texas MD Anderson Cancer Center | N/A |
| Chemicals, Peptides, and Recombinant Proteins | ||
| DAPI | Sigma-Aldrich | Cat#D9542; CAS: 28718-90-3 |
| 2-Deoxy-D-glucose (2-DG) | Sigma-Aldrich | Cat#D6134; CAS: 154-17-6 |
| Sorbitol | Sigma-Aldrich | Cat#85529; CAS: 50-70-4 |
| Doxycycline | Sigma-Aldrich | D9891; CAS: 24390-14-5 |
| Adenosine 5′-monophosphate (AMP) | Sigma-Aldrich | Cat#A2252; CAS: 18422-05-4 |
| Metformin | Sigma-Aldrich | Cat#PHR1084; CAS: 1115-70-4 |
| Digitonin | Sigma-Aldrich | Cat#D141; CAS: 11024-24-1 |
| Trichostatin A (TSA) | Sigma-Aldrich | Cat#T8552; CAS: 58880-19-6 |
| Phenylmethylsulfonyl fluoride (PMSF) | Sigma-Aldrich | Cat#52332; CAS: 329-98-6 |
| CoA | Sigma-Aldrich | Cat#C4282; CAS: 85-61-0 |
| ATP | Sigma-Aldrich | Cat#A7699; CAS: 34369-07-8 |
| Sodium acetate | Sigma-Aldrich | Cat#S2889; CAS: 127-09-3 |
| Purine nucleoside phosphorylase (PNP) | Sigma-Aldrich | Cat#40809; CAS: 9030-21-1 |
| Yeast pyrophosphatase | Sigma-Aldrich | Cat#I1891; CAS: 9024-82-2 |
| Nucleoside analog MESG | Setareh Biotech | Cat#6764; CAS: 55727-10-1 |
| Chloroquine | Cell Signaling Technology | Cat #14774; CAS: 50-63-5 |
| Active AMPK | SignalChem | Cat#P47-10H |
| Active CAMKKβ | SignalChem | Cat#C18-10G |
| HyFect transfection reagents | Denville Scientific | Cat#E2600 (1001359) |
| [γ-32P]-ATP | MP Biomedicals | Cat#0135001 |
| A769662 | Santa Cruz Biotechnology | Cat#sc-203790; CAS 844499-71-4 |
| Compound C | EMD Millipore | Cat#171260; CAS: 866405-64-3 |
| Human IPO8 siRNA | Santa Cruz Biotechnology | Cat#sc-75336 |
| Control siRNA | Santa Cruz Biotechnology | Cat#sc-37007 |
| ANTI-FLAG M2 agarose affinity gel | Sigma-Aldrich | Cat#A2220 |
| 3 × Flag peptide | Sigma-Aldrich | #F4799 |
| Fast SYBR Green Master Mix | Bio-Rad | Cat#1708884 |
| TRIzol | Invitrogen | Cat#15596026 |
| Critical Commercial Assays | ||
| SimpleChIP plus Enzymatic Chromatin IP kit | Cell Signaling Technology | Cat#9005 |
| Nuclei/cytosol fractionation kit | BioVision | Cat#K266 |
| Nuclei PURE Prep kit | Sigma-Aldrich | Cat#NUC201 |
| Acetyl-CoA fluorometric assay kit | BioVision | Cat#K317 |
| Deposited Data | ||
| Human reference genome NCBI build 37, GRCh37 | Genome Reference Consortium | http://www.ncbi.nlm.nih.gov/projects/genome/assembly/grc/human/ |
| hLGDB database | University of Perugia, Dept. of Experimental Medicine and Biochemical Sciences | http://lysosome.unipg.it |
| HADb database | The Laboratory of Experimental Hemato-Oncology headed by Dr Guy Berchem | http://autophagy.lu |
| Swiss-Prot protein database | SIB Swiss Institute of Bioinformatics | http://web.expasy.org/docs/ |
| Experimental Models: Cell Lines | ||
| Human: U87 cells | ATCC | HTB-14 |
| Human: U251 cells | Sigma-Aldrich | 09063001 |
| Mouse: AMPKα1/AMPKα2 double-knockout embryonic fibroblasts | Laboratory of B. Viollet, Institut Cochin, Paris, France | N/A |
| Human: H1299 cells | ATCC | CRL-5803 |
| Human: PANC-1 cells | ATCC | CRL-1469 |
| Experimental Models: Organisms/Strains | ||
| Mouse: BALB/c nude | The University of Texas MD Anderson Cancer Center | N/A |
| Oligonucleotides | ||
| shRNA targeting sequence: Control: GCUUCUAACACCGGAGGUCUU | This paper | N/A |
| shRNA targeting sequence: ACSS2: GCUUCUUUGAAGGAGUAAAUG | This paper | N/A |
| shRNA targeting sequence: KPNA1: GGCCUUUGAUCUUAUUGAGCA | This paper | N/A |
| shRNA targeting sequence: TFEB: AGAAGCGAGAGCUCACAGA | This paper | N/A |
| shRNA targeting sequence: ACSS2 (TRIPZ inducible shRNA): UCUCUAAUCUGCUUCUUGA | GE Dharmacon | Cat#V3THS_3667 20 |
| CLEAR sequence: GTCACGTGACGAAGTCACGTGACGAAGTCACGTGACGAAGTCACGTGACGAA | This paper | N/A |
| Primers used for quantitative PCR, see Table S4 | This paper | N/A |
| Primers used for ChIP assay, see Table S5 | This paper | N/A |
| Primers used for genotyping the mutations of ACSS2, see Table S6 | This paper | N/A |
| sgRNA targeting sequence: ACSS2 S659: GGCCTCTGAACATACCTGAG | This paper | N/A |
| sgRNA targeting sequence: ACSS2 R664/665A: AAATCATGAGGCGAGTGCTT | This paper | N/A |
| sgRNA targeting sequence: ACSS2 T363K: GCAGACATTGGTTGGATCAC | This paper | N/A |
| Single-stranded donor oligonucleotide (ssODN) sequence: ACSS2 S659: CAAAGGCTTTCATCCACGCACACCCCACCACCACCAGGCCTCAGCCCATCCCAATCCATGGAGGCCTCTGAACATACCTGCGCGCGTTTTAGGCAAGCCAGGTGCATTCTGGATGTAGTCTGGTGTGGCAATGGGGCCAATCTTTTCTCTAACTGTAACCAAC | This paper | N/A |
| Single-stranded donor oligonucleotide (ssODN) sequence: ACSS2 R664/665A: GAAAGCCTTTGGCAGGGCTAGGGTGGGTCAGTGCTTTCACCAAGTAACTAGAGGTCTGTGGTTCCCCAGGGAAAATCATGGCGGCAGTGCTTCGAAAGATTGCTCAGAATGACCATGACCTCGGGGACATGTCTACTGTGGCTGACCCATCTGTCATCAGTCACC | This paper | N/A |
| Single-stranded donor oligonucleotide (ssODN) sequence: ACSS2 T363K: CAACCTTCAAGTATGTGTTTGACTTCCATGCAGAGGATGTGTTCTGGTGCACGGCAGACATTGGTTGGATAAAGGGTCATTCCTACGTCACCTATGGGCCACTGGCCAATGGTGCCACCAGTGTTTTGGTGAGAAGGGAG | This paper | N/A |
| Recombinant DNA | ||
| Plasmid: PX458 | Ran FA et al., 2013 | Addgene Plasmid #48138 |
| Plasmid: pcDNA3.1-(HA)2-TFE3 | Perera RM et al., 2015 | N/A |
| Plasmid: pEGFP-C1-MITF | Perera RM et al., 2015 | N/A |
| Plasmid: pEYFP-N1-TFEC | Nezich CL et al., 2015 | N/A |
| Plasmid: GFP-LC3B | This paper | N/A |
| Plasmid: pCold I-ACSS2 | This paper | N/A |
| Plasmid: pCold I-ACSS2 S659A | This paper | N/A |
| Plasmid: pCold I-ACSS2 R664/665A | This paper | N/A |
| Plasmid: pCold I-ACSS2 T363K | This paper | N/A |
| Plasmid: pCold I-TFEB | This paper | N/A |
| Plasmid: pGEX-4T-1- importin α5 | This paper | N/A |
| Plasmid: pcDNA 3.1-Flag-ACSS1 | This paper | N/A |
| Plasmid: pcDNA 3.1-Flag-ACSS2 | This paper | N/A |
| Plasmid: pcDNA 3.1-Flag-ACSS3 | This paper | N/A |
| Plasmid: pcDNA 3.1-Flag-ACSS2 S659A | This paper | N/A |
| Plasmid: pcDNA 3.1-Flag-ACSS2 R664/665A | This paper | N/A |
| Plasmid: pcDNA 3.1-Flag-ACSS2 S659D | This paper | N/A |
| Plasmid: pcDNA 3.1-NLS-Flag-ACSS2 S659A | This paper | N/A |
| Plasmid: pcDNA 3.1-Flag-TFEB | This paper | N/A |
| Plasmid: pcDNA 3.1-Flag-TFEB R245/248A | This paper | N/A |
| Plasmid: pcDNA 3.1-Flag-TFEC | This paper | N/A |
| Plasmid: pcDNA 3.1-Flag-TFE3 | This paper | N/A |
| Plasmid: pcDNA 3.1-Flag-MITF | This paper | N/A |
| Plasmid: pcDNA6-SFB-importin α5 | This paper | N/A |
| Plasmid: pcDNA6-SFB-importin α1 | This paper | N/A |
| Plasmid: pcDNA6-SFB-importin α3 | This paper | N/A |
| Plasmid: pcDNA6-SFB-importin α4 | This paper | N/A |
| Plasmid: pcDNA6-SFB-importin α6 | This paper | N/A |
| Plasmid: pcDNA6-SFB-importin α7 | This paper | N/A |
| Plasmid: PX458-HF (N497/R661/Q695/Q926A) | This paper | N/A |
| Plasmid: PX458-HF-ACSS2 S659A | This paper | N/A |
| Plasmid: PX458-HF-ACSS2 R664/665A | This paper | N/A |
| Plasmid: PX458-HF-ACSS2 T363K | This paper | N/A |
| Plasmid: pGIPZ ACSS2 shRNA | This paper | N/A |
| Plasmid: pGIPZ TFEB shRNA | This paper | N/A |
| Plasmid: pGIPZ KPNA1 shRNA | This paper | N/A |
| Plasmid: TRIPZ inducible ACSS2 shRNA | This paper | N/A |
| Plasmid: pcDNA 3.1-Flag-AMPKα2 | This paper | N/A |
| Plasmid: pcDNA 3.1-Flag-AMPKα2 T172A | This paper | N/A |
| Plasmid: pGreenFire1-CLEAR | This paper | N/A |
| Software and Algorithms | ||
| BWA v0.7.12 | Tarasov et al., 2015 | http://www.open-bio.org/wiki/Sambamba |
| MACS2 | Zhang et al., 2008 | http://liulab.dfci.ha rvard.edu/MACS/ |
| HOMER v4.8.3 | Harrow et al., 2012 | http://www.gencod egenes.org/ |
| R statistical program | This paper | http://www.R-project.org/ |
| DeepTools software suite | Ramirez et al., 2016 | deeptools.ie-freiburg.mpg.de |
| Proteome Discoverer software program | Thermo Fisher Scientific | https://www.thermofisher.com/order/catalog/product/IQLAAEGABSFAKJMAUH |
| Other | ||
| N/A | N/A | N/A |
Supplementary Material
Table S1. Interactome of ACSS2 in U87 cells with or without glucose deprivation for 1 h. Related to Figure 3.
Table S2. Filtered gene list of ACSS2 ChIP peaks. Related to Figure 3.
Table S3. Filtered gene list of TFEB ChIP peaks. Related to Figure 3.
Table S4. Primers used for quantitative PCR. Related to the STAR Methods.
Table S5. Primers used for ChIP assay. Related to the STAR Methods.
Table S6. Primers used for genotyping the mutations of ACSS2. Related to the STAR Methods.
Acknowledgments
We thank Kenneth Dunner and Alicia Ledoux for technical support and Don Norwood for critical reading of this manuscript. This work was supported by National Cancer Institute grants 2R01 CA109035, 1R0 CA169603, and 1R01 CA204996 (Z.L.), National Institute of Neurological Disorders and Stroke grant 1R01 NS089754 (Z.L.), the National Institutes of Health/National Cancer Institute MD Anderson Support Grant (P30CA016672), the National Natural Science Foundation of China (No. 81672872 and No. 81472386 to C.Q.). Z.L. is a Ruby E. Rutherford Distinguished Professor.
Footnotes
Publisher's Disclaimer: This is a PDF file of an unedited manuscript that has been accepted for publication. As a service to our customers we are providing this early version of the manuscript. The manuscript will undergo copyediting, typesetting, and review of the resulting proof before it is published in its final citable form. Please note that during the production process errors may be discovered which could affect the content, and all legal disclaimers that apply to the journal pertain.
AUTHOR CONTRIBUTIONS
Z.L. and X.L. conceived and designed the study and wrote the manuscript with comments from all authors. X.L., W.Y., X.Q., Y.Z., and Y.X. performed experiments. W.L, J.L., G.R, C.Q., S.R., and T.J. provided reagents and technical assistance.
References
- Brozzi A, Urbanelli L, Germain PL, Magini A, Emiliani C. hLGDB: a database of human lysosomal genes and their regulation. Database (Oxford) 2013;2013:bat024. doi: 10.1093/database/bat024. [DOI] [PMC free article] [PubMed] [Google Scholar]
- Bungard D, Fuerth BJ, Zeng PY, Faubert B, Maas NL, Viollet B, Carling D, Thompson CB, Jones RG, Berger SL. Signaling kinase AMPK activates stress-promoted transcription via histone H2B phosphorylation. Science. 2010;329:1201–1205. doi: 10.1126/science.1191241. [DOI] [PMC free article] [PubMed] [Google Scholar]
- Cai L, Sutter BM, Li B, Tu BP. Acetyl-CoA induces cell growth and proliferation by promoting the acetylation of histones at growth genes. Mol Cell. 2011;42:426–437. doi: 10.1016/j.molcel.2011.05.004. [DOI] [PMC free article] [PubMed] [Google Scholar]
- Comerford SA, Huang Z, Du X, Wang Y, Cai L, Witkiewicz AK, Walters H, Tantawy MN, Fu A, Manning HC, et al. Acetate dependence of tumors. Cell. 2014;159:1591–1602. doi: 10.1016/j.cell.2014.11.020. [DOI] [PMC free article] [PubMed] [Google Scholar]
- Cunningham F, Amode MR, Barrell D, Beal K, Billis K, Brent S, Carvalho-Silva D, Clapham P, Coates G, Fitzgerald S, et al. Ensembl 2015. Nucleic Acids Res. 2015;43:D662–669. doi: 10.1093/nar/gku1010. [DOI] [PMC free article] [PubMed] [Google Scholar]
- Dyballa N, Metzger S. Fast and sensitive colloidal coomassie G-250 staining for proteins in polyacrylamide gels. J Vis Exp. 2009 doi: 10.3791/1431. [DOI] [PMC free article] [PubMed] [Google Scholar]
- Fang D, Hawke D, Zheng Y, Xia Y, Meisenhelder J, Nika H, Mills GB, Kobayashi R, Hunter T, Lu Z. Phosphorylation of beta-catenin by AKT promotes beta-catenin transcriptional activity. J Biol Chem. 2007;282:11221–11229. doi: 10.1074/jbc.M611871200. [DOI] [PMC free article] [PubMed] [Google Scholar]
- Fujino T, Kondo J, Ishikawa M, Morikawa K, Yamamoto TT. Acetyl-CoA synthetase 2, a mitochondrial matrix enzyme involved in the oxidation of acetate. J Biol Chem. 2001;276:11420–11426. doi: 10.1074/jbc.M008782200. [DOI] [PubMed] [Google Scholar]
- Furnari FB, Fenton T, Bachoo RM, Mukasa A, Stommel JM, Stegh A, Hahn WC, Ligon KL, Louis DN, Brennan C, et al. Malignant astrocytic glioma: genetics, biology, and paths to treatment. Genes Dev. 2007;21:2683–2710. doi: 10.1101/gad.1596707. [DOI] [PubMed] [Google Scholar]
- Gao X, Lin SH, Ren F, Li JT, Chen JJ, Yao CB, Yang HB, Jiang SX, Yan GQ, Wang D, et al. Acetate functions as an epigenetic metabolite to promote lipid synthesis under hypoxia. Nat Commun. 2016;7:11960. doi: 10.1038/ncomms11960. [DOI] [PMC free article] [PubMed] [Google Scholar]
- Harrow J, Frankish A, Gonzalez JM, Tapanari E, Diekhans M, Kokocinski F, Aken BL, Barrell D, Zadissa A, Searle S, et al. GENCODE: the reference human genome annotation for The ENCODE Project. Genome Res. 2012;22:1760–1774. doi: 10.1101/gr.135350.111. [DOI] [PMC free article] [PubMed] [Google Scholar]
- Ingram-Smith C, Woods BI, Smith KS. Characterization of the acyl substrate binding pocket of acetyl-CoA synthetase. Biochemistry. 2006;45:11482–11490. doi: 10.1021/bi061023e. [DOI] [PubMed] [Google Scholar]
- Jeon SM, Chandel NS, Hay N. AMPK regulates NADPH homeostasis to promote tumour cell survival during energy stress. Nature. 2012;485:661–665. doi: 10.1038/nature11066. [DOI] [PMC free article] [PubMed] [Google Scholar]
- Ji H, Wang J, Nika H, Hawke D, Keezer S, Ge Q, Fang B, Fang X, Fang D, Litchfield DW, et al. EGF-induced ERK activation promotes CK2-mediated disassociation of alpha-Catenin from beta-Catenin and transactivation of beta-Catenin. Mol Cell. 2009;36:547–559. doi: 10.1016/j.molcel.2009.09.034. [DOI] [PMC free article] [PubMed] [Google Scholar]
- Jones RG, Thompson CB. Tumor suppressors and cell metabolism: a recipe for cancer growth. Genes Dev. 2009;23:537–548. doi: 10.1101/gad.1756509. [DOI] [PMC free article] [PubMed] [Google Scholar]
- Kleinstiver BP, Pattanayak V, Prew MS, Tsai SQ, Nguyen NT, Zheng Z, Joung JK. High-fidelity CRISPR-Cas9 nucleases with no detectable genome-wide off-target effects. Nature. 2016;529:490–495. doi: 10.1038/nature16526. [DOI] [PMC free article] [PubMed] [Google Scholar]
- Kurdistani SK, Grunstein M. Histone acetylation and deacetylation in yeast. Nat Rev Mol Cell Biol. 2003;4:276–284. doi: 10.1038/nrm1075. [DOI] [PubMed] [Google Scholar]
- Levine B, Kroemer G. Autophagy in the pathogenesis of disease. Cell. 2008;132:27–42. doi: 10.1016/j.cell.2007.12.018. [DOI] [PMC free article] [PubMed] [Google Scholar]
- Li B, Carey M, Workman JL. The role of chromatin during transcription. Cell. 2007;128:707–719. doi: 10.1016/j.cell.2007.01.015. [DOI] [PubMed] [Google Scholar]
- Li X, Jiang Y, Meisenhelder J, Yang W, Hawke DH, Zheng Y, Xia Y, Aldape K, He J, Hunter T, et al. Mitochondria-Translocated PGK1 Functions as a Protein Kinase to Coordinate Glycolysis and the TCA Cycle in Tumorigenesis. Mol Cell. 2016;61:705–719. doi: 10.1016/j.molcel.2016.02.009. [DOI] [PMC free article] [PubMed] [Google Scholar]
- Lu Z, Liu D, Hornia A, Devonish W, Pagano M, Foster DA. Activation of protein kinase C triggers its ubiquitination and degradation. Mol Cell Biol. 1998;18:839–845. doi: 10.1128/mcb.18.2.839. [DOI] [PMC free article] [PubMed] [Google Scholar]
- Lyssiotis CA, Cantley LC. Acetate fuels the cancer engine. Cell. 2014;159:1492–1494. doi: 10.1016/j.cell.2014.12.009. [DOI] [PubMed] [Google Scholar]
- Mashimo T, Pichumani K, Vemireddy V, Hatanpaa KJ, Singh DK, Sirasanagandla S, Nannepaga S, Piccirillo SG, Kovacs Z, Foong C, et al. Acetate is a bioenergetic substrate for human glioblastoma and brain metastases. Cell. 2014;159:1603–1614. doi: 10.1016/j.cell.2014.11.025. [DOI] [PMC free article] [PubMed] [Google Scholar]
- Mizushima N, Levine B, Cuervo AM, Klionsky DJ. Autophagy fights disease through cellular self-digestion. Nature. 2008;451:1069–1075. doi: 10.1038/nature06639. [DOI] [PMC free article] [PubMed] [Google Scholar]
- Mo JS, Meng Z, Kim YC, Park HW, Hansen CG, Kim S, Lim DS, Guan KL. Cellular energy stress induces AMPK-mediated regulation of YAP and the Hippo pathway. Nat Cell Biol. 2015;17:500–510. doi: 10.1038/ncb3111. [DOI] [PMC free article] [PubMed] [Google Scholar]
- Moussay E, Kaoma T, Baginska J, Muller A, Van Moer K, Nicot N, Nazarov PV, Vallar L, Chouaib S, Berchem G, et al. The acquisition of resistance to TNFalpha in breast cancer cells is associated with constitutive activation of autophagy as revealed by a transcriptome analysis using a custom microarray. Autophagy. 2011;7:760–770. doi: 10.4161/auto.7.7.15454. [DOI] [PubMed] [Google Scholar]
- Nezich CL, Wang C, Fogel AI, Youle RJ. MiT/TFE transcription factors are activated during mitophagy downstream of Parkin and Atg5. The Journal of cell biology. 2015;210:435–450. doi: 10.1083/jcb.201501002. [DOI] [PMC free article] [PubMed] [Google Scholar]
- Oakhill JS, Chen ZP, Scott JW, Steel R, Castelli LA, Ling N, Macaulay SL, Kemp BE. beta-Subunit myristoylation is the gatekeeper for initiating metabolic stress sensing by AMP-activated protein kinase (AMPK) Proc Natl Acad Sci U S A. 2010;107:19237–19241. doi: 10.1073/pnas.1009705107. [DOI] [PMC free article] [PubMed] [Google Scholar]
- Perera RM, Stoykova S, Nicolay BN, Ross KN, Fitamant J, Boukhali M, Lengrand J, Deshpande V, Selig MK, Ferrone CR, et al. Transcriptional control of autophagy-lysosome function drives pancreatic cancer metabolism. Nature. 2015;524:361–365. doi: 10.1038/nature14587. [DOI] [PMC free article] [PubMed] [Google Scholar]
- Rabinowitz JD, White E. Autophagy and metabolism. Science. 2010;330:1344–1348. doi: 10.1126/science.1193497. [DOI] [PMC free article] [PubMed] [Google Scholar]
- Ramirez F, Ryan DP, Gruning B, Bhardwaj V, Kilpert F, Richter AS, Heyne S, Dundar F, Manke T. deepTools2: a next generation web server for deep-sequencing data analysis. Nucleic Acids Res. 2016;44:W160–165. doi: 10.1093/nar/gkw257. [DOI] [PMC free article] [PubMed] [Google Scholar]
- Ran FA, Hsu PD, Wright J, Agarwala V, Scott DA, Zhang F. Genome engineering using the CRISPR-Cas9 system. Nat Protoc. 2013;8:2281–2308. doi: 10.1038/nprot.2013.143. [DOI] [PMC free article] [PubMed] [Google Scholar]
- Roczniak-Ferguson A, Petit CS, Froehlich F, Qian S, Ky J, Angarola B, Walther TC, Ferguson SM. The transcription factor TFEB links mTORC1 signaling to transcriptional control of lysosome homeostasis. Sci Signal. 2012;5:ra42. doi: 10.1126/scisignal.2002790. [DOI] [PMC free article] [PubMed] [Google Scholar]
- Russell RC, Yuan HX, Guan KL. Autophagy regulation by nutrient signaling. Cell Res. 2014;24:42–57. doi: 10.1038/cr.2013.166. [DOI] [PMC free article] [PubMed] [Google Scholar]
- Salabei JK, Gibb AA, Hill BG. Comprehensive measurement of respiratory activity in permeabilized cells using extracellular flux analysis. Nat Protoc. 2014;9:421–438. doi: 10.1038/nprot.2014.018. [DOI] [PMC free article] [PubMed] [Google Scholar]
- Sander JD, Joung JK. CRISPR-Cas systems for editing, regulating and targeting genomes. Nat Biotechnol. 2014;32:347–355. doi: 10.1038/nbt.2842. [DOI] [PMC free article] [PubMed] [Google Scholar]
- Sardiello M, Palmieri M, di Ronza A, Medina DL, Valenza M, Gennarino VA, Di Malta C, Donaudy F, Embrione V, Polishchuk RS, et al. A gene network regulating lysosomal biogenesis and function. Science. 2009;325:473–477. doi: 10.1126/science.1174447. [DOI] [PubMed] [Google Scholar]
- Schug ZT, Peck B, Jones DT, Zhang Q, Grosskurth S, Alam IS, Goodwin LM, Smethurst E, Mason S, Blyth K, et al. Acetyl-CoA synthetase 2 promotes acetate utilization and maintains cancer cell growth under metabolic stress. Cancer Cell. 2015;27:57–71. doi: 10.1016/j.ccell.2014.12.002. [DOI] [PMC free article] [PubMed] [Google Scholar]
- Settembre C, Fraldi A, Medina DL, Ballabio A. Signals from the lysosome: a control centre for cellular clearance and energy metabolism. Nat Rev Mol Cell Biol. 2013;14:283–296. doi: 10.1038/nrm3565. [DOI] [PMC free article] [PubMed] [Google Scholar]
- Settembre C, Zoncu R, Medina DL, Vetrini F, Erdin S, Erdin S, Huynh T, Ferron M, Karsenty G, Vellard MC, et al. A lysosome-to-nucleus signalling mechanism senses and regulates the lysosome via mTOR and TFEB. EMBO J. 2012;31:1095–1108. doi: 10.1038/emboj.2012.32. [DOI] [PMC free article] [PubMed] [Google Scholar]
- Shackelford DB, Shaw RJ. The LKB1-AMPK pathway: metabolism and growth control in tumour suppression. Nat Rev Cancer. 2009;9:563–575. doi: 10.1038/nrc2676. [DOI] [PMC free article] [PubMed] [Google Scholar]
- Shin HJ, Kim H, Oh S, Lee JG, Kee M, Ko HJ, Kweon MN, Won KJ, Baek SH. AMPK-SKP2-CARM1 signalling cascade in transcriptional regulation of autophagy. Nature. 2016;534:553–557. doi: 10.1038/nature18014. [DOI] [PMC free article] [PubMed] [Google Scholar]
- Sutendra G, Kinnaird A, Dromparis P, Paulin R, Stenson TH, Haromy A, Hashimoto K, Zhang N, Flaim E, Michelakis ED. A nuclear pyruvate dehydrogenase complex is important for the generation of acetyl-CoA and histone acetylation. Cell. 2014;158:84–97. doi: 10.1016/j.cell.2014.04.046. [DOI] [PubMed] [Google Scholar]
- Takahashi H, McCaffery JM, Irizarry RA, Boeke JD. Nucleocytosolic acetyl-coenzyme a synthetase is required for histone acetylation and global transcription. Mol Cell. 2006;23:207–217. doi: 10.1016/j.molcel.2006.05.040. [DOI] [PubMed] [Google Scholar]
- Tarasov A, Vilella AJ, Cuppen E, Nijman IJ, Prins P. Sambamba: fast processing of NGS alignment formats. Bioinformatics. 2015;31:2032–2034. doi: 10.1093/bioinformatics/btv098. [DOI] [PMC free article] [PubMed] [Google Scholar]
- Watkins PA, Maiguel D, Jia Z, Pevsner J. Evidence for 26 distinct acyl-coenzyme A synthetase genes in the human genome. J Lipid Res. 2007;48:2736–2750. doi: 10.1194/jlr.M700378-JLR200. [DOI] [PubMed] [Google Scholar]
- Wellen KE, Hatzivassiliou G, Sachdeva UM, Bui TV, Cross JR, Thompson CB. ATP-citrate lyase links cellular metabolism to histone acetylation. Science. 2009;324:1076–1080. doi: 10.1126/science.1164097. [DOI] [PMC free article] [PubMed] [Google Scholar]
- Xia Y, Wang J, Liu TJ, Yung WK, Hunter T, Lu Z. c-Jun downregulation by HDAC3-dependent transcriptional repression promotes osmotic stress-induced cell apoptosis. Mol Cell. 2007;25:219–232. doi: 10.1016/j.molcel.2007.01.005. [DOI] [PMC free article] [PubMed] [Google Scholar]
- Yang W, Xia Y, Ji H, Zheng Y, Liang J, Huang W, Gao X, Aldape K, Lu Z. Nuclear PKM2 regulates beta-catenin transactivation upon EGFR activation. Nature. 2011;480:118–122. doi: 10.1038/nature10598. [DOI] [PMC free article] [PubMed] [Google Scholar]
- Yang W, Zheng Y, Xia Y, Ji H, Chen X, Guo F, Lyssiotis CA, Aldape K, Cantley LC, Lu Z. ERK1/2-dependent phosphorylation and nuclear translocation of PKM2 promotes the Warburg effect. Nat Cell Biol. 2012;14:1295–1304. doi: 10.1038/ncb2629. [DOI] [PMC free article] [PubMed] [Google Scholar]
- Young NP, Kamireddy A, Van Nostrand JL, Eichner LJ, Shokhirev MN, Dayn Y, Shaw RJ. AMPK governs lineage specification through Tfeb-dependent regulation of lysosomes. Genes Dev. 2016;30:535–552. doi: 10.1101/gad.274142.115. [DOI] [PMC free article] [PubMed] [Google Scholar]
- Zhang Y, Liu T, Meyer CA, Eeckhoute J, Johnson DS, Bernstein BE, Nusbaum C, Myers RM, Brown M, Li W, et al. Model-based analysis of ChIP-Seq (MACS) Genome Biol. 2008;9:R137. doi: 10.1186/gb-2008-9-9-r137. [DOI] [PMC free article] [PubMed] [Google Scholar]
Associated Data
This section collects any data citations, data availability statements, or supplementary materials included in this article.
Supplementary Materials
Table S1. Interactome of ACSS2 in U87 cells with or without glucose deprivation for 1 h. Related to Figure 3.
Table S2. Filtered gene list of ACSS2 ChIP peaks. Related to Figure 3.
Table S3. Filtered gene list of TFEB ChIP peaks. Related to Figure 3.
Table S4. Primers used for quantitative PCR. Related to the STAR Methods.
Table S5. Primers used for ChIP assay. Related to the STAR Methods.
Table S6. Primers used for genotyping the mutations of ACSS2. Related to the STAR Methods.