Abstract
In magnetic resonance diffusion imaging, gradient nonlinearity causes significant bias in the estimation of quantitative diffusion parameters such as diffusivity, anisotropy, and diffusion direction in areas away from the magnet isocenter. This bias can be substantially reduced if the scanner- and coil-specific gradient field nonlinearities are known. Using a set of field map calibration scans on a large (29 cm diameter) phantom combined with a solid harmonic approximation of the gradient fields, we predicted the obtained b-values and applied gradient directions throughout a typical field of view for brain imaging for a typical 32-direction diffusion imaging sequence. We measured the stability of these predictions over time. At 80 mm from scanner isocenter, predicted b-value was 1-6% different than intended due to gradient nonlinearity, and predicted gradient directions were in error by up to 1 degree. Over the course of one month the change in these quantities due to calibration-related factors such as scanner drift and variation in phantom placement was <0.5% for b-values, and <0.5 degrees for angular deviation. The proposed calibration procedure allows the estimation of gradient nonlinearity to correct b-values and gradient directions ahead of advanced diffusion image processing for high angular resolution data, and requires only a five-minute phantom scan that can be included in a weekly or monthly quality assurance protocol.
Keywords: MRI, quantitative diffusion imaging, b-values, gradient field nonlinearity
1. INTRODUCTION
Reliable quantitative results from diffusion magnetic resonance (MR) imaging are needed if diffusion imaging is to provide biomarkers that can be used across sites, scanners, and populations. At present, a number of confounding factors exist that reduce the accuracy and reliability of diffusion-based measurements in human MR. One, in particular, is the bias introduced by nonlinearity of the scanner's gradient fields, which causes spatially varying errors in the applied diffusion gradients. Gradient nonlinearity bias has been empirically confirmed as a major source of error for multicenter studies in diffusion derived metrics such as apparent diffusion coefficient1.
If the gradient coil fields are known, their spatial derivatives can be used to compute the spatially varying properties of the diffusion gradients that are actually obtained from a given pulse sequence2. This methodology3 has been applied in a large longitudinal multi-center breast imaging trial, demonstrating substantial improvements in the accuracy of estimated apparent diffusion coefficient4. Even approximate corrections can bring important improvements in accuracy5,6, although the full correction is becoming the standard practice for some studies such as the Human Connectome Project7,8.
We are evaluating a phantom-based calibration method that predicts the actually achieved diffusion gradient directions and amplitudes (b-values) at each voxel in a diffusion image. These quantities can then be used to more accurately estimate any metrics that are derived from diffusion images, such as diffusivity, anisotropy, and directional diffusion functions. Here we report the stability of the estimated b-values and gradient directions over multiple calibration scans. We propose this approach as a simple, fast method to improve the accuracy, repeatability, and multi-center consistency of quantitative metrics derived from advanced high angular resolution diffusion imaging protocols.
2. METHODS AND DATA
We produced field maps for each gradient coil using a large (290mm diameter) phantom. Using a solid harmonic approximation to the field, we predicted the spatially b-values and gradient directions actually obtained during a standard 32-direction diffusion imaging sequence. We compared these to the intended values at several locations in a field of view typical for brain imaging.
2.1 Gradient coil field mapping in phantom
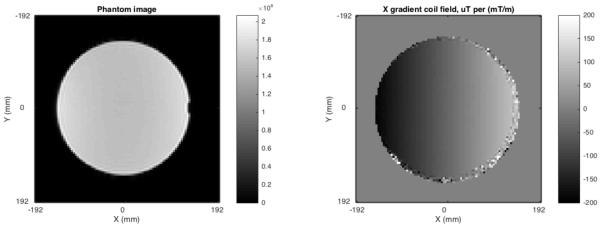
The gradient field mapping phantom consisted of a synthetic white oil (SpectraSyn 4 polyalphaolefin, ExxonMobil) in a polypropylene carboy of approximate dimensions 290 mm diameter, 500 mm height, holding approximately 24 liters. Imaging was performed on a 3 Tesla 3T Philips Achieva MRI system (Philips Healthcare, Inc., Best, Netherlands) using the internal body coil. The phantom was placed horizontally, approximately centered at the scanner isocenter. A dual echo EPI-based field mapping pulse sequence was used to measure the magnetic field in a 384 mm field of view with 4 mm isotropic voxel size. Four field maps were acquired, with gradient coil shim fields set to zero; X=0.05 mT/m; Y=0.05 mT/m; and Z=0.05 mT/m. Total scan time was approximately five minutes. The field produced by each linear gradient coil alone was estimated by subtracting the measured field with no shims active from the measured field with gradient applied to remove field variations unrelated to the gradient coil geometry (Figure 1). Gradient coil field maps were acquired on four dates over the course of a month.
Figure 1.
LEFT: Image of the gradient field mapping phantom. RIGHT: Measured field map for the X gradient coil. Fields were measured for all three linear gradient coils.
2.2 Solid harmonic model of the gradient coil fields
We modeled the field produced by each gradient coil as a sum of solid harmonics9,10 to 5th order, expressed in Cartesian form. Even harmonics were excluded due to the physical symmetry of the coils. Field measurements were extracted from the field maps at all voxels within a 300 mm diameter sphere at isocenter. The large field of view was used to improve the accuracy of estimates by including data well away from isocenter. The solid harmonic basis functions were pre-scaled to variance 1 to improve numerical precision, then fit to the field map data using robust linear regression. The result was a spatially smooth estimate of the true gradient field for each gradient coil.
2.3 Predicting achieved b-values and gradient directions from the field model
The achieved gradient, which varies over space, is related to the intended gradient by the spatially varying tensor L, where Bi is the gradient field for the ith coil2:
When the field is expressed as a sum of solid harmonics, the terms of each element of this matrix may be computed analytically and scaled by the coefficients estimated from the field map data to obtain a scanner-specific estimate of L. This can then be applied to the intended diffusion gradient vector G to yield the actually achieved gradient which is spatially varying3:
This may change the amplitude of the gradient as well as the angle. To simplify further processing, the estimate of the achieved gradient can be expressed as the product of an adjusted scalar b-value and a unit vector, b′g′. The spatially varying maps of adjusted values b′ and g′ can then be used in any usual way. This approach, while approximate in general, is convenient when the full b-matrix11,12 is not available, and the computed values can easily be entered into any existing computation pipeline.
3. RESULTS
At 80 mm from scanner isocenter along the longitudinal or transverse axes, predicted b-value was 1-6% different than intended due to gradient nonlinearity, and predicted gradient directions were in error by up to 1 degree. Over the course of one month the change in these quantities due to calibration-related factors such as scanner drift and variation in phantom placement was <0.5% for b-values, and <0.5 degrees for angular deviation.
3.1 Spatial variation in b-value
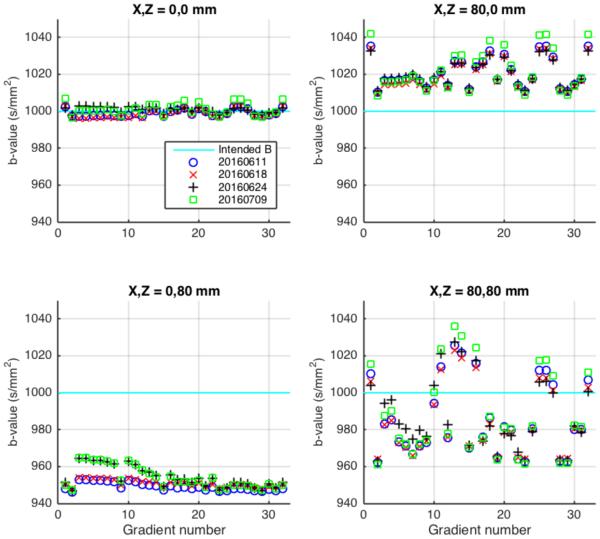
The predicted b-value varied by as much as 6% in a 200×200 mm field of view (Figures 2). At isocenter, the desired b-value of 1000 s/mm2 was achieved within 1% (Figure 3). At 80 mm from isocenter along the longitudinal axis of the scanner bore, achieved b-values were consistently lower than intended by 4-6%. Achieved b-values 80 mm transverse from isocenter were higher than intended by 1-4%. At 113 mm from isocenter (80 mm displaced on both axes), achieved b-values were up to 4% different from intended, with the sign of the error dependent on the applied diffusion gradient direction. The amount and sign of the error depended on the location in the field of view as well as the intended gradient direction.
Figure 2.
LEFT, CENTER: Spatial pattern of estimated achieved b-value for gradient #20, in a 200x200 mm field of view representing typical coverage for a human brain diffusion scan. The intended b-value was 1000 s/mm^2 at all locations. RIGHT: The intended gradient directional scheme, with #20 indicated in red.
Figure 3.
The b-values predicted to be achieved in different locations relative to scanner isocenter for a 32-direction diffusion imaging sequence, shown relative to the intended b-value of 1000 s/mm2 (cyan). Different symbols indicate use of correction factors obtained from calibration scans made on 4 different dates. UPPER LEFT: Scanner isocenter. LOWER LEFT: 80 mm from isocenter along the longitudinal axis of the scanner bore. UPPER RIGHT: 80 mm from isocenter along the transverse axis. LOWER RIGHT: 113 mm from isocenter (80 mm displaced on both axes).
3.2 Spatial variation in applied gradient direction
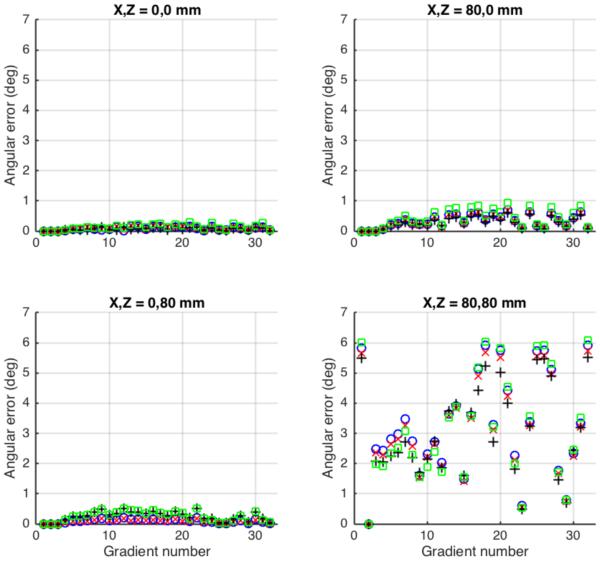
At isocenter, predicted error in gradient direction was less than 0.3 degrees (Figure 4). Off axis by 80 mm longitudinally, the error was less than 0.6 degrees, and off axis by 80 mm transverse the error was less than 1.0 degree. Off axis in both directions (113 mm from isocenter) the error was substantially larger for some gradient directions, up to 6.1 degrees. The amount and direction of the error depended on the location in the field of view as well as the intended gradient direction.
Figure 4.
Predicted angular error in applied diffusion direction in different locations relative to scanner isocenter for a 32-direction diffusion tensor imaging sequence. Symbols and measurement locations as Figure 3.
3.3 Stability of the phantom-based calibration strategy
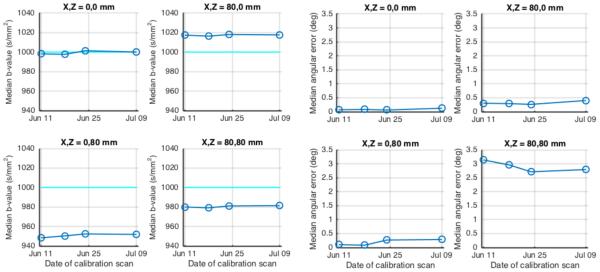
A significant concern when using this empirical field-map based strategy to estimate achieved b-values and gradient directions is the variability and stability over time of the estimates achieved. Figures 3 and 4 show the variation in predicted b-value and angular error from different calibration scans over the course of one month—in general, this variability is small relative to the size of the gradient nonlinearity effects. The time courses of median values over all gradient directions are shown in Figure 5. The error in median b-value ranged from 2-5%, while changes over time in this estimate were <0.5%. The median angular error ranged up to 3.1 degrees, whereas change over time in this estimate was <0.5 degrees.
Figure 5.
Stability of predicted achieved b-values and gradient directions over time. LEFT PANEL: Median achieved b-value for four different locations in the scanner bore. RIGHT PANEL: Median angular error at the same locations.
4. CONCLUSIONS
We observed that gradient field nonlinearity on the studied scanner caused the achieved b-values and gradient directions for a diffusion imaging sequence to vary within a typical brain imaging field of view to a degree that is likely to cause important inaccuracies when estimating quantitative diffusion parameters. This confirms similar findings by others1,2,4,13. To improve the quality and reproducibility of quantitative studies and to facilitate multi-center studies, a correction for these effects is needed.
Mapping the gradient coil field nonlinearities empirically with a brief (5 minute) scan in a large phantom, and using the proposed correction procedures, produces stable estimates of achieved b-value and gradient direction. The approach is simple and fast, can be applied retroactively, and produces voxel-specific b-value and direction maps that can be used with existing computational pipelines to improve the quantitative accuracy of diffusion MR imaging.
ACKNOWLEDGEMENTS
Supported by NIH (NIBIB) R01 EB017230-02 to Bennett A. Landman. This study was supported in part using the resources of the Advanced Computing Center for Research and Education (ACCRE) at Vanderbilt University, Nashville, TN. This project was supported in part by the National Center for Research Resources, Grant UL1 RR024975-01, and is now at the National Center for Advancing Translational Sciences, Grant 2 UL1 TR000445-06.
REFERENCES
- [1].Malyarenko DI, Newitt D, et al. Demonstration of nonlinearity bias in the measurement of the apparent diffusion coefficient in multicenter trials. Magn Reson Med. 2016;75(3):1312–23. doi: 10.1002/mrm.25754. J. W. L. [DOI] [PMC free article] [PubMed] [Google Scholar]
- [2].Bammer R, Markl M, Barnett A, et al. Analysis and generalized correction of the effect of spatial gradient field distortions in diffusion-weighted imaging. Magn Reson Med. 2003;50(3):560–9. doi: 10.1002/mrm.10545. [DOI] [PubMed] [Google Scholar]
- [3].Tan ET, Marinelli L, Slavens ZW, et al. Improved correction for gradient nonlinearity effects in diffusion-weighted imaging. J Magn Reson Imaging. 2013;38(2):448–53. doi: 10.1002/jmri.23942. [DOI] [PubMed] [Google Scholar]
- [4].Newitt DC, Tan ET, Wilmes LJ, et al. Gradient nonlinearity correction to improve apparent diffusion coefficient accuracy and standardization in the american college of radiology imaging network 6698 breast cancer trial. J Magn Reson Imaging. 2015;42(4):908–19. doi: 10.1002/jmri.24883. [DOI] [PMC free article] [PubMed] [Google Scholar]
- [5].Malkyarenko DI, Chenevert TL. Practical estimate of gradient nonlinearity for implementation of apparent diffusion coefficient bias correction. J Magn Reson Imaging. 2014;40(6):1487–95. doi: 10.1002/jmri.24486. [DOI] [PMC free article] [PubMed] [Google Scholar]
- [6].Malyarenko DI, Ross BD, Chenevert TL. Analysis and correction of gradient nonlinearity bias in apparent diffusion coefficient measurements. Magn Reson Med. 2014;71(3):1312–23. doi: 10.1002/mrm.24773. [DOI] [PMC free article] [PubMed] [Google Scholar]
- [7].Sotiropoulos SN, Jbabdi S, Xu J, et al. Advances in diffusion MRI acquisition and processing in the Human Connectome Project. Neuroimage. 2013;80:125–43. doi: 10.1016/j.neuroimage.2013.05.057. [DOI] [PMC free article] [PubMed] [Google Scholar]
- [8].Glasser MF, Sotiropoulos SN, Wilson JA, et al. The minimal preprocessing pipelines for the Human Connectome Project. Neuroimage. 2013;80:105–24. doi: 10.1016/j.neuroimage.2013.04.127. [DOI] [PMC free article] [PubMed] [Google Scholar]
- [9].Caola MJ. Solid harmonics and their addition theorems. J Phys A: Math Gen. 1978;11(2):L23–L25. [Google Scholar]
- [10].Tough RJA, Stone AJ. Properties of the regular and irregular solid harmonics. J Phys A: Math Gen. 1977;10(8):1261–1269. [Google Scholar]
- [11].Mattiello J, Basser PJ, Le Bihan D. The b matrix in diffusion tensor echo-planar imaging. Magn Reson Med. 1997;37(2):292–300. doi: 10.1002/mrm.1910370226. [DOI] [PubMed] [Google Scholar]
- [12].Mattiello J, Basser PJ, LeBihan D. Analytical expressions for the b matrix in NMR diffusion imaging and spectroscopy. J Magn Reson, Ser A. 1994;108(2):131–141. [Google Scholar]
- [13].Wu YC, Alexander AL. A method for calibrating diffusion gradients in diffusion tensor imaging. J Comput Assist Tomogr. 2007;31(6):984–93. doi: 10.1097/rct.0b013e31805152fa. [DOI] [PMC free article] [PubMed] [Google Scholar]


