

Abstract
Autophosphorylating histidine kinase CheA is central to signaling in bacterial chemotaxis. The kinase donates its phosphoryl group to two response regulators, CheY that controls flagellar rotation and thus motility and CheB, crucial for sensory adaptation. As measured by coupled CheY phosphorylation, incorporation into signaling complexes activates the kinase ∼1000‐fold and places it under control of chemoreceptors. By the same assay, receptors modulate kinase activity ∼100‐fold as a function of receptor ligand occupancy and adaptational modification. These changes are the essence of chemotactic signaling. Yet, the enzymatic properties affected by incorporation into signaling complexes, by chemoreceptor ligand binding or by receptor adaptational modification are largely undefined. To investigate, we performed steady‐state kinetic analysis of autophosphorylation using a liberated kinase phosphoryl‐accepting domain, characterizing kinase alone, in isolated core signaling complexes and in small arrays of core complexes assembled in vitro with receptors contained in isolated native membranes. Autophosphorylation in signaling complexes was measured as a function of ligand occupancy and adaptational modification. Activation by incorporation into signaling complexes and modulation in complexes by ligand occupancy and adaptational modification occurred largely via changes in the apparent catalytic rate constant (k cat). Changes in the autophosphorylation k cat accounted for most of the ∼1000‐fold kinase activation in signaling complexes observed for coupled CheY phosphorylation, and the ∼100‐fold inhibition by ligand occupancy or modulation by adaptational modification. Our results indicate no more than a minor role in kinase control for simple sequestration of the autophosphorylation substrate. Instead they indicate direct effects on the active site.
Keywords: bacterial chemotaxis, histidine kinase, bacterial chemoreceptors, Nanodiscs, enzyme kinetics
Abbreviations
- EDTA
ethylenediaminetetraacetic acid
- IPTG
isopropyl β‐D‐1‐thiogalactopyranoside
- PCR
polymerase chain reaction
- Tar
chemoreceptor mediating taxis to aspartate and repellents
- Tar‐EEEE
Tar with 4 glutamyl residues at the sites of adaptational modification
- Tar‐QQQQ
Tar with 4 glutaminyl residues at the sites of adaptational modification
Introduction
Autophosphorylating histidine kinase CheA [Fig. 1(A)] is central to molecular mechanisms of bacterial chemotaxis. See recent reviews1, 2, 3, 4 for overviews of the chemotaxis system. Kinase activity determines cellular levels of the phosphorylated, i.e., active forms of response regulator CheY and the methylesterase of sensory adaptation, CheB. Control of kinase activity by transmembrane, methyl‐accepting chemoreceptor proteins directs bacterial movement in favorable directions. Isolated CheA has low kinase activity. As measured by the coupled phosphorylation of CheY, incorporation into signaling complexes with chemoreceptors and the coupling protein CheW activates the kinase up to 1000‐fold and places the enhanced activity under control of chemoreceptors.5, 6, 7 In signaling complexes, attractant binding to receptors inhibits kinase activity. At saturation this inhibition is 50‐fold to 100‐fold. The chemotactic sensory adaptation system counteracts this inhibition via chemoreceptor covalent modification. Four methyl‐accepting glutamyl residues in the receptor cytoplasmic domain can be methylated by methyltransferase CheR to form neutral glutamyl methylesters, a modification that results in a chemoreceptor conformational change that generates kinase activation. These methylesters can be demethylated by methylesterase CheB to reform the negatively charged side chain, a modification that reduces kinase activity. Glutaminyl residues at methyl‐accepting sites have essentially the same effects as methylesters8, 9 and thus manipulating a chemoreceptor gene to code for glutamines at those sites allows creation of receptors with defined extents and positions of adaptational modification. Kinase activation by a fully modified, all‐glutamine receptor as measured by coupled phosphorylation of CheY is almost 200‐fold greater than by an all‐glutamate receptor.10
Figure 1.
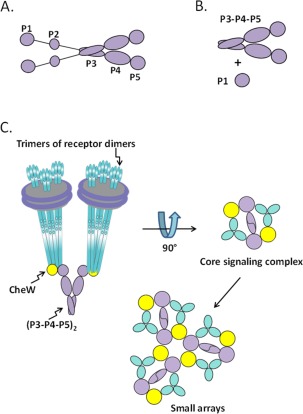
Cartoon representations of autophosphorylating kinase CheA and chemotaxis signaling complexes. (A) CheA homodimer. The five domains are shown as purple balls and ovals, labeled P1 through P5 for one protomer (see text). Lines between P1 and P2, and between P2 and P3 represent flexible linkers that provide mobility for P1 and P2. (B) Liberated P1 and catalytic fragment P3‐P4‐P5. (C) Signaling complexes of receptor‐CheW‐CheA P3‐P4‐P5. The left‐hand cartoon represents a core signaling complex of two trimers of receptor dimers inserted into water‐soluble Nanodiscs, two copies of coupling protein CheW and a CheA P3‐P4‐P5 dimer. The right‐hand diagram is the view of the complex from its cytoplasmic tip. Core complexes can interact and expand to higher order array structures (bottom).
Chemotactic kinase CheA is a type II histidine kinase.11 It forms homodimers.12 Only the dimeric form is enzymatically active.13 The protein has five domains [Fig. 1(A)].14 P1 carries the auto‐phosphorylated histidine, His48. P2 binds CheY and CheB, bringing those substrate proteins in proximity to phosphorylated P1 and thus accelerating phosphoryl transfer. P3 is the dimerization domain; two helices from each CheA protomer combine to form an inter‐subunit four‐helix bundle.14 P4 contains the kinase active site and thus binds both substrates, P1 and ATP. Regulatory domain P5 interacts with chemoreceptors and CheW to form core signaling complexes in which kinase activity is coupled to receptors and placed under their regulatory control.7, 15, 16 An unstructured linker between P1 and P2, and another between P2 and P3, totaling ∼60 residues of unstructured polypeptide chain, provide considerable mobility for the self‐contained P1 and P2 domains.17, 18, 19 Thus interaction of the P1 phosphoryl‐accepting domain and the P4 active site occurs by diffusion of P1 on a relatively long tether. In fact, the “liberated,” untethered form of P1 is phosphorylated by the P3‐P4‐P5 portion of the kinase.20, 21, 22 We have utilized this phenomenon in the experimental design of the current study.
Kinase activation upon formation of signaling complexes, kinase inhibition by chemoreceptor ligand occupancy and control of kinase activity by chemoreceptor adaptational modification must all alter crucial features of the enzymatic reaction. However, information about the identity of these features is limited and incomplete. Thus, we undertook Michaelis‐Menten analysis of steady‐state kinetics for kinase autophosphorylation by CheA alone, CheA in isolated signaling complexes and CheA in signaling complexes interacting in small arrays. For the latter two conditions, we determined autophosphorylation kinetics as a function of chemoreceptor ligand occupancy and adaptational modification.
Results
Experimental strategy
The initial step in phosphoryl transfer by the chemotaxis two‐component signaling system is autophosphorylation of kinase CheA. Our studies of kinase activation and inhibition characterized this reaction by steady‐state, Michaelis‐Menten analysis. There are two substrates in the autophosphorylation reaction, the phosphoryl‐donor ATP and the phosphoryl‐accepting histidine on the P1 domain of the kinase. One substrate, P1, is tethered to the active site. This situation limits and complicates steady‐state kinetic characterization of autophosphorylation by intact kinase because the concentration of that substrate cannot be varied, the enzyme undergoes a single turnover and the phosphoryl group on P1 is readily transferred back to ADP.23 To overcome these limitations, we used P1 liberated by genetic manipulations from the enzymatically active module, domains P3‐P4‐P5 [Fig. 1(B)].21 Other investigators have shown that liberated P1 is effectively phosphorylated by domains P3‐P4‐P5 and the separated domains allow kinetic characterization of autophosphorylation.20, 21, 22
A second design issue was the possibility of local trapping of ATP or liberated P1 near the active site. Specifically, in arrays of signaling complexes, there are multiple kinase active sites in close proximity. Since substrates generally interact with active sites many times before catalysis occurs,24 high local concentrations of substrate‐binding sites could retain substrates near the active site, generating effective local concentrations higher than bulk concentrations and thus confounding kinetic analysis based on values of bulk concentrations. We addressed this issue by characterizing kinase autophosphorylation in isolated signaling complexes assembled using Nanodisc‐inserted chemoreceptors25, 26 and compared those results to kinase autophosphorylation by the small arrays of signaling complexes that assemble on chemoreceptors inserted in native membranes fragments isolated from cells overproducing those receptors [Fig. 1(C)].27
Kinetic analysis of CheA autophosphorylation
We performed steady‐state kinetic analysis of P1 phosphorylation by CheA P3‐P4‐P5 alone and incorporated into individual, Nanodisc‐based core signaling complexes assembled using the Escherichia coli aspartate receptor Tar in its native gene‐encoded, intermediate modification state of the four methyl‐accepting sites: glutamine, glutamate, glutamine, glutamate (QEQE), at sites 1 through 4, respectively (Fig. 2). Initial rates of P1 phosphorylation by P3‐P4‐P5 (Supporting Information Fig. S2), which are equivalent to initial rates of autophosphorylation for intact CheA, were determined as a function of variable concentrations of one substrate or the other (ATP or P1) in the presence of a constant concentration of the second substrate (P1 or ATP). For signaling complexes, these studies were repeated in the presence of aspartate, a Tar‐recognized chemoattractant. The effects of this receptor ligand were examined at two concentrations: 5 μM, almost two‐fold above the half‐maximal inhibitory concentration of 2.8 μM (Supporting Information Fig. S3), and 20 μM, equivalent to 88% receptor saturation (Figs. 2 and 4). As observed in previous studies,5, 7, 28 incorporation of kinase into signaling complexes greatly enhanced phosphorylation and the presence of an attractant ligand significantly reduced it.
Figure 2.
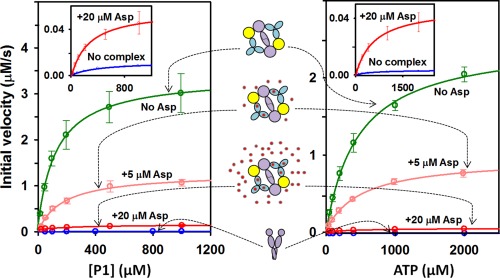
P1 phosphorylation by CheA P3‐P4‐P5. Mean values of initial rates as a function of concentration of P1 (left) or ATP (right) in the presence of a constant concentration of the other substrate (1000 μM ATP or 100 μM P1, respectively) are shown for P3‐P4‐P5 alone (blue) and in core complexes with Tar in the absence of ligand (green), plus 5 μM (pink) or 20 μM aspartate (red). Cartoons between the two panels illustrate the various conditions. The inset shows an expanded scale for two lowest curves. Supporting Information Figure S1 provides a further expansion for the lowest curve, P3‐P4‐P5 alone. To facilitate direct comparisons, initial rates were normalized to 1.8 μM P3‐P4‐P5. Error bars represent standard deviations of the mean (n ≥ 3).
Figure 4.
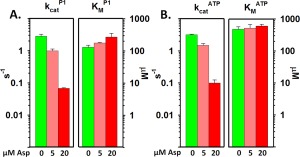
Comparison of kinetic parameters for P3‐P4‐P5 in core complexes in the absence and presence of the Tar ligand aspartate. Mean values determined by varying P1 (A) or ATP (B) for k cat (left‐hand sets of bars) and K M (right‐hand sets of bars) in the absence (green) or presence of 5 μM (pink) or 20 μM (red) aspartate are displayed on logarithmic scales. Error bars represent standard deviations of the mean (n ≥ 3). See Table I for numerical values.
From these primary data we determined for each substrate kinetic parameters of P1 phosphorylation: the apparent catalytic rate constant k cat, the Michaelis constant K M and the catalytic efficiency k cat/K M (Tables 1 and 2). K M values were determined directly from data plots by fitting to the Michaelis‐Menten equation. Values for k cat were calculated from the respective data sets, one generated by varying ATP concentration and the other by varying P1 concentration. We divided the V max determined using Michaelis‐Menten fitting of the primary data by the concentration of enzyme, i.e., P3‐P4‐P5. For P3‐P4‐P5 alone the enzyme concentration was the concentration of P3‐P4‐P5 in the reaction mixture. For kinase in Nanodisc‐based, single core complexes, the relevant enzyme concentration was the concentration of P3‐P4‐P5 incorporated into signaling complexes. We determined that concentration by utilizing the receptor‐borne affinity tag to separate P3‐P4‐P5 incorporated into Nanodisc‐based core complexes from unassociated enzyme (see Materials and Methods). Kinetic experiments were performed at sub‐saturating concentrations of the constant substrate (ATP or P1) and varying concentrations of the other substrate (P1 or ATP). Resulting apparent k cat values were lower than actual k cat values because the constant substrate was not at saturation. We used those values to calculate actual k cat values corresponding to saturation by both substrates using the Michaelis‐Menten equation and K M values determined for the constant substrate by experiments in which that substrate was the variable one (see Materials and Methods). Thus we obtained two separate determinations of the overall apparent rate constant of P1 phosphorylation. The resulting values were the same within the error of the determinations (Tables 1 and 2). This provided an important internal check of the validity of our measurements and calculations. For each condition, the separate values were averaged to yield a best estimate of the apparent rate constant of CheA autophosphorylation. That averaged value was used to calculate values for k cat/K M, a measure of enzymatic catalytic efficiency.
Table 1.
Kinetic Constants for P1 Phosphorylation by P3‐P4‐P5 Alone and in Core Complexes Assembled with Tar‐QEQE ± Asp
| Vary [P1] | Vary [ATP] | |||||||
|---|---|---|---|---|---|---|---|---|
| Kinase | [Asp] (μM) | K M (μM) | k cat (s−1) | K M (μM) | k cat (s−1) | Mean k cat a (s−1) | k cat a/ (103 M−1 s−1) | k cat a/ (103 M−1 s−1) |
| Alone | 0 | 430 ± 61 | 0.010 ± 0.001 | 550 ± 37 | 0.010 ± 0.001 | 0.010 ± 0.001 | 0.023 ± 0.004 | 0.018 ± 0.002 |
| Core compl. | 0 | 130 ± 20 | 2.8 ± 0.5 | 480 ± 93 | 3.2 ± 0.03 | 3.0 ± 0.2 | 23 ± 4 | 6.3 ± 1.3 |
| Core compl. | 5 | 180 ± 6 | 1.0 ± 0.1 | 520 ± 160 | 1.5 ± 0.2 | 1.3 ± 0.1 | 7.1 ± 0.7 | 2.4 ± 0.8 |
| Core compl. | 20 | 270 ± 80 | 0.068 ± 0.001 | 600 ± 89 | 0.10 ± 0.02 | 0.084 ± 0.012 | 0.31 ± 0.10 | 0.14 ± 0.03 |
Average of the k cat values in columns 4 and 6.
Table 2.
Kinetic Constants for P1 Phosphorylation by P3‐P4‐P5 in Small Arrays of Core Complexes with Tar‐QEQE ± Asp
| Vary [P1] | Vary [ATP] | ||||||
|---|---|---|---|---|---|---|---|
| [Asp] (μM) | K M (μM) | k cat (s−1) | K M (μM) | k cat (s−1) | Mean k cat a (s−1) | k cat a/ (103 M−1 s−1) | k cat a/ (103 M−1 s−1) |
| 0 | 120 ± 17 | 2.2 ± 0.3 | 330 ± 6 | 2.4 ± 0.3 | 2.3 ± 0.2 | 19 ± 3 | 7.0 ± 0.7 |
| 5 | 100 ± 6 | 0.53 ± 0.13 | 390 ± 47 | 0.77 ± 0.15 | 0.65 ± 0.10 | 6.3 ± 1.0 | 1.7 ± 0.3 |
| 100 | 150 ± 70 | 0.13 ± 0.01 | 560 ± 78 | 0.20 ± 0.02 | 0.17 ± 0.01 | 1.1 ± 0.5 | 0.29 ± 0.05 |
Average of the k cat values in columns 3 and 5.
Figure 3 illustrates that kinase activation in signaling complexes affected primarily k cat, enhancing that parameter 300‐fold, modestly improved , i.e., decreased its value (3.3‐fold) and did not significantly change . These changes enhanced k cat/ 350‐fold and k cat/ 1000‐fold. Similarly, as illustrated in Figure 4, aspartate at 88% receptor saturation reduced k cat almost 40‐fold, increased 2.1‐fold and had no significant effect on , resulting in respective k cat/K M values reduced to 1.3% and 2.2% of the ligand‐free condition.
Figure 3.
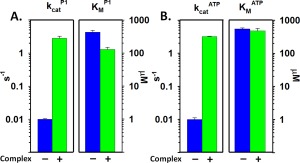
Comparison of kinetic parameters derived from the data in Fig. 2 for P3‐P4‐P5 alone and in core signaling complexes. Mean values determined by varying P1 (A) or ATP (B) for k cat (left‐hand pairs of bars) and K M (right‐hand pairs of bars) are displayed on logarithmic scales. Error bars represent standard deviations of the mean (n ≥ 3). See Table I for numerical values.
Comparison of isolated core complexes and small arrays
We compared (Fig. 5) activation and ligand control of CheA P3‐P4‐P5 in Nanodisc‐based, isolated core signaling complexes (Fig. 2, Table 1) to activation and control in small arrays of core complexes assembled using E. coli membrane isolated from cells overproducing a chemoreceptor (Supporting Information Fig. S4, Table 2). Comparable small arrays,27 assembled with intact kinase, have been used extensively by multiple laboratories to characterize in vitro receptor‐controlled signaling.10, 29, 30, 31, 32, 33, 34 To determine k cat values for the small arrays of Tar signaling complexes assembled with CheA P3‐P4‐P5, we determined the amount of kinase incorporated into those complexes by quantifying P3‐P4‐P5 retained by the membranes after centrifugation and washing to remove free enzyme.33 As illustrated in Figure 5, there were no systematic differences between the two preparations in terms of signaling complex‐mediated activation or ligand‐mediated inhibition of kinase autophosphorylation. Thus, it appears that small arrays of core complexes do not significantly confound kinetic analysis because of increased local substrate concentrations generated by the presence of multiple closely clustered substrate‐binding sites. On the basis of this information, we used the small arrays of signaling complexes assembled on native membranes containing inserted Tar to investigate effects of adaptational modification.
Figure 5.
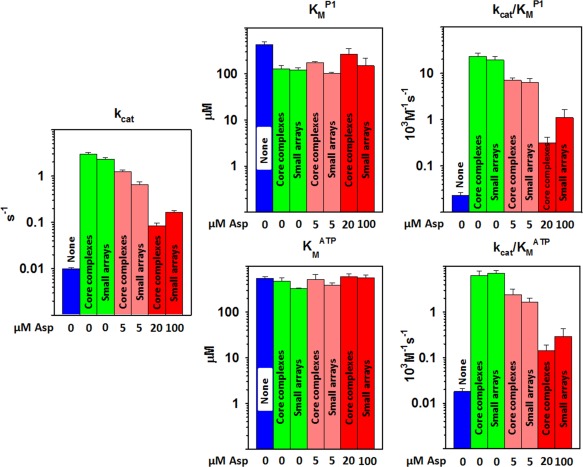
Comparison of kinetic parameters for P3‐P4‐P5 alone, in core complexes and in small core complex arrays. Each set of bar graphs displays kinetic parameters on logarithmic scales for CheA P3‐P4‐P5 alone (blue), in core complexes or small arrays of those complexes with aspartate at 0 μM (green), 5 μM (pink) or a concentration close to saturating (20 or 100 μM; red). The left‐hand plot shows the mean of k cat values determined by varying P1 or ATP. The middle and right‐hand plots show mean K M and k cat/K M values for P1 (upper) and ATP (lower). Error bars represent standard deviations of the mean (n ≥ 3). See Tables I and II for numerical values.
Kinetic analysis of effects of chemoreceptor modification state on kinase autophosphorylation
It has long been observed that kinase activity of signaling complexes increases as chemoreceptor modification increases.29, 31, 34 We investigated the kinetic basis of these activity changes with analysis of P1 phosphorylation by P3‐P4‐P5 in small arrays of signaling complexes containing Tar at the two extremes of adaptational modification: none, glutamyl residues at the four methyl‐accepting sites (Tar‐EEEE); and complete, glutaminyl residues at the four sites (Tar‐QQQQ). The kinetic parameters derived from these data are shown in Table 3 and plotted in Figure 6, along with the previously considered parameters for signaling complexes assembled with intermediate‐modification‐state receptor Tar‐QEQE (Fig. 5, Table 2). Those parameters indicate that the increase in kinase activity from no receptor modification to complete modification reflected in large part enhancement of k cat, ∼160‐fold, and modest reductions of and values, 3.2‐fold and 1.6‐fold, respectively. These changes resulted in enhancements of k cat/K M values 250‐fold for P1 and 500‐fold for ATP. Addition of a near‐saturating concentration of the Tar ligand aspartate to signaling complexes formed with Tar in the two extremes of adaptational modification followed the pattern observed for Tar in the intermediate modification state (Tables 2 and 3, Fig. 6). The principal change upon ligand occupancy was in k cat with no changes outside the error bars for and modest changes in . Those modest changes would account for only a small portion of the observed kinase inhibition by ligand occupancy.
Table 3.
Kinetic Constants for P1 Phosphorylation by P3‐P4‐P5 in Small Arrays of Core Complexes as Function of Tar Modification and [Asp]
| Vary [P1] | Vary [ATP] | |||||||
|---|---|---|---|---|---|---|---|---|
| Tar modification | [Asp] (μM) | K M (μM) | k cat (s−1) | K M (μM) | k cat (s−1) | Mean k cat a (s−1) | k cat a/ (103 M−1 s−1) | k cat a/ (103 M−1 s−1) |
| EEEE | 0 | 210 ± 26 | 0.027 ± 0.003 | 940 ± 280 | 0.033 ± 0.005 | 0.030 ± 0.003 | 0.14 ± 0.02 | 0.032 ± 0.010 |
| EEEE | 10 | 210 ± 29 | 0.0072 ± 0.0013 | 3100 ± 950 | 0.0066 ± 0.0011 | 0.0068 ± 0.0008 | 0.033 ± 0.006 | 0.0022 ± 0.0007 |
| QEQE | 0 | 120 ± 17 | 2.2 ± 0.3 | 330 ± 6 | 2.4 ± 0.3 | 2.3 ± 0.2 | 19 ± 3 | 7.0 ± 0.7 |
| QEQE | 100 | 150 ± 70 | 0.13 ± 0.01 | 560 ± 78 | 0.20 ± 0.02 | 0.17 ± 0.01 | 1.1 ± 0.5 | 0.29 ± 0.05 |
| QQQQ | 0 | 130 ± 21 | 5.2 ± 1.2 | 290 ± 15 | 4.1 ± 1.0 | 4.7 ± 0.8 | 35 ± 8 | 16 ± 3 |
| QQQQ | 1000 | 130 ± 15 | 0.18 ± 0.05 | 380 ± 120 | 0.19 ± 0.04 | 0.19 ± 0.03 | 1.5 ± 0.3 | 0.49 ± 0.18 |
Average of the k cat values in columns 4 and 6. QEQE data from Table 2.
Figure 6.
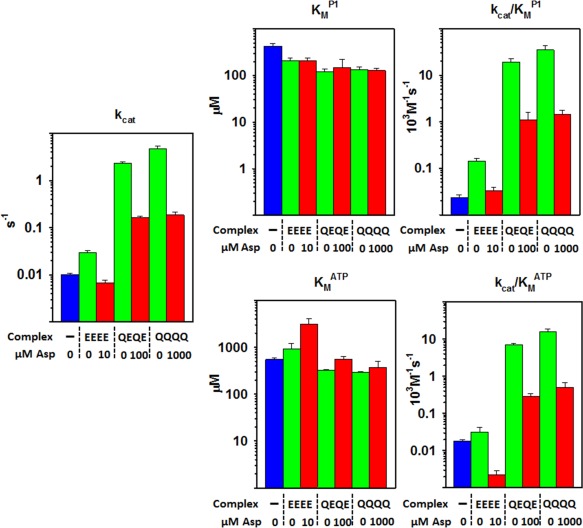
CheA P3‐P4‐P5 kinetic parameters in small arrays of core complexes as a function of receptor modification state. Each set of bar graphs displays kinetic parameters on logarithmic scales for CheA P3‐P4‐P5 alone (blue), in small arrays of core complexes with chemoreceptor Tar at the indicated modification state and aspartate at 0 μM (green) or a concentration close (see Supporting Information Fig. S3) to saturating (red). The left‐hand plot shows the averages of k cat values determined by varying P1 or ATP. The middle and right‐hand plots show mean K M and k cat/K M values for P1 (upper) and ATP (lower). Error bars represent standard deviations of the mean (n ≥ 3). See Table III for numerical values.
Discussion
Studies described here revealed that both activation and inhibition of CheA autophosphorylation are mediated primarily by changes in the apparent rate constant of phosphoryl transfer to the kinase P1 domain, that simple sequestration of the phosphoryl‐accepting CheA domain P1 is not a major contributor to kinase control and that K M values for P1 and ATP are poised near the estimated concentrations of the natively tethered domain and cellular ATP, respectively. In addition, as discussed in a following section, comparison of our data for P1 phosphorylation with data for coupled phosphorylation of response regulator CheY indicates that most of the control of kinase‐mediated signaling is at the level of autophosphorylation, not at the level of phosphoryl transfer to the response regulator. We consider these observations in more detail in the sections below, after a brief discussion of the relationship of kinetic parameters we determined to parameters reported in previous studies.
Previous publications have reported values for a few of the kinetic parameters determined in the current study. Values we determined for those parameters are in large part consistent with published values. Our values for (Tables 1, 2, 3 are within the 170 to 770 μM range of published values for intact CheA, the CheA catalytic domain or either enzyme form in signaling complexes.5, 22, 35, 36 The 0.01 s−1 apparent rate constant (k cat) we determined for phosphorylation of liberated P1 by P3‐P4‐P5 alone was close to but lower than the 0.026 s−1 value determined by an extensive kinetic characterization of intact CheA autophosphorylation,36 perhaps because of a modest difference between rate constants for the liberated and tethered domain. In contrast, a kinetic study of CheA and its catalytic fragment P3‐P4‐P5 as isolated enzymes and in signaling complexes assembled with receptor fragments reported quite different values for k cat, ∼10‐fold higher for the intact enzyme and 48‐fold higher for P3‐P4‐P5.22 That study also reported values approximately 20‐fold lower than the values we determined (Tables 1, 2, 3. The origins of these disparities are not clear, but could reflect several significant differences between the experimental designs of the two studies. Importantly, the earlier study did not characterize intact signaling complexes but instead complexes of CheW, and CheA with chemoreceptor cytoplasmic domains lacking periplasmic and transmembrane domains and thus membrane association, and that exhibited with an apparent stoichiometry and three‐dimensional organization different from those for the intact system.37 In addition, the earlier study was performed using Salmonella enterica chemotaxis proteins and an assay that monitored phosphorylation by coupled reactions monitoring steady‐state phosphorylation not initial rate.
Kinase autophosphorylation is controlled via kcat
Chemotaxis kinase CheA is influenced by three different inputs. It is activated by formation of chemotaxis signaling complexes, inhibited by ligand occupancy of receptors in those complexes and activated in complexes by covalent modifications that eliminate the negative charges of specific glutamyl residues at the receptor methyl‐accepting sites. We investigated which features of enzyme activity were affected by the respective inputs and found that the major effect for all three was on the apparent catalytic rate constant of the reaction, k cat. In some conditions the value of a substrate K M was altered, but no more than approximately three‐fold, not the orders of magnitude changes observed for the apparent value of k cat. In interpreting these observations, we can consider K M values approximations of substrate dissociation constants because P1 phosphorylation by P3‐P4‐P5 fulfills the requirements of no known enzyme‐substrate covalent intermediate and dissociation of enzyme‐substrate complex much more likely than catalysis. The latter situation results from low apparent rate constants (<10 s−1) and K M values in the hundreds of micromolar. This indicates that the principal target of all three ways of affecting kinase activity is the rate constant of catalysis and not affinity of the enzyme for either substrate.
Thus, we conclude that the effects we observed on the apparent values of k cat are effects on the rate‐limiting step of the catalytic mechanism. That step could be chemical transfer of the phosphoryl group from ATP to the histidinyl side chain of P1, release of product phospho‐P1, release of ADP, or some other aspect of the catalytic cycle. Our data are consistent with complex formation, ligand binding and adaptational modification all targeting the same rate‐limiting step for acceleration or deceleration. However, the situation could be more complex if the identity of the rate‐limiting step changed upon activation or inhibition. In any case, k cat could be changed in a pattern consistent with our data by action on the kinase active site to alter its effectiveness directly or by shifting an equilibrium between active and inactive conformations of that site.23
Kinase control is almost entirely control of autophosphorylation
Chemotactic responses are the result of controlled changes in the cellular content of the phosphorylated form of response regulator CheY. Formation of CheY‐P involves two steps, phosphoryl transfer from ATP to a histidinyl residue on CheA domain P1 and phosphoryl transfer from P1 to response regulator CheY. Physiologically relevant kinase activity could be controlled at one or both steps. The work described here documents significant control of CheA autophosphorylation. Is there additional control at the step of phosphoryl transfer from P1‐P to CheY? Comparisons of the data from this study with previous studies (Fig. 7) indicate that there could be modest additional control at that step, but that its magnitude would be small in relation to the overall change in kinase activity. Specifically, Nanodisc‐based core complexes made with Tar‐QEQE and assembled with CheA P3‐P4‐P5 increased the rate constant of kinase autophosphorylation ∼350‐fold and k cat/K M 350‐to‐1000‐fold for P1 and ATP, respectively (Table 1). Nanodisc‐based Tar‐QEQE core complexes assembled with intact CheA activated the rate of CheY‐P formation ∼750‐fold.7 Comparison of these respective enhancements indicates that any contribution to activation of physiologically relevant kinase activity by phosphoryl transfer from P1‐P to CheY would be no more than two‐fold. Correspondingly, saturation with attractant ligand of chemoreceptors in core complexes made with CheA P3‐P4‐P5 inhibited the k cat of autophosphorylation ∼40‐fold and k cat/K M in the order of 50‐fold (Table 1) whereas ligand saturation of intact CheA complexes inhibited the rate of CheY‐P formation ∼135‐fold,7 implying no more than a three‐fold contribution to inhibition of phosphoryl transfer from P1‐P to CheY.
Figure 7.
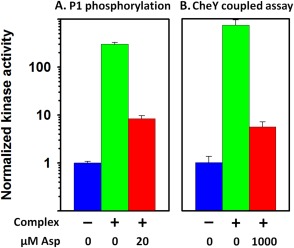
Comparison of modulation of kinase autophosphorylation and modulation of coupled phosphorylation of CheY. Kinase activities normalized for each assay to the value for isolated kinase are plotted on a log scale for kinase alone (blue), in Nanodisc‐based, single core complexes assembled with Tar‐QEQE (green) or in those complexes in the presence of a near‐saturating concentration of the Tar attractant ligand aspartate (red). For numerical values shown in (A) see Table I, for (B) see Li & Hazelbauer's 7. A. Normalized k cat values for phosphorylation of liberated CheA P1 by CheA P3‐P4‐P5. B. Normalized initial rate values for coupled phosphorylation of CheY by intact CheA.
P1 sequestration at a site distinct from and unlinked to the active site is not a major contributor to kinase control
One means of controlling kinase activity of the intact enzyme would be to control availability of tethered P1, for instance by sequestering the domain at a binding site away from the kinase active site. In fact, a P1‐binding site separate from the active site has been identified on the CheA P4 domain38 and proposed on chemoreceptors.30 In addition, tomographic images of signaling complex arrays revealed that in kinase‐off signaling states the P1 and P2 domains of the intact kinase were sufficiently immobilized that they were visible as distinct densities in the sub‐volume averages, but were not resolved in sub‐volume averages of kinase‐on signaling states.39 These observations suggest that low kinase activity could correspond to immobilized, perhaps sequestered P1 domains. Our studies of kinase autophosphorylation using liberated P1 domains provided an opportunity to test the importance of sequestering P1‐binding sites in control of kinase activity. In our experiments, liberated P1 was at concentrations of hundreds of micromolar whereas signaling complexes and their constituent proteins were at concentrations 100‐ to 1000‐fold lower. As a result, any P1‐binding sites capable of sequestering the single P1 available to the active site of intact CheA would be occupied, but many P1 domains would still be available for interaction and catalysis at the kinase active site. If simple sequestering of tethered P1 were a major contributor to the kinase‐off state, or release of sequestered P1 were a major contributor to its kinase‐on state, then in experiments with liberated P1 and the catalytic P3‐P4‐P5 fragment, activity differences between the kinase‐off and kinase‐on states would have been significantly reduced or eliminated. Instead activation and inhibition of kinase corresponded, within a factor of two or three to the orders‐of‐magnitude effects observed for intact enzyme (Fig. 7). P1 sequestration at a site distinct from the active site could be involved in the remaining factor of two or three.
Although simple sequestration of P1 cannot be a major contributor to kinase control, a P1‐binding site distinct from the active site might be involved if occupancy of such a distinct, high‐affinity site blocked access to the active site or disrupted it allosterically, and the inhibiting P1‐binding site were available in the inactive state of the enzyme but not in its active state. Thus, transitions from inactive to active or vice versa would involve reductions or increases, respectively, in the proportion of the enzyme population with the inhibiting site available, generating apparent changes in k cat values and little change in values of K M.
KM values for ATP and P1 are appropriate for their respective physiological concentrations
K M values are generally related to the physiological concentrations of the respective substrates. This is the case for the chemotaxis kinase. The intracellular concentration of ATP in E. coli averages ∼1.5 mM.40 Most K M values for ATP we determined ranged from 0.3 to 0.6 mM (Tables 1, 2, 3. Thus, in terms of ATP, autophosphorylation would proceed at 71 to 83% of maximal rate and the modest changes we observed for values would affect the rate no more than ∼20%. For P1, the relevant concentration for intact enzyme is the local concentration of the natively tethered domain. This concentration can be estimated as ∼730 µM (see Materials and Methods). values ranged from ∼100 to 430 μM (Tables 1, 2, 3, below the substrate concentration, but sufficiently close to allow modest effects on reaction rate. The largest change we observed for the , a shift from 430 μM for free kinase to 130 μM for kinase in isolated core complexes, would increase reaction rate ∼ 20%.
A common target for kinase control by different inputs
Our understanding of interactions in signaling complexes is consistent with a common target for all three inputs that alter kinase activity. In signaling complexes, the enzyme has physical contact with chemoreceptors and CheW15, 16, 41 and thus kinase activation by formation of signaling complexes must involve one or both of these contacts. The magnitude of activation is a function of receptor signaling state. In signaling complexes, k cat and k cat/K M of the kinase are enhanced relative to the free enzyme, but the magnitude is a function of the signaling state of the chemoreceptors in those complexes (Fig. 6). Tar‐EEEE, strongly shifted to the kinase off conformation, enhanced k cat and k cat/K M only ∼three‐fold and ∼10‐fold, respectively. Tar‐QQQQ, strongly shifted to the kinase on conformation, enhanced k cat and k cat/K M 470‐fold and ∼1000‐fold, respectively (Table 3). Shifting either conformation toward a kinase‐off state by ligand occupancy reduced activation, for Tar‐EEEE to the low activity of free CheA (Table 3). A unified interpretation is that kinase activation by interaction with receptors in signaling complexes, whether by direct contact or via CheW, is a function of receptor signaling state, whether influenced by ligand occupancy or adaptational modification. Thus, we suggest that all three inputs influence the kinase via the same physical contacts and in large part alter the same enzymatic property, the apparent kinase rate constant.
Materials and Methods
Plasmids, strains, proteins, and Nanodiscs
Membrane scaffold protein MSP1D1E3(‐)42 and CheW43 were produced and purified as described. E. coli Tar‐EEEE, Tar‐QEQE and Tar‐QQQQ with six‐histidine, carboxyl‐terminal extensions were produced in E. coli K12 strain RP3098 that does not contain chemotaxis or chemoreceptor proteins,44 harboring pAL529,45 pAL6746 or pAL533,10 respectively. Cytoplasmic membranes enriched in the respective receptor forms were prepared as described.10, 47 Nanodiscs containing 3.5 to 4 Tar dimers per disc were prepared using Ni‐NTA affinity chromatography and size‐exclusion chromatography.7 The P1 and the P3‐P4‐P5 fragment of E. coli CheA were isolated from E. coli BL21 (DE3) harboring pET28a carrying the coding sequence for CheA residues 1‐134 with six histidines at its carboxyl terminus or for CheA residues 261‐654 with the coding sequence for the amino‐terminal six‐histidine tag removed by mutagenic primers and PCR, respectively.48 Plasmid‐harboring strains were inoculated into LB broth (10 g/L Bacto tryptone, 5 g/L Yeast extract, 10 g/L NaCl) at OD560 ∼0.05, incubated with agitation at 35°, IPTG added at OD560 ∼0.4 to induce expression and harvested at OD560 ∼3.0. Cells were pelleted by centrifugation at 15,000 g and 4° in a SLC‐6000 rotor (Thermo Fisher Scientific, Waltham, MA), suspended in a smaller volume of 50 mM Tris‐HCl (pH 7.5), 0.5 mM EDTA, 2 mM dithiothreitol and 20% (w/v) glycerol and lysed in a French Press at 4°. Lysates were centrifuged at 100,000 g and 4° in a TL100.4 rotor (Beckman Coulter, Brea, CA). Supernatants containing P1‐ His6 were applied to a Ni‐NTA column (GE Healthcare, Chicago, IL). The column was washed with 50 mM Tris‐HCl (pH 7.5), 100 mM NaCl, 30 mM imidazole, 1 mM dithiothreitol, P1‐ His6 eluted by 300 mM imidazole in the same buffer and fractions containing that protein pooled and dialyzed against 50 mM Tris‐HCl (pH 7.5), 100 mM NaCl, 0.5 mM EDTA and 2 mM dithiothreitol (TNED). Supernatants containing CheA P3‐P4‐P5 were applied to the QAE ion‐exchange column Shodex QA‐825 (Showa Denko, Tokyo, Japan) attached to an HPLC system (Gilson, Middleton, WI), a gradient of 0 to 0.8 M NaCl in 50 mM Tris‐HCl (pH 7.5) applied and selected fractions containing P3‐P4‐P5 and minimal contaminants pooled and dialyzed against TNED. Protein concentrations were determined by quantitative immunoblots using purified standards for the respective proteins with concentrations determined by quantitative amino acid analysis.
Signaling complexes
Mixtures of 5 µM CheW, 2 µM P3‐P4‐P5 and 10 µM chemoreceptor Tar‐6H in different modification states, inserted in Nanodiscs or in native membrane vesicles, were incubated and processed as described.7, 26 For Nanodisc‐based core complexes, the resulting signaling complexes were separated from free P3‐P4‐P5 with a Ni‐NTA column.7, 26 For native‐membrane‐based small arrays of core complexes, separation was performed by two rounds of centrifugation and suspension in a solution with no P3‐P4‐P5.33 Amounts of P3‐P4‐P5 incorporated into signaling complexes were determined by quantitative immunoblotting as described above.
Kinase assays
Kinase activity was assayed essentially as described.7 P3‐P4‐P5 alone or in signaling complexes was incubated 15 min at room temperature in TNED plus 50 mM KCl and 5 mM MgCl2 without or with aspartate. Reactions were initiated by addition of [γ‐32P] ATP and terminated by addition of 4X SDS sample buffer (80 mM Tris, 32 mM NaH2PO4, pH 7.8, 4% (w/v) SDS, 80 mM dithiothreitol, 20 mM EDTA, 0.012% (w/v) Bromphenol Blue, 40% (w/v) glycerol) containing 20 mM EDTA at 15 s for Tar‐QEQE and Tar‐QQQQ or 60 s for Tar‐EEEE (Supporting Information Fig. S2). Samples were applied to a SDS‐PAGE gel and 32P‐P1 quantified by phosphorimaging and Image Gauge analysis software.
Calculating kcat
Apparent catalytic rate constants determined by varying one substrate (ATP or P1) with the other substrate (P1 or ATP) constant at a sub‐saturating concentration were necessarily lower than k cat, the turnover number of the kinase at saturation for both substrates. The Michaelis–Menten equation ( ) was used to calculate k cat values at saturation of both substrates from each apparent catalytic rate constant determined experimentally. Those values are shown in the figures and tables, and cited in the text.
Local concentration of tethered P1 for intact CheA
Following the lead of Greenswag et al.,23 we calculated an approximate operational concentration of tethered P1 in intact CheA by assuming a Gaussian chain model and utilizing the Jacobson‐Stockmayer factor that estimates the concentration of one end of a flexible chain in the vicinity of the other. That factor is:
where C n is the Flory characteristic ratio, n the number of links in the chain and l the chain unit length. Using the poly‐L‐alanine C n of 9.5, n = 60 which represents the sum of residues in the P1‐P2 and P2‐P3 linkers plus one residue distance between the position of the N‐ and C‐ termini of P2, and 3.8 Å for the unit length, we calculated an estimated operational concentration of tethered P1 of ∼730 µM.
Supporting information
Supporting Information Figure 1.
Supporting Information Figure 3.
Supporting Information Figure 3.
Supporting Information Figure 4.
Acknowledgments
We thank Angela Lilly for designing the primers for the N‐terminus His‐tag deletion of pET28a carrying CheA [261‐654]. W. P. thanks everyone in the Membrane Group for help and support, especially Mingshan Li and Wing‐Cheung Lai for their lessons and suggestions on experimental designs.
Conflict of Interest Statement: There is no conflict of interest to declare.
Statement: The essence of sensory signaling in bacterial chemotaxis is control of the autophosphorylating histidine kinase CheA. Yet, the enzymatic properties targeted by these controls have been largely undefined. We found that both activation and inhibition of kinase activity in chemotaxis signaling complexes are controlled via the enzymatic active site, not substrate affinity or availability of a tethered, phosphoryl‐accepting kinase domain. These observations could be relevant to understanding control of many two‐component signaling kinases.
References
- 1. Hazelbauer GL, Falke JJ, Parkinson JS (2008) Bacterial chemoreceptors: high‐performance signaling in networked arrays. Trends Biochem Sci 33:9–19. [DOI] [PMC free article] [PubMed] [Google Scholar]
- 2. Hazelbauer GL, Lai W‐C (2010) Bacterial chemoreceptors: providing enhanced features to two‐component signaling. Curr Opin Microbiol 13:124–132. [DOI] [PMC free article] [PubMed] [Google Scholar]
- 3. Sourjik V, Wingreen NS (2012) Responding to chemical gradients: bacterial chemotaxis. Curr Opin Cell Biol 24:262–268. [DOI] [PMC free article] [PubMed] [Google Scholar]
- 4. Parkinson JS, Hazelbauer GL, Falke JJ (2015) Signaling and sensory adaptation in Escherichia coli chemoreceptors: 2015 update. Trends Microbiol 23:257–266. [DOI] [PMC free article] [PubMed] [Google Scholar]
- 5. Borkovich KA, Kaplan N, Hess JF, Simon MI (1989) Transmembrane signal transduction in bacterial chemotaxis involves ligand‐dependent activation of phosphate group transfer. Proc Natl Acad Sci USA 86:1208–1212. [DOI] [PMC free article] [PubMed] [Google Scholar]
- 6. Ninfa EG, Stock A, Mowbray S, Stock J (1991) Reconstitution of the bacterial chemotaxis signal transduction system from purified components. J Biol Chem 266:9764–9770. [PubMed] [Google Scholar]
- 7. Li M, Hazelbauer GL (2011) Core unit of chemotaxis signaling complexes. Proc Natl Acad Sci USA 108:9390–9395. [DOI] [PMC free article] [PubMed] [Google Scholar]
- 8. Park C, Dutton DP, Hazelbauer GL (1990) Effects of glutamines and glutamates at sites of covalent modification of a methyl‐accepting transducer. J Bacteriol 172:7179–7187. [DOI] [PMC free article] [PubMed] [Google Scholar]
- 9. Dunten P, Koshland DE Jr (1991) Tuning the responsiveness of a sensory receptor via covalent modification. J Biol Chem 266:1491–1496. [PubMed] [Google Scholar]
- 10. Amin DN, Hazelbauer GL (2010) Chemoreceptors in signalling complexes: shifted conformation and asymmetric coupling. Mol Microbiol 78:1313–1323. [DOI] [PMC free article] [PubMed] [Google Scholar]
- 11. Dutta R, Qin L, Inouye M (1999) Histidine kinases: diversity of domain organization. Mol Microbiol 34:633–640. [DOI] [PubMed] [Google Scholar]
- 12. Gegner JA, Dahlquist FW (1991) Signal transduction in bacteria: CheW forms a reversible complex with the protein kinase CheA. Proc Natl Acad Sci USA 88:750–754. [DOI] [PMC free article] [PubMed] [Google Scholar]
- 13. Surette MG, Levit M, Liu Y, Lukat G, Ninfa EG, Ninfa A, Stock JB (1996) Dimerization is required for the activity of the protein histidine kinase CheA that mediates signal transduction in bacterial chemotaxis. J Biol Chem 271:939–945. [DOI] [PubMed] [Google Scholar]
- 14. Bilwes AM, Alex LA, Crane BR, Simon MI (1999) Structure of CheA, a signal‐transducing histidine kinase. Cell 96:131–141. [DOI] [PubMed] [Google Scholar]
- 15. Briegel A, Li X, Bilwes AM, Hughes KT, Jensen GJ, Crane BR (2012) Bacterial chemoreceptor arrays are hexagonally packed trimers of receptor dimers networked by rings of kinase and coupling proteins. Proc Natl Acad Sci USA 109:3766–3771. [DOI] [PMC free article] [PubMed] [Google Scholar]
- 16. Liu J, Hu B, Morado DR, Jani S, Manson MD, Margolin W (2012) Molecular architecture of chemoreceptor arrays revealed by cryoelectron tomography of Escherichia coli minicells. Proc Natl Acad Sci USA 109:E1481–E1488. [DOI] [PMC free article] [PubMed] [Google Scholar]
- 17. McEvoy MM, Dahlquist FW (1997) Phosphohistidines in bacterial signaling. Curr Opin Struct Biol 7:793–797. [DOI] [PubMed] [Google Scholar]
- 18. McEvoy MM, de la Cruz AF, Dahlquist FW (1997) Large modular proteins by NMR. Nat Struct Biol 4:9. [DOI] [PubMed] [Google Scholar]
- 19. Levit M, Liu Y, Surette M, Stock J (1996) Active site interference and asymmetric activation in the chemotaxis protein histidine kinase CheA. J Biol Chem 271:32057–32063. [DOI] [PubMed] [Google Scholar]
- 20. Swanson RV, Schuster SC, Simon MI (1993) Expression of CheA fragments which define domains encoding kinase, phosphotransfer, and CheY binding activities. Biochemistry 32:7623–7629. [DOI] [PubMed] [Google Scholar]
- 21. Garzon A, Parkinson JS (1996) Chemotactic signaling by the P1 phosphorylation domain liberated from the CheA histidine kinase of Escherichia coli . J. Bacteriol 178:6752–6758. [DOI] [PMC free article] [PubMed] [Google Scholar]
- 22. Levit MN, Liu Y, Stock JB (1999) Mechanism of CheA protein kinase activation in receptor signaling complexes. Biochemistry 38:6651–6658. [DOI] [PubMed] [Google Scholar]
- 23. Greenswag AR, Muok A, Li X, Crane BR (2015) Conformational transitions that enable histidine kinase autophosphorylation and receptor array integration. J Mol Biol 427:3890–3907. [DOI] [PMC free article] [PubMed] [Google Scholar]
- 24. Williamson M (2012) How proteins work. USA: Garland Science, pp 130. [Google Scholar]
- 25. Boldog T, Grimme S, Li M, Sligar SG, Hazelbauer GL (2006) Nanodiscs separate chemoreceptor oligomeric states and reveal their signaling properties. Proc Natl Acad Sci USA 103:11509–11514. [DOI] [PMC free article] [PubMed] [Google Scholar]
- 26. Li M, Hazelbauer GL (2014) Selective allosteric coupling in core chemotaxis signaling complexes. Proc Natl Acad Sci USA 111:15940–15945. [DOI] [PMC free article] [PubMed] [Google Scholar]
- 27. Briegel A, Wong ML, Hodges HL, Oikonomou CM, Piasta KN, Harris MJ, Fowler DJ, Thompson LK, Falke JJ, Kiessling LL, Jensen GJ (2014) New insights into bacterial chemoreceptor array structure and assembly from electron cryotomography. Biochemistry 53:1575–1585. [DOI] [PMC free article] [PubMed] [Google Scholar]
- 28. Borkovich KA, Simon MI (1990) The dynamics of protein phosphorylation in bacterial chemotaxis. Cell 63:1339–1348. [DOI] [PubMed] [Google Scholar]
- 29. Borkovich KA, Alex LA, Simon MI (1992) Attenuation of sensory receptor signaling by covalent modification. Proc Natl Acad Sci USA 89:6756–6760. [DOI] [PMC free article] [PubMed] [Google Scholar]
- 30. Morrison TB, Parkinson JS (1997) A fragment liberated from the Escherichia coli CheA kinase that blocks stimulatory, but not inhibitory, chemoreceptor signaling. J Bacteriol 179:5543–5550. [DOI] [PMC free article] [PubMed] [Google Scholar]
- 31. Bornhorst JA, Falke JJ (2001) Evidence that both ligand binding and covalent adaptation drive a two‐state equilibrium in the aspartate receptor signaling complex. J Gen Physiol 118:693–710. [DOI] [PMC free article] [PubMed] [Google Scholar]
- 32. Lai R‐Z, Manson JMB, Bormans AF, Draheim RR, Nguyen NT, Manson MD (2005) Cooperative signaling among bacterial chemoreceptors. Biochemistry 44:14298–14307. [DOI] [PubMed] [Google Scholar]
- 33. Erbse AH, Falke JJ (2009) The core signaling proteins of bacterial chemotaxis assemble to form an ultrastable complex. Biochemistry 48:6975–6987. [DOI] [PMC free article] [PubMed] [Google Scholar]
- 34. Li G, Weis RM (2000) Covalent modification regulates ligand binding to receptor complexes in the chemosensory system of Escherichia coli . Cell 100:357–365. [DOI] [PubMed] [Google Scholar]
- 35. Wylie D, Stock A, Wong CY, Stock J (1988) Sensory transduction in bacterial chemotaxis involves phosphotransfer between Che proteins. Biochem Biophys Res Commun 151:891–896. [DOI] [PubMed] [Google Scholar]
- 36. Tawa P, Stewart RC (1994) Kinetics of CheA autophosphorylation and dephosphorylation reactions. Biochemistry 33:7917–7924. [DOI] [PubMed] [Google Scholar]
- 37. Francis NR, Wolanin PM, Stock JB, DeRosier DJ, Thomas DR (2004) Three‐dimensional structure and organization of a receptor/signaling complex. Proc Natl Acad Sci USA 101:17480–17485. [DOI] [PMC free article] [PubMed] [Google Scholar]
- 38. Hamel DJ, Zhou H, Starich MR, Byrd RA, Dahlquist FW (2006) Chemical‐shift‐perturbation mapping of the phosphotransfer and catalytic domain interaction in the histidine autokinase CheA from Thermotoga maritima. Biochemistry 45:9509–9517. [DOI] [PubMed] [Google Scholar]
- 39. Briegel A, Ames P, Gumbart JC, Oikonomou CM, Parkinson JS, Jensen GJ (2013) The mobility of two kinase domains in the Escherichia coli chemoreceptor array varies with signalling state. Mol Microbiol 89:831–841. [DOI] [PMC free article] [PubMed] [Google Scholar]
- 40. Yaginuma H, Kawai S, Tabata KV, Tomiyama K, Kakizuka A, Komatsuzaki T, Noji H, Imamura H (2014) Diversity in ATP concentrations in a single bacterial cell population revealed by quantitative single‐cell imaging. Sci Rep 4:6522. [DOI] [PMC free article] [PubMed] [Google Scholar]
- 41. Cassidy CK, Himes BA, Alvarez FJ, Ma J, Zhao G, Perilla JR, Schulten K, Zhang P (2015) CryoEM and computer simulations reveal a novel kinase conformational switch in bacterial chemotaxis signaling. eLife 4:e08419. [DOI] [PMC free article] [PubMed] [Google Scholar]
- 42. Denisov IG, Grinkova YV, Lazarides AA, Sligar SG (2004) Directed self‐assembly of monodisperse phospholipid bilayer nanodiscs with controlled size. J Am Chem Soc 126:3477–3487. [DOI] [PubMed] [Google Scholar]
- 43. Barnakov AN, Barnakova LA, Hazelbauer GL (1998) Comparison in vitro of a high‐ and a low‐abundance chemoreceptor of Escherichia coli: similar kinase activation but different methyl‐accepting activities. J Bacteriol 180:6713–6718. [DOI] [PMC free article] [PubMed] [Google Scholar]
- 44. Parkinson JS, Houts SE (1982) Isolation and behavior of Escherichia coli deletion mutants lacking chemotaxis functions. J Bacteriol 151:106–113. [DOI] [PMC free article] [PubMed] [Google Scholar]
- 45. Amin DN, Hazelbauer GL (2010) The chemoreceptor dimer is the unit of conformational coupling and transmembrane signaling. J Bacteriol 192:1193–1200. [DOI] [PMC free article] [PubMed] [Google Scholar]
- 46. Lai W‐C, Hazelbauer GL (2005) Carboxyl‐terminal extensions beyond the conserved pentapeptide reduce rates of chemoreceptor adaptational modification. J Bacteriol 187:5115–5121. [DOI] [PMC free article] [PubMed] [Google Scholar]
- 47. Boldog T, Li M, Hazelbauer GL (2007) Using Nanodiscs to create water‐soluble transmembrane chemoreceptors inserted in lipid bilayers. Methods Enzymol 423:317–335. [DOI] [PubMed] [Google Scholar]
- 48. Mo G, Zhou H, Kawamura T, Dahlquist FW (2012) Solution structure of a complex of the histidine autokinase CheA with its substrate CheY. Biochemistry 51:3786–3798. [DOI] [PMC free article] [PubMed] [Google Scholar]
Associated Data
This section collects any data citations, data availability statements, or supplementary materials included in this article.
Supplementary Materials
Supporting Information Figure 1.
Supporting Information Figure 3.
Supporting Information Figure 3.
Supporting Information Figure 4.