Abstract
The globiferous pedicellariae of the venomous sea urchin Toxopneustes pileolus contains several biologically active proteins. We have cloned the cDNA of one of the toxin components, SUL‐I, which is a rhamnose‐binding lectin (RBL) that acts as a mitogen through binding to carbohydrate chains on target cells. Recombinant SUL‐I (rSUL‐I) was produced in Escherichia coli cells, and its carbohydrate‐binding specificity was examined with the glycoconjugate microarray analysis, which suggested that potential target carbohydrate structures are galactose‐terminated N‐glycans. rSUL‐I exhibited mitogenic activity for murine splenocyte cells and toxicity against Vero cells. The three‐dimensional structure of the rSUL‐I/l‐rhamnose complex was determined by X‐ray crystallographic analysis at a 1.8 Å resolution. The overall structure of rSUL‐I is composed of three distinctive domains with a folding structure similar to those of CSL3, a RBL from chum salmon (Oncorhynchus keta) eggs. The bound l‐rhamnose molecules are mainly recognized by rSUL‐I through hydrogen bonds between its 2‐, 3‐, and 4‐hydroxy groups and Asp, Asn, and Glu residues in the binding sites, while Tyr and Ser residues participate in the recognition mechanism. It was also inferred that SUL‐I may form a dimer in solution based on the molecular size estimated via dynamic light scattering as well as possible contact regions in its crystal structure.
Keywords: lectin, rhamnose, sea urchin, toxin, X‐ray crystallographic analysis
Short abstract
PDB Code(s): 5H4S
Abbreviations
- DLS
dynamic light scattering
- MTT
3‐(4,5‐dimethyl thiazol‐2‐yl)‐2,5‐diphenyl tetrazolium bromide
- PA
pyridylamino
- RBL
rhamnose‐binding lectin
- RMSD
root‐mean‐square‐deviation
- TBS
Tris‐buffered saline.
Introduction
Various marine invertebrates possess diverse biologically active materials. They have been major resources for the development of medicines and other useful substances. The globiferous pedicellariae of the venomous sea urchin Toxopneustes pileolus contains several biologically active proteins. Among them, SUL‐I is a galactose‐binding lectin with mitogenic, chemotactic, and cytotoxic activity.1, 2, 3 We have cloned the cDNA encoding SUL‐I by reverse transcription‐PCR using degenerate primers designed based on the N‐terminal amino acid sequence of the protein. The mature protein of 284 residues (30,489 Da) is composed of three repetitive sequence regions, each showing similarity with the carbohydrate‐recognition domains of rhamnose‐binding lectins (RBLs), mostly found in fish eggs.4, 5 The recombinant SUL‐I (rSUL‐I) was expressed in Escherichia coli cells using an expression vector, and purified using a carbohydrate‐immobilized affinity column in an active form after refolding from inclusion bodies. The carbohydrate‐binding ability of rSUL‐I was confirmed with the hemagglutination assay. The ability to agglutinate erythrocytes suggests that the lectin molecule contains more than one carbohydrate‐binding site, thus being able to cross‐link carbohydrates on cell surfaces. The binding specificity of rSUL‐I was also examined using carbohydrate‐conjugated polyamidoamine (PAMAM) dendrimer (sugar‐PAMAM dendrimer), which revealed that SUL‐I has the highest affinity for l‐rhamnose, followed by lactose, among the simple carbohydrates tested.6
Although SUL‐I shares sequence homology with RBLs, the biological functions of this family of lectins are yet to be elucidated. Given that these lectins have mostly been found in fish eggs, they are likely to be involved in self‐defense against invading microorganisms. Among RBLs, only the crystal structure of the chum salmon (Oncorhynchus keta) lectin CSL3 has been solved.7 CSL3 has a homodimeric structure, in which one protomer is composed of two domains, each bearing a carbohydrate‐binding site. By associating into a dimer, the lectin acquires a pseudo‐tetrameric structure, in which the four domains are outward‐oriented. This is probably advantageous to recognize and cross‐link specific carbohydrate chains on susceptible cells.
In the present study, we have assessed the biological activities of rSUL‐I by mitogenic as well as toxicity assays, and further extended the analysis of the carbohydrate‐binding properties of rSUL‐I to complex carbohydrate chains using the glycoconjugate microarray analysis. The structural features of rSUL‐I and its carbohydrate‐recognition mode were also elucidated by X‐ray crystallographic analysis of the rSUL‐I/l‐rhamnose complex.
Results and Discussion
Biological activity of SUL‐I
SUL‐I has been shown to have mitogenic, chemotactic, and phagocytic activities, as well as to be cytotoxic for various cells.1 These activities are assumed to be triggered by binding of the lectin to specific carbohydrate chains on target cells. To examine whether rSUL‐I can exert such biological activities, its mitogenic activity was evaluated by the MTT assay using murine splenocytes. As shown in Figure 1, when cells were incubated with 1–5 μg/mL rSUL‐I, a dose‐dependent increase in mitogenic proliferation was observed with up to 3 μg/mL of the lectin, whereas proliferation decreased at concentrations higher than 3 μg/mL, indicating that rSUL‐I exhibits cytotoxicity at relatively high concentrations, probably by inducing apoptosis.1 This effect is very similar to that of native SUL‐I purified from sea urchin, confirming that the recombinant protein prepared here exerts a biological activity toward murine splenocytes similar to that of its native counterpart. As shown in Figure 2, the cytotoxicity of rSUL‐I was also examined by colony formation assay using Vero cells. After 6 days, rSUL‐I displayed a cytotoxic effect at concentrations higher than 10 μg/mL.
Figure 1.

Mitogenic activity of rSUL‐I and native SUL‐I on murine splenocytes. Data show the mean ± SD of three experiments with determinations in triplicate.
Figure 2.
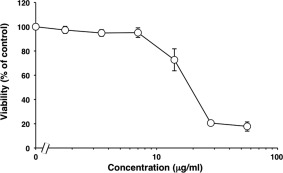
Cytotoxicity of rSUL‐I for Vero cells. Cytotoxicity was measured with the inhibition of colony formation method. Each point represents an average of triplicate measurements.
Binding specificity of rSUL‐I for various oligosaccharides
We have previously reported that rSUL‐I produced by E. coli cells shows hemagglutinating activity toward rabbit erythrocytes at concentrations as low as 3.1 μg/mL, indicating that SUL‐I has more than one carbohydrate‐binding site per molecule.6 Its carbohydrate‐binding specificity for several simple carbohydrates was assessed by the sugar‐polyamidoamine (PAMAM) dendrimer assay, which we have developed using a water‐soluble, highly branched PAMAM bearing multiple carbohydrate moieties.8 The results indicated that rSUL‐I bound to l‐rhamnose with the highest affinity among the simple carbohydrates tested, and to other galactose‐containing carbohydrates with moderate affinity. The study also indicated that β‐galactosides were preferred to α‐galactosides.6 In this study, to examine in more detail the binding specificity of SUL‐I for complex oligosaccharides, we have conducted a glycoconjugate microarray analysis9 as well as a frontal affinity chromatography analysis.10, 11 As shown in Figure 3 and Supporting Information Table S1, the glycoconjugate microarray analysis revealed that rSUL‐I has higher affinity for glycoproteins having complex‐type N‐glycans, such as fetuin, α1‐acid glycoprotein, transferrin, and porcine thyroglobulin, besides smaller galactose‐containing conjugates (Nos. 65, 79, 80, 81, and 82). Higher affinity was observed for desialylated complex‐type N‐glycans (Nos. 43, 44, 45, and 46) compared with the corresponding sialylated ones (Nos. 25, 26, 27, and 28), suggesting that rSUL‐I preferably recognizes terminal galactose residues that are exposed by the elimination of terminal sialic acids. These results suggest that the natural target ligands for SUL‐I are most likely glycoproteins with terminal β‐galactose residues; glycolipids with α‐galactose residues also show significant affinity. Although l‐rhamnose was found to bind with the highest affinity in our previous study,6 rhamnose‐α1‐acrylamide (No. 92) showed relatively weak affinity in the present glycoconjugate microarray analysis (Fig. 3). This may be because monosaccharides generally show lower affinity compared with branched glycans that can bind at multiple sites, leading to increased avidity for the lectin. It is noteworthy that rSUL‐I exhibited almost no affinity for terminal N‐acetylgalactosamine (GalNAc)‐containing glycans (Nos. 8, 31, 39, 40, 41, 42, 58, and 63; Supporting Information Fig. S1) in contrast to the majority of galactose‐recognizing lectins that exhibit affinity for GalNAc as well. This may be due to the characteristic carbohydrate‐recognition mode of SUL‐I, in which the 4‐hydroxy group of l‐rhamnose, corresponding to the 2‐hydroxy group of d‐galactose in the configuration of hydroxyl groups, is recognized by a hydrogen bond with a glutamate residue (Glu7, Glu104, or Glu199) of the lectin.4 Thus, the presence of an acetamido group at the C‐2 of GalNAc may disrupt this hydrogen bond.
Figure 3.
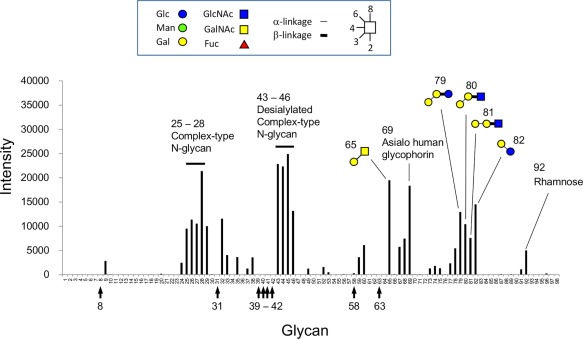
Glycoconjugate microarray analysis of rSUL‐I. The binding specificities of Cy3‐labeled rSUL‐I for various glycoconjugates were measured. The vertical arrows indicate glycoconjugates containing terminal GalNAc residues (Supporting Information Figure S1). All of the glycoconjugate structures used in this analysis are listed in Ref. 26.
The N‐glycan structures preferred by rSUL‐I for binding were further examined by frontal affinity chromatography as shown in Figure 4 and Supporting Information Figure S2. As seen in Figure 4, higher affinity for the galactosylated (asialylated) N‐glycans Nos. 313, 323, 410, and 418 was observed; their association constants for rSUL‐I binding are very similar (K a = 3.1 × 10⁴ – 3.3 × 10⁴ M−1), suggesting that the lectin recognizes the three‐branched N‐acetyllactosamine (Galβ1‐4GlcNAc) structure common to these N‐glycans. Although these results confirmed the preferential binding of rSUL‐I to β‐galactoside structures, the highest affinity determined in this analysis was for Gb3 (No. 715, Galα1‐4Galβ1‐4Glc, K a = 5.0 × 10⁴ M−1). This resembles the O. keta lectins CSL1, CSL2, and CSL3, although they exhibit exclusive binding to Gb3.12 While rSUL‐I adopts a domain fold very similar to that of CSL3, a conspicuous structural difference was found around the carbohydrate‐binding sites as described below, in a variable loop that may interact with the extended portions of bound oligosaccharides. The differences between these lectins in the binding specificities for oligosaccharides may be based on these loop regions.
Figure 4.
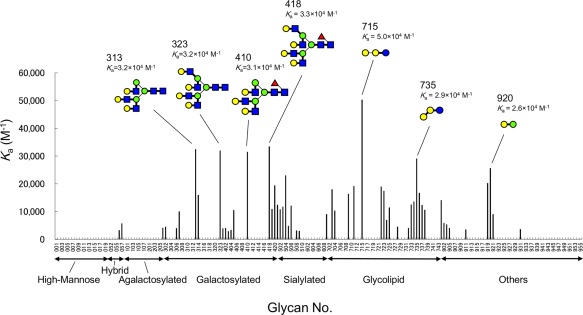
Frontal affinity chromatography analysis for the binding of rSUL‐I to PA‐labeled oligosaccharides. Association constants (K a) were calculated for 130 PA‐oligosaccharides. The structures of the PA‐oligosaccharides27 are shown in Supporting Information Figure S2. The marks representing the structures in this figure are the same as in Figure 3.
Three‐dimensional structural analysis of rSUL‐I and its carbohydrate recognition mode
Crystallization conditions for rSUL‐I and its l‐rhamnose‐complex were initially screened using commercial crystallization screening kits as described in Materials and Methods. While crystals have not been obtained from rSUL‐I without the carbohydrate, its l‐rhamnose‐complex was successfully crystallized using the reservoir solution composed of 0.2M Li2SO4, 0.1M phosphate‐citrate, pH 4.2, 20% (w/v) PEG 1000, 0.05% (w/v) n‐dodecyl‐β‐d‐maltoside at 20°C, and X‐ray diffraction data were collected at a resolution of 1.8 Å. Statistics of data collection and refinement parameters are summarized in Supporting Information Table S2. The space group of the rSUL‐I/l‐rhamnose crystal was C2 with a unit cell dimensions of a = 101.7 Å, b = 44.2 Å, c = 71.8 Å, and β = 124.1°. The asymmetric unit contained one molecule of rSUL‐I, with a corresponding solvent content of 44%. Since we have found that the amino acid sequence of each domain of rSUL‐I shows apparent similarities with those of RBLs, which have mostly been isolated from fish eggs, the initial phasing was performed with the molecular replacement method using the crystal structure of the C‐terminal half domain of CSL3 from chum salmon eggs, which is the sole lectin so far in the RBL family with a known three‐dimensional structure.4, 7 Following the initial phasing, the electron density of an l‐rhamnose molecule bound in each domain could be observed as the refinement proceeded. Thus the model was further refined with bound l‐rhamnose molecules, and the refinement was finally completed with R work = 15.7% and R free = 20.5% (Supporting Information Table S2).
As shown in Figure 5(A), the overall structure of rSUL‐I is composed of three distinctive domains protruding outwards, in which l‐rhamnose molecules are bound around their uppermost parts, indicating that all the domains contain active carbohydrate‐binding sites. A single domain consists of ∼100 amino acid residues, forming similar main‐chain structures, which can be superposed on each other with slight differences (Fig. 6); when superposed with each other, the root‐mean‐square‐deviations (RMSDs) of Cα atoms were calculated to be 1.16 Å (domains 1 and 2), 1.18 Å (domains 2 and 3), and 0.69 Å (domains 1 and 3). On the other hand, the overall structure of CSL3 is quite different from that of rSUL‐I [Fig. 5(C)], although the main‐chain folds of individual domains are similar between these two lectins. For example, the RMSD between domain 1 of rSUL‐I and the N‐terminal domain of CSL3 is 1.02 Å. CSL3 is a homodimeric lectin composed of two identical subunits, each consisting of two carbohydrate‐binding domains. This pseudo‐tetrameric structure is assumed to be advantageous to bind multiple carbohydrate chains on cell surfaces, inducing cellular responses, such as apoptosis.7 However, SUL‐I has carbohydrate‐binding sites in its three domains, which are oriented towards the same side of the protein, as shown in the side view of Figure 5(A). This structure might be advantageous to cross‐link specific membrane glycoproteins containing galactose‐terminated carbohydrate chains, triggering cellular responses. However, it was also suggested that rSUL‐I may be a dimer in solution since its hydrodynamic radius was estimated to be 39.2 Å via dynamic light scattering (DLS) measurement, which, assuming a globular structure, corresponds to a molecular mass of 83 kDa. The possible dimeric structure of SUL‐I [Fig. 5(B)] was further suggested by the protein quaternary analysis on the PISA software,13 in which domain 1 and domain 2 from the neighboring molecules in the crystal could strongly interact to dimerize via 8 hydrogen bonds and 10 salt bridges, yielding an interface area of 1161 Å2. In this dimeric structure, two monomers from the asymmetric units in the crystal were related to the crystallographic 2‐fold symmetry. Such a dimeric form of SUL‐I would further strengthen cross‐linking of cell surface carbohydrate chains because of increased avidity. Figure 7(A–C) show the carbohydrate‐binding sites of the three domains of rSUL‐I. In domain 1, bound l‐rhamnose forms hydrogen bonds with Glu7, Asn71, and Asp76 at the 4‐, 3‐, and 2‐hydroxy groups, which correspond to the 2‐, 3‐, and 4‐hydroxy groups of d‐galactose bound in the same orientation [Fig. 7(D)]. This binding mode is common to all the three sites; Glu104/199, Asn171/263, and Asp176/268 form hydrogen bonds with the 2‐, 3‐, and 4‐hydroxy groups of l‐rhamnose, respectively. As shown in Figure 8, the residues in CSL3 corresponding to these three residues in SUL‐I (enclosed in black boxes) are also conserved in both its N‐ and C‐terminal domains. In addition to these hydrogen bonds, bound l‐rhamnose makes contact with close amino acid side chains. As shown in Figure 9, the C‐6 of l‐rhamnose makes van der Waals contact with Tyr82 or Ser140 in domains 1 and 2, the former of which also stacks with His38 on its opposite face, while the distance between l‐rhamnose and Asn232 is somewhat larger in the binding site of domain 3 [Fig. 9(C)]. In the case of CSL3, van der Waals contacts between the C‐6 of l‐rhamnose and the binding site residues also seem to contribute to their interaction [Fig. 9(D)]. The van der Waals interactions between the C‐6 and the binding site residues may be responsible for the higher affinity of RBLs for l‐rhamnose in comparison to galactose. Despite the conserved residues in the carbohydrate‐binding sites recognizing the 2‐, 3‐, and 4‐hydroxy groups of l‐rhamnose, the loop regions around residues 39–43 and 139–143 of CSL3 (Fig. 8) were found to be important for recognition of Gb3.7 In particular, the 6‐ hydroxyl group of the second galactose moiety (βGal) of Gb3 forms a hydrogen bond with Arg39, and Gln43 also has weak van der Waals interactions with the C‐3 and C‐4 atoms of this galactose moiety (Fig. 10, right). These interactions may be reflected in the very high specificity of CSL3 for Gb3. 12 However, rSUL‐I lacks these residues (enclosed in red boxes in Fig. 8) and appears to have the ability to accommodate oligosaccharide chains larger than CSL3 (Fig. 10). These structural characteristics of the carbohydrate‐binding site seem to be closely related to the much broader specificity of rSUL‐I for the glycans, especially for branched β‐galactoside‐terminated N‐glycans (Fig. 4). Variations in sequence and length of these regions are also seen among other RBL family proteins. Although the receptors triggering responses to SUL‐I have yet to be identified, their structures are likely to be very important to direct this lectin to its target glycoconjugates localized on cells.
Figure 5.
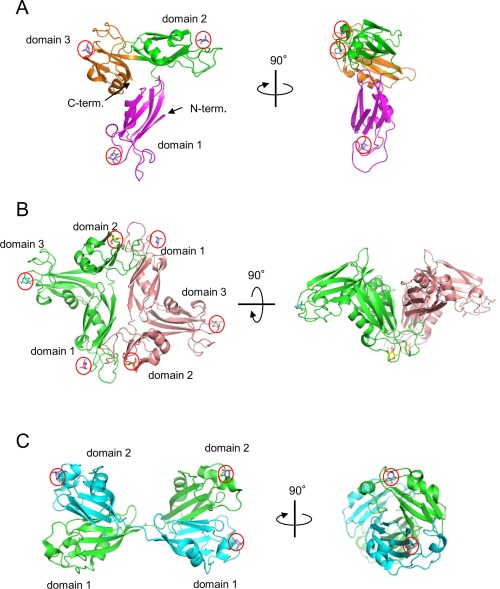
Overall structures of the rSUL‐I/l‐rhamnose monomer (A) rSUL‐I/L‐rhamnose dimer (B), and CSL3/l‐rhamnose (C). A, the three domains of rSUL‐I are colored differently. B and C, the two polypeptides of rSUL‐I dimer and CSL3 (PDB ID: 2ZX2) are depicted in different colors. Bound l‐rhamnose molecules (marked by red circles) are depicted as stick models.
Figure 6.
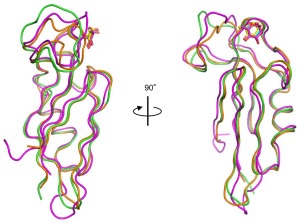
Superposition of the main‐chain structures of the three domains of rSUL‐I. Domains 1 (residues 1–93), 2 (residues 94–191), and 3 (residues 192–284) are shown in green, pink, and orange, respectively.
Figure 7.
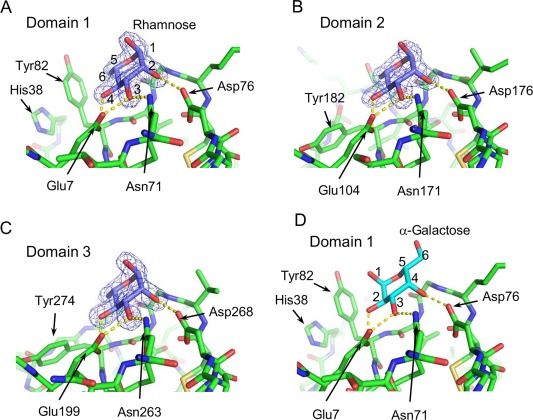
Structure of the three carbohydrate‐binding sites of rSUL‐I. Bound l‐rhamnose and the residues involved in its recognition in domains 1, 2, and 3 are shown in A, B, and C, respectively. The 2F o‐F c electron density maps of l‐rhamnose are contoured at 1.5σ. Panel D shows the putative galactose‐binding mode, depicted by substituting d‐galactose to l‐rhamnose in domain 1.
Figure 8.

Amino acid sequence alignments of the domains of SUL‐I and CSL3. The residues involved in carbohydrate‐recognition are enclosed in boxes. For CSL3, the residues interacting with Gb3 are marked by red boxes. The variable loop region, which varies in length among RBLs, is indicated by a red line. Asterisks, colons, and periods indicate the positions of identical, strongly similar, and weakly similar residues, respectively.
Figure 9.

Interactions between the C‐6 atom of l‐rhamnose and the residues in the three binding sites of rSUL‐I (A, B, and C) and in the N‐terminal half domain of CSL3 (D) (PDB ID: 2ZX2). The van der Waals radii of l‐rhamnose and the involved residues are indicated by dots.
Figure 10.
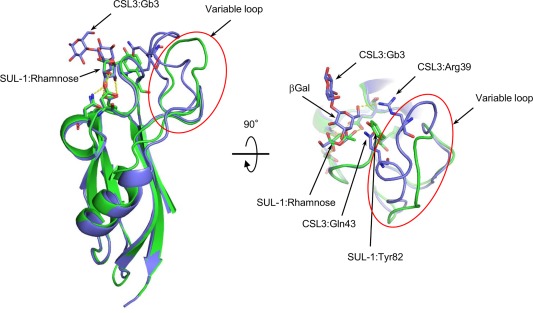
Comparison of the structures of the rSUL‐I/l‐rhamnose and CSL3/Gb3 complexes (PDB ID: 2ZX4). The crystal structures of domain 1 of the rSUL‐I/l‐rhamnose complex (green) and the N‐terminal domain of the CSL3/Gb3 complex (blue) are superposed. The variable loops are enclosed by a red line. Hydrogen bonds are indicated by yellow dashed lines. The second β‐galactoside moiety of Gb3 was labeled as βGal.
Materials and Methods
Expression and purification of rSUL‐I
E. coli BL21‐codonplus (DE3)‐RIPL cells (Novagen) were transformed with the pET‐3a plasmid (Novagen) containing the SUL‐I gene,6 and expression of the protein was induced with 0.4 mM isopropylthiogalactoside. The recombinant proteins were obtained as inclusion bodies after cell disruption by sonication, and they were subsequently solubilized in solubilization buffer (50 mM Tris–HCl, pH 8.0; 0.2M NaCl; 1 mM ethylenediamine tetraacetate; 6M guanidine hydrochloride) and refolded in refolding buffer (0.1M Tris–HCl, pH 8.0; 0.4M l‐arginine; 2 mM ethylenediamine tetraacetate; 5 mM reduced glutathione; 0.5 mM oxidized glutathione). After dialysis of the refolded proteins in Tris‐buffered saline (TBS; 10 mM Tris–HCl, pH 7.5; 0.15M NaCl), rSUL‐I was purified by affinity chromatography using the lactose‐Cellufine column (3 × 10 cm) in TBS. Elution of the bound protein was performed with TBS containing 0.1M l‐rhamnose. The eluted rSUL‐I was dialyzed against TBS to remove l‐rhamnose for further analyses.
Mitogenic activity of SUL‐I
Mitogenic activity on murine splenocytes was determined by the cell culture assay using 3‐(4,5‐dimethyl thiazol‐2‐yl)‐2,5‐diphenyl tetrazolium bromide (MTT; Sigma).14 Splenocytes were collected from female ddY mice and suspended in RPMI‐1640 medium supplemented with penicillin and streptomycin (100 μg/mL and 100 U/mL, respectively). Splenocytes (5 × 10⁶ cells per mL) and the lectin were plated in flat‐bottomed microplates and incubated at 37°C in humidified atmosphere containing 5% CO2 for 68 h. A total of 10 μL of MTT tetrazolium salt solution (5 mg/mL) were then added to each well, and the formazan in the cells was extracted with 10% SDS after 4 h. The absorbance of each well was measured spectrophotometrically using a microplate reader (Bio‐Rad Lab., Model 680, Tokyo, Japan) at 570 nm. The measurements were performed with rSUL‐I as well as with native SUL‐I, which had been purified from T. pileolus samples according to the previously reported method.15
Cytotoxicity of SUL‐I
Vero (African green monkey kidney) cells (American Type Culture Collection) were grown as a monolayer in α‐minimal essential medium supplemented with 10% fetal bovine serum, penicillin (100 U/mL), and streptomycin (100 μg/mL). The cytotoxicity of the lectin on Vero cells was measured by the inhibition of colony formation method as described previously.16 In brief, adherent cells (150 cells/well) in 48‐well plates were incubated with varying concentrations of the lectin in growth medium at 37°C for 6 days, and the number of colonies formed was subsequently counted after staining with 1% methylene blue in 50% methanol. Clusters of 40 or more cells were considered as colonies.
X‐ray crystallographic analysis of the rSUL‐I/l‐rhamnose complex
The rSUL‐I/l‐rhamnose complex was crystallized with the sitting‐drop vapor diffusion method. The screening was performed using the Crystal Screen 1 and 2 (Hampton Research, Aliso Viejo, CA) and Wizard I and II screening kits (Emerald BioSystems, Bedford, MA). In the initial screening, 1 μL of the protein solution (10 mg/mL) in TBS containing 0.1M l‐rhamnose was mixed with an equal volume of reservoir solution and allowed to equilibrate with 100 μL of the reservoir solution at 20°C. X‐ray diffraction data were collected at −140°C using the Rigaku MicroMax‐007 HF/Raxis IV++ System. Data indexing, integration, and scaling were performed with the CCP417 programs Mosflm18 and SCALA.19 Data collection statistics are summarized in Supporting Information Table S2. The space group of the crystal was C2, and one rSUL‐I molecule per asymmetric unit was estimated. The structure of the SUL‐I/l‐rhamnose complex was determined with the molecular replacement method using the Phaser software,20 using the C‐terminal domain of CSL3 (PDB ID: 2ZX2) as a search model. The model was refined using the Refmac software21 from the CCP4 suite. Manual fitting of the model was performed with the Coot software.22 The quality of the final model was assessed with the Ramachandran plot and the Procheck software.23 Refinement statistics are also summarized in Supporting Information Table S2. The possible assembly of rSUL‐I was analyzed using PISA13 on the Coot software. RMSDs between superposed domain molecules were calculated with the CCP4 program GESAMT.24 All figures illustrating the protein models were prepared with PyMOL.25
Dynamic light scattering
The hydrodynamic radius of rSUL‐I was measured by DLS in TBS at 25°C using a Zetasizer Nano ZS (Malvern Instruments). The value was calculated as an average of 6 measurements.
Glycoconjugate microarray analysis
The binding specificities of rSUL‐I for various glycoconjugates were examined with the glycoconjugate microarray analysis, as described previously.26, 27 In brief, the lectin was labeled with Cy3 and incubated in TBS overnight on a microarray, onto which various glycoconjugates had been immobilized. After washing with TBS, the fluorescence intensity of bound lectins was recorded.
Frontal affinity chromatography
Frontal affinity chromatography was performed using an automated system as previously described.10, 11 Briefly, rSUL‐I was immobilized on N‐hydroxysuccinimide‐activated Sepharose 4B Fast Flow (GE Healthcare). Pyridylamino (PA)‐oligosaccharides were applied to the lectin‐immobilized columns (2.0 × 10 mm, 31.4‐μL column volume) in 10 mM Tris‐HCl (pH 7.4) containing 0.14M NaCl and 10 mM CaCl2, and eluted with a flow rate of 0.125 mL/min at 25°C. The elution of PA‐oligosaccharides was monitored by measuring the fluorescence at 380 nm after excitation at 310 nm. The affinities of PA‐oligosaccharides were evaluated by analyzing the delay of their front of elution using the following equation:
where K a is the association constant, (V − V 0) is the delay of the elution volume, and Bt is the effective ligand content, which is dependent on the amount of immobilized lectin on the column.
Accession number
The atomic coordinates and structure factors of the rSUL‐I/l‐rhamnose complex have been deposited in the Protein Data Bank with the accession number 5H4S.
Supporting information
Supporting Information Figure 1.
Supporting Information Figure 2.
Supporting Information Figure 2A.
Supporting Information Tables.
Acknowledgments
The authors thank Mr. Hidenari Taura for the DLS measurements.
References
- 1. Nakagawa H, Tanigawa T, Tomita K, Tomihara Y, Araki Y, Tachikawa E (2003) Recent studies on the phathological effects of purified sea urchin toxins. J Toxicol 22:633–649. [Google Scholar]
- 2. Takei M, Nakagawa H (2006) A sea urchin lectin, SUL‐1, from the toxopneustid sea urchin induces DC maturation from human monocyte and drives Th1 polirization in vitro. Toxicol Appl Pharmacol 213:27–36. [DOI] [PubMed] [Google Scholar]
- 3. Edo K, Sakai H, Nakagawa H, Hashimoto T, Shinohara M, Ohura K (2012) Immunomodulatory activity of a pedicellarial venom lectin from the toxopneustid sea urchin, Toxopneustes pileolus . Toxin Rev 31:54–60. [Google Scholar]
- 4. Tateno H (2010) SUEL‐related lectins, a lectin family widely distributed throughout organisms. Biosci Biotechnol Biochem 74:1141–1144. [DOI] [PubMed] [Google Scholar]
- 5. Ogawa T, Watanabe M, Naganuma T, Muramoto K (2011) Diversified carbohydrate‐binding lectins from marine resources. J Amino Acids 2011:838914. [DOI] [PMC free article] [PubMed] [Google Scholar]
- 6. Hatakeyama T, Ichise A, Yonekura T, Unno H, Goda S, Nakagawa H (2015) cDNA cloning and characterization of a rhamnose‐binding lectin SUL‐I from the toxopneustid sea urchin Toxopneustes pileolus venom. Toxicon 94:8–15. [DOI] [PubMed] [Google Scholar]
- 7. Shirai T, Watanabe Y, Lee MS, Ogawa T, Muramoto K (2009) Structure of rhamnose‐binding lectin CSL3: unique pseudo‐tetrameric architecture of a pattern recognition protein. J Mol Biol 391:390–403. [DOI] [PubMed] [Google Scholar]
- 8. Hatakeyama T, Karino R, Terai Y, Kimura M, Unno H, Goda S (2012) An assay for carbohydrate‐binding activity of lectins using polyamidoamine dendrimer conjugated with carbohydrates. Biosci Biotechnol Biochem 76:1999–2001. [DOI] [PubMed] [Google Scholar]
- 9. Tateno H (2014) Evaluation of glycan‐binding specificity by glycoconjugate microarray with an evanescent‐field fluorescence detection system. Methods Mol Biol 1200:353–359. [DOI] [PubMed] [Google Scholar]
- 10. Hirabayashi J (2004) Lectin‐based structural glycomics: glycoproteomics and glycan profiling. Glycoconj J 21:35–40. [DOI] [PubMed] [Google Scholar]
- 11. Nakamura S, Yagi F, Totani K, Ito Y, Hirabayashi J (2005) Comparative analysis of carbohydrate‐binding properties of two tandem repeat‐type Jacalin‐related lectins, Castanea crenata agglutinin and Cycas revoluta leaf lectin. FEBS J 272:2784–2799. [DOI] [PubMed] [Google Scholar]
- 12. Watanabe Y, Tateno H, Nakamura‐Tsuruta S, Kominami J, Hirabayashi J, Nakamura O, Watanabe T, Kamiya H, Naganuma T, Ogawa T, Naudé RJ, Muramoto K (2009) The function of rhamnose‐binding lectin in innate immunity by restricted binding to Gb3 . Dev Comp Immunol 33:187–197. [DOI] [PubMed] [Google Scholar]
- 13. Krissinel E, Henrick K (2007) Inference of macromolecular assemblies from crystalline state. J Mol Biol 372:774–797. [DOI] [PubMed] [Google Scholar]
- 14. Nakagawa H, Yamaguchi C, Hayashi H (1997) Biologically active substances from sea urchins. J Nat Toxins 6:193–202. [Google Scholar]
- 15. Nakagawa H, Yamaguchi C, Sakai H, Kanemaru K, Hayashi H, Araki Y, Tomihara Y, Shinohara M, Ohura K, Kitagawa H (1999) Biochemical and physiological properties of pedicellarial lectins from the toxopneustid sea urchins. J Nat Toxins 8:297–308. [PubMed] [Google Scholar]
- 16. Oda T, Tsuru M, Hatakeyama T, Nagatomo H, Muramatsu T, Yamasaki N (1997) Temperature‐ and pH‐dependent cytotoxic effect of the hemolytic lectin CEL‐III from the marine invertebrate Cucumaria echinata on various cell lines. J Biochem 121:560–567. [DOI] [PubMed] [Google Scholar]
- 17. Collaborative Computational Project, Number 4 (1994) The CCP4 suite: programs for protein crystallography. Acta Cryst D50:760–763. [DOI] [PubMed] [Google Scholar]
- 18. Leslie AG (2006) The integration of macromolecular diffraction data. Acta Cryst D62:48–57. [DOI] [PubMed] [Google Scholar]
- 19. Evans P (2006) Scaling and assessment of data quality. Acta Cryst D62:72–82. [DOI] [PubMed] [Google Scholar]
- 20. McCoy AJ, Grosse‐Kunstleve RW, Storoni LC, Read RJ (2005) Likelihood‐enhanced fast translation functions. Acta Cryst D61:458–464. [DOI] [PubMed] [Google Scholar]
- 21. Murshudov GN, Vagin AA, Dodson EJ (1997) Refinement of macromolecular structures by the maximum‐likelihood method. Acta Cryst D53:240–255. [DOI] [PubMed] [Google Scholar]
- 22. Emsley P, Lohkamp B, Scott WG, Cowtan K (2010) Features and development of Coot. Acta Cryst D66:486–501. [DOI] [PMC free article] [PubMed] [Google Scholar]
- 23. Laskowski R, MacArthur M, Moss D, Thornton J (1993) PROCHECK: a program to check the stereochemical quality of protein structures. J Appl Cryst 26:283–291. [Google Scholar]
- 24. Krissinel E (2012) Enhanced fold recognition using efficient short fragment clustering. J Mol Biochem 1:76–85. [PMC free article] [PubMed] [Google Scholar]
- 25. DeLano WL (2002) The PyMOL Molecular Graphics Systems, DeLano Scientific, San Carlos, CA.
- 26. Tateno H, Mori A, Uchiyama N, Yabe R, Iwaki J, Shikanai T, Angata T, Narimatsu H, Hirabayashi J (2008) Glycoconjugate microarray based on an evanescent‐field fluorescence‐assisted detection principle for investigation of glycan‐binding proteins. Glycobiology 18:789–798. [DOI] [PubMed] [Google Scholar]
- 27. Hu D, Tateno H, Sato T, Narimatsu H, Hirabayashi J (2013) Tailoring GalNAcα1‐3Galβ‐specific lectins from a multi‐specific fungal galectin: dramatic change of carbohydrate specificity by a single amino‐acid substitution. Biochem J 453:261–270. [DOI] [PubMed] [Google Scholar]
Associated Data
This section collects any data citations, data availability statements, or supplementary materials included in this article.
Supplementary Materials
Supporting Information Figure 1.
Supporting Information Figure 2.
Supporting Information Figure 2A.
Supporting Information Tables.


