Abstract
The charge density (CD) distribution of an atom is the difference per unit volume between the positive charge of its nucleus and the distribution of the negative charges carried by the electrons that are associated with it. The CDs of the atoms in macromolecules are responsible for their electrostatic potential (ESP) distributions, which can now be visualized using cryo‐electron microscopy at high resolution. CD maps can be recovered from experimental ESP density maps using the negative Laplacian operation. CD maps are easier to interpret than ESP maps because they are less sensitive to long‐range electrostatic effects. An ESP‐to‐CD conversion involves multiplication of amplitudes of structure factors as Fourier transforms of these maps in reciprocal space by 1/d 2, where d is the resolution of reflections. In principle, it should be possible to determine the charges carried by the individual atoms in macromolecules by comparing experimental CD maps with experimental ESP maps.
Keywords: electrostatic potential, ESP, electron scattering, electron microscopy, Laplacian operation, long‐range interactions, B‐factor sharpening, Guinier plot
Introduction
The physics of the scattering of electrons and X‐rays by atoms is well understood, and it is clear that the three‐dimensional density distributions obtained by electron microscopy (EM) differ qualitatively from those produced by X‐ray crystallography.1, 2, 3, 4 The X‐ray scattering factor for an atom is the Fourier transform of its spherically averaged electron density (ED) distribution. Molecular structure factors can be well approximated as Fourier sums of independent atomic structure factors, and for this reason the images of molecules in X‐ray maps correspond well to those expected for assemblies of independent atoms. By contrast, the electron scattering factors usually used for atoms are the Fourier transforms of their spherically averaged, electrostatic potential (ESP) distributions. Thus in an EM map at atomic resolution or sub‐Ångstrom resolution, the image of an isolated neutral atom will be a positive peak centered on the position of its nucleus, surrounded by a negative halo. Because the shielding effect afforded by the atom's electrons, the ESP density associated with its peak will fall to zero at a distance from its nucleus that is close to the atom's van der Waals (vdW) radius.5, 6 However, if the atom is an ion, its ESP will extend indefinitely beyond its vdW radius. The redistributions of electrons caused by covalent bonding, let alone by polar covalent bonding, can also result in atomic images that look quite different from those of neutral atoms, and that may extend well beyond their vdW radii. Thus in ESP maps, the images of adjacent atoms can interfere with each other in ways that are never seen in ED maps. For example, anions will always be much less prominent in the ESP maps than they are in ED maps.7, 8, 9
When EM data are processed using the negative Laplace operation, as advocated below, the images of atoms no longer correspond to their ESP distributions, but rather to their charge density (CD) distributions. Since the CD distributions of atoms are always contained within their vdW envelopes,5, 6 the images of molecules in maps of this kind resemble sums of images of independent atoms much more closely than the images of molecules in ordinary EM maps. In addition, at high scattering angles, nuclear charges dominate scattering factors, and as a consequence, a CD map will tend to be better resolved than the corresponding EM map. The differences between EM maps and CD maps will be explored in this study using simulated and experimental data.
Results and Discussion
Theoretical relationship between ESP maps and CD maps
The CD function of an atom, (r) or (XYZ), is defined as follows:10, 11, 12
| (Eq. 1) |
where Z is the atomic number, δ is a Dirac δ‐function, ΔZ is the net charge carried by that atom if any (ΔZ = 0 for a neutral atom), and ρ(r) is the atomic ED function. Both residue‐specific and environment‐specific terms may contribute in cases where ΔZ is not zero.3, 13, 14, 15, 16 The ΔZ term is also called as Coulomb charge term in ESP functions. The ESP function of an atom, ψ(r) or ψ(XYZ), is the integral over all space of its CD:3, 17
| (Eq. 2) |
where is dielectric constant in vacuum. CD maps can be recovered from ESP maps by taking advantage of Poisson's equation (dielectric constant inside proteins are assumed here to be a constant):
| (Eq. 3) |
where s is scattering vector, ‖s‖ = 2πsinθ/λ, 2θ is the scattering angle. There is nothing new about this approach to obtaining ESP maps from CD maps, and vice versa.10, 11, 12 In fact, there is a routine in UCSF's Chimera that does computations of exactly this kind (see Methods for some basic instructions).18
It is easy to obtain an expression for atomic structure factors appropriate for computing CD maps by applying Eq. (4) to the Mott equation,2
| (Eq. 4) |
where f ( e ) is electron scattering factor, f ( X ) is X‐ray scattering factor, m 0 is the stationary mass of the electron, e is the charge of the electron, and h is the Planck constant (for review on this subject, see Ref. 19) (Fig. 1). Given Eqs. 4 and 5, it follows that,
| (Eq. 5) |
where f ( CD )(s) is structure factor that should be used to represent single atoms in CD maps (Fig. 1). It is obvious that the term (Z+ΔZ) represents the Fourier transform of a point charge having a value of (Z+ΔZ), and that f ( X )(s) is the Fourier transform of the spherically averaged ED distribution of that atom.
Figure 1.
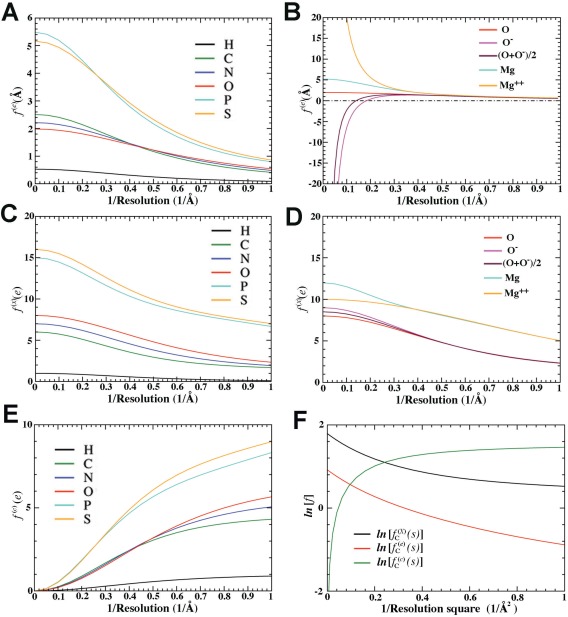
Atomic scattering factors (Å or e in atomic unit) as a function of reciprocal resolution (Å−1). A,B: Atomic ESP scattering factor for atoms and ions in Å. C,D: Atomic ED scattering factors in e. E: Atomic CD scattering factor in e. F: Natural logarithm of atomic scattering factors for C atom in form of atomic ED, ESP, and CD as a function of reciprocal resolution squared.
It should be emphasized that the value obtained for either a molecular ED function or a molecular CD function at any particular location is relatively insensitive to effects caused by the presence of charged groups in the neighborhood, or by local variations in dielectric constant whereas molecular ESP functions are very sensitive to both. Consequently it is notoriously difficult to calculate accurate ESP functions for macromolecules starting from atomic models (i.e., Refs. 20, 21, 22, 23, 24). These issues can be largely bypassed if the focus is on CD maps rather than ESP maps.
Given the relationship described above (Eq. 1) between the ED maps obtained in X‐ray crystallography and the CD maps recovered from cryo‐EM using the procedure outlined in this study, a sum of these two maps after proper scaling will result in the charges of the individual atoms (j) in the macromolecules, i.e.,
| (Eq. 6) |
Experimental CD maps and ESP maps for nucleic acids
One of the peculiar features of the EM maps of nucleic acids is that the density associated with phosphate groups is less than that associated with the corresponding bases. Previously published simulations have already shown that this is a result of the fact that the phosphate groups in nucleic acids carry a net negative charge.7 The EMB‐2847 map used in that study, as well as in this study, was a report on the structure of a ribosome complex at ∼ 2.9‐Å resolution, and had already been sharpened by applying a B factor of −120 Å2 to the corresponding reciprocal space data.25 The EM map sharpening of this kind artificially lowers weighting factors for low‐resolution terms where negative Coulomb charge term can dominate. Thus, this does tend to distort the true features of ESP maps by reducing the impact of net charge effects. However, it does not make the ESP values for the non‐bridging oxygen atoms of backbone phosphates much more positive than they are in the unsharpened map.
In contrast, phosphate groups have density values larger than or similar to those of bases in the unsharpened experimental CD map that results when this EM map is processed using negative Laplacian operation described above (Eq. 3) (Fig. 2). In addition, the phosphate groups are everywhere better resolved in this experimental CD map than they are in the parent ESP map (Supporting Information Fig. S1). Moreover, this improvement is also evident when unsharpened CD maps are compared with artificially sharpened ESP maps (Supporting Information Fig. S1). These findings are consistent with those obtained using simulated ESP and CD maps (Supporting Information Fig. S2).
Figure 2.

Relative amplitudes for phosphate groups of a G:C base pair in the large ribosomal subunit (Ref. 25) increases from the unsharpened experimental ESP map (EMD‐2847) (A), ESP maps sharpened by the original authors with B‐factor of −120 Å2 (B), and experimental CD map (C) contoured at +6.0σ. See Supporting Information Figures S1 and S2 for comparison of simulated and experimental ESP and CD maps.
It is unfortunate that almost all of the EM maps deposited in the EMD recently are sharpened maps,26, 27 sometimes by as much as B‐factor = −1000 Å2, but in many cases the actual B‐factor used is not reported. This makes it impossible to recover the original, experimental ESP maps that should be used to compute CD maps.
Experimental ESP maps and CD maps for proteins
It is obvious that experimental CD maps for nucleic acids are likely to be superior to the corresponding ESP maps. Is the same true for proteins? This question was addressed here by examining the EM maps that have been published for E. coli β‐galactosidase (BGal)28, 29 at 2.2‐Å resolution and T. Acidophilum proteasome at 3.3‐Å to 2.4‐Å resolution,30, 31 two of which are available for both proteins.
The CD maps obtained for BGal from EMD‐2984 and EMD‐4116 are both better resolved than their parent ESP maps at 2.2‐Å resolution, and this is true for all the residues in each protein, without exception (Figs. 3, 4, 5, Supporting Information Figs. S3‐S7). In fact, in most regions, the spatial resolution of these CD maps is also higher than that of the sharpened ESP maps on file in the EMD (Figs. 3, 4, 5, Supporting Information Figs. S3‐S7). Somewhat surprisingly, the improvement in spatial resolution seen in experimental CD maps appears to be more significant for branched hydrophobic residues than it is for aromatic residues such as Phe and Trp in both experimental and simulated maps (Fig. 3, Supporting Information Fig. S8). The B‐factor value used to sharpen EMD‐4116 was not reported in the original publication,28 but this can be obtained by re‐running the last post‐refinement step from the two halves of EM maps deposited in the EMD.
Figure 3.
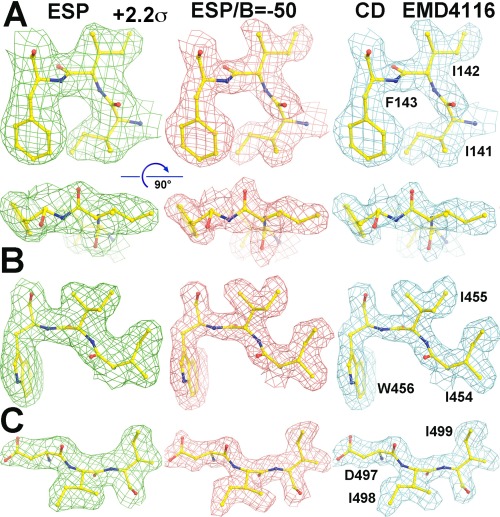
Comparison of unsharpened ESP (left column), sharpened by original authors using B‐factor of −50 Å2 (middle column), Laplacian filtered CD map (right column) contoured at +2.2σ of EMD‐4116 (Ref. 28) for three tripeptides (A–C) containing two Ile residues each. Two orthogonal views are provided in (A) for visualizing carbonyl bumps in the maps.
Figure 4.
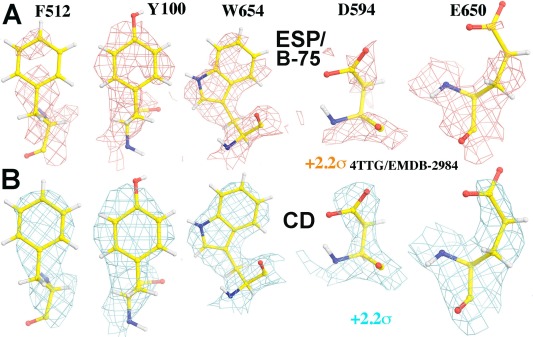
Appearance for all recognizable side chains (EMD‐2984, Ref. 29) can be improved from the sharpened experimental ESP map by the original authors (A, +2.2σ, salmon), and the experimental CD map (B, +2.2σ, cyan) viewed at the same contour level. See Supporting Information Figures S3–S7 for atlas of each of these five side chains.
Figure 5.
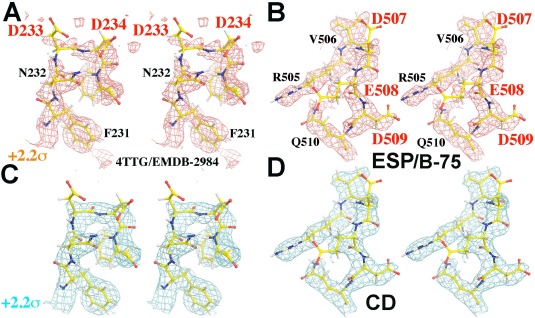
Appearance for all recognizable main chains and side chains involving a cluster of negatively charged residues (EMD‐2984, Ref. 29) can be improved from the sharpened experimental ESP map by the original authors (A, B; +2.2σ, salmon), and the experimental CD map (C, D; +2.2σ, cyan) viewed at the same contour level in stereodiagram.
The results obtained with the two EM maps reported for proteasome,30, 31 which are at somewhat lower resolution (3.3 Å and 2.4 Å versus 2.2 Å) than those for BGal, are particularly striking.28, 29 A careful analysis was made of the 33 Ile residues present in the unique α/β subunits of the model for the proteasome identified as 3J9I, which was derived from the EMD‐5623 map at 3.3‐Å resolution.30 The side chain rotamers of 15 of the Ile residues are incorrectly assigned. These mistakes can easily be identified by using the experimental CD maps31 derived from EMD‐3456 at 2.4‐Å resolution, which has a resolution somewhat higher resolution than of the EMD‐5623 map, or by comparing the 3J9I model to the X‐ray model for the same structure, 1YAR32, which was solved at a resolution of 1.90‐Å with free R‐factor of 21.6%, and then, subsequently, re‐refined to a free R‐factor of ∼ 16.5% (unpublished results). These mistakes are likely to occur when programs that automatically select side‐chain rotamers are applied to the ESP maps, and X‐ray scattering factors are used to interpret the density. The reason they are made is that the partial charges on three substituents on the Cβ atoms of isoleucine residues affect their appearance in ESP maps at medium and low resolution when individual non‐H atoms in the protein remain unresolved. At that resolution, the Coulomb charge term caused by partial charges of atoms and groups dominate the ESP maps. According to the calculations of Kollman and coworkers,15, 33 the order of residue‐specific atomic group charges of Ile residue for ESP maps is as follows: H > CH3 ∼ CH2CH3, which is reversed in ED maps (i.e., they follow the density order of CH2CH3 > CH3 ≫ H).
In fact, mistakes in rotamer selection can be found throughout 3J9I30 not only just for Ile, but also for all of the other branched residues, i.e., Val, Leu, and Thr. Previously, it was noted that in ESP maps the three non‐H substituents on Cα atoms appear to be coplanar.40 The same is true in nearly all the unsharpened ESP maps recently published for the branch point carbon atom in many branched hydrophobic side chains such as the Cβ atoms of Ile and Val, and the Cγ atoms of Leu. Artificial sharpening of ESP maps does not appear to help much in most cases, and thus it is difficult to properly orient the three non‐H substituents Cγ1/Cγ2/Cα atoms on Cβ atom of Val residue for example. CD maps appear to suffer from this defect much less than ESP maps do in these two examples.
Methods
The simulations done here are based on the Bethe equation, which represents molecular ESP functions as linear combinations of eigen solutions of Bloch waves weighted by coefficients that represent boundary of atoms or electron scattering lengths.34 That is, molecular ESP maps are sums of all independent atomic ESP functions.7 Electron scattering factors for neutral and simple ions are taken from International Tables of Crystallography,35 and from Peng and colleagues.19, 36 For simulations of molecular functions from atomic coordinates of a small molecular fragment, the molecule is placed in the middle of cubic box with the edge length approximately of twice the maximal dimension with uniform motion B‐factors assigned that correspond to a given resolution. For example, Phe side chain fragment is placed in cubic box with edge length of 10 Å. For simulations of molecular functions at resolution of 1.5, 1.8, 2.0, 2.2, 2.5, 3.0, 3.5, 4.0, 5.0, and 6.0 Å, atomic motion B‐factors are assigned to be 16.3, 22.7, 27.5, 32.7, 41.3, 57.4, 76.0, 96.9, 145.3, and 202.4 Å2, respectively. This relationship is derived from X‐ray data sets deposited in the PDB upon analysis of Wilson B values of the data set and resolution data reported by users from all the PDB entries retrieved from the PDB in mid‐April 2014 as follows (Fig. 6): ln[B] = 2.0548 – 1.8169 ln[s]. The correlation coefficient for this linear regression was 0.988.
Figure 6.
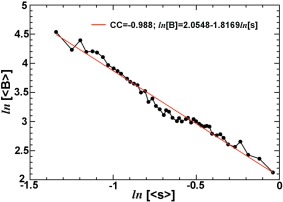
Logarithm‐logarithm analysis of resolution‐Wilson B‐factor relationship using users’ reported data for all the PDB data sets retrieved in mid‐April, 2014 for modeling motion B‐factors used in simulation in this study.
Examples of volumetric operations (vop) on experimental ESP maps in Chimera are as follows: (i) “vop Laplacian #1,” (ii) “vop scale #2 factor −1,” and (iii) “vop Gaussian #3 sDev 0.1 invert true..18 Readers are encouraged to consult Chimera users manual for carrying out these operations. When an ESP map is subject to negative Laplacian operation, it results in the corresponding CD map; when a CD map is subject to negative Laplacian operation at sub‐Ångstrom resolution, it results in the relief plots that provide information on valence shell charge concentrations (VSCC) on specific chemical bonds.3, 37 To counter the effect of high‐frequency systematical noise of any kind in experimental EM data, one may apply an additional Gaussian smoothening function that is beyond what is necessary to remove the B‐factor sharpening used by investigators. The combination of additional Gaussian smoothening with Laplacian filter results in a special windowing function that would down weigh amplitudes at both ends of resolution spectrum (Supporting Information Fig. S9). Resulting maps were analyzed and visualized using the graphics programs Chimera and Coot.18, 38 Figures were made using the program Pymol.39
Concluding Remarks
This study shows how CD maps can be obtained from experimental EM maps. It is clear from the data shown above that unsharpened CD maps are easier to interpret than even sharpened ESP maps. This finding raises questions about the rationale for sharpening of experimental EM maps in the first place. Sharpening is currently an integral part of many of the data processing procedures used for EM image reconstruction, and it appears to be based on an application of the Guinier plot to EM data.26 Because Guinier plot is valid only at very low resolution and for X‐ray scattering, the wisdom of using it to determine how much to sharpen high‐resolution electron scattering data is open to question. In any case, the B‐factor values used for sharpening maps ought to be reported for all EM structures deposited in the EMD. It might also make sense to deposit separately the two halves of maps used to compute Fourier shell correlation coefficients so that users can estimate uncertainties for both amplitudes and phases of the Fourier transforms of ESP maps on the reflection‐by‐reflection basis.
Supporting information
Supporting Information
ACKNOWLEDGMENT
The author thanks Dr. Peter B. Moore for insightful discussions during this study, suggestions on manuscript reorganization, and editing this manuscript. The author appreciates the efforts of the editorial board to reconsider an initial rejection decision on the original submission, and the willingness of an anonymous expert reviewer to reconsider and re‐review it.
References
- 1. James RW (1930) X‐ray crystallography, London: Methuen. [Google Scholar]
- 2. Mott NF (1930) The scattering of electrons by atoms. Proc R Soc London A 127:658–665. [Google Scholar]
- 3. Bader RFW (1990) Atoms in molecules: a quantum theory. Oxford: Clarendon Press. [Google Scholar]
- 4. Coppens P ( 1997) X‐ray charge densities and chemical bonding, International Union of Crystallography. Chester, England: Oxford University Press. [Google Scholar]
- 5. Reisfeld G, Asaf U (1994) Relation between the electron‐scattering length and the Van‐Der‐Waals approximation to the equation of state. Phys Rev A 49:348–349. [DOI] [PubMed] [Google Scholar]
- 6. Iakubov IT, Khrapak AG (1995) Relation between the electron‐scattering length and the Van‐Der‐Waals approximation to the equation of state ‐ comment. Phys Rev A 51:5043–5044. [DOI] [PubMed] [Google Scholar]
- 7. Wang J, Moore PB (2017) On the interpretation of electron microscopic maps of biological macromolecules. Protein Sci 26:122–129. [DOI] [PMC free article] [PubMed] [Google Scholar]
- 8. Wang J (2017) On the appearance of carboxylates in electrostatic potential maps. Protein Sci 26:396–402. [DOI] [PMC free article] [PubMed] [Google Scholar]
- 9. Hirai T, Mitsuoka K, Kidera A, Fujiyoshi Y (2007) Simulation of charge effects on density maps obtained by high‐resolution electron crystallography. J Electron Microsc 56:131–140. [DOI] [PubMed] [Google Scholar]
- 10. Wang ZL ( 1995) Elastic and inelastic scattering in electron diffraction and imaging. New York: Plenum Press. [Google Scholar]
- 11. Volkov A, King HF, Coppens P, Farrugia LJ (2006) On the calculation of the electrostatic potential, electric field and electric field gradient from the aspherical pseudoatom model. Acta Cryst A62:400–408. [DOI] [PubMed] [Google Scholar]
- 12. Spackman MA (2007) Comment on the calculation of the electrostatic potential, electric field and electric field gradient from the aspherical pseudoatom model by Volkov, King, Coppens & Farrugia (2006). Acta Cryst A63:198–200. [DOI] [PubMed] [Google Scholar]
- 13. Cole DJ, Vilseck JZ, Tirado‐Rives J, Payne MC, Jorgensen WL (2016) Biomolecular force field parameterization via atoms‐in‐molecule electron density partitioning. J Chem Theory Comput 12:2312–2323. [DOI] [PMC free article] [PubMed] [Google Scholar]
- 14. Phillpot SR, Sinnott SB (2009) Materials science. Simulating multifunctional structures. Science 325:1634–1635. [DOI] [PubMed] [Google Scholar]
- 15. Bayly CI, Cieplak P, Cornell WD, Kollman PA (1993) A well‐behaved electrostatic potential based method using charge restraints for deriving atomic charges—the Resp Model. J Phys Chem‐US 97:10269–10280. [Google Scholar]
- 16. Cornell WD, Cieplak P, Bayly CI, Gould IR, Merz KMJ, Ferguson DM, Spellmeyer DC, Fox T, Caldwell JW, Kollman P (1995) A second generation force field for the simulation of proteins, nucleic acids, and organic molecules. J Am Chem Soc 117:5179–5197. [Google Scholar]
- 17. Fogolari F, Brigo A, Molinari H (2002) The Poisson‐Boltzmann equation for biomolecular electrostatics: a tool for structural biology. J Mol Recognit 15:377–392. [DOI] [PubMed] [Google Scholar]
- 18. Yang Z, Lasker K, Schneidman‐Duhovny D, Webb B, Huang CC, Pettersen EF, Goddard TD, Meng EC, Sali A, Ferrin TE (2012) UCSF Chimera, MODELLER, and IMP: an integrated modeling system. J Struct Biol 179:269–278. [DOI] [PMC free article] [PubMed] [Google Scholar]
- 19. Peng LM (1999) Electron atomic scattering factors and scattering potentials of crystals. Micron 30:625–648. [Google Scholar]
- 20. Hildebrandt A, Blossey R, Rjasanow S, Kohlbacher O, Lenhof HP (2004) Novel formulation of nonlocal electrostatics. Phys Rev Lett 93:18104. 1–4). [DOI] [PubMed] [Google Scholar]
- 21. Hildebrandt A, Blossey R, Rjasanow S, Kohlbacher O, Lenhof HP (2007) Electrostatic potentials of proteins in water: a structured continuum approach. Bioinformatics 23:E99–E103. [DOI] [PubMed] [Google Scholar]
- 22. Xie DX, Jiang Y (2016) A nonlocal modified Poisson‐Boltzmann equation and finite element solver for computing electrostatics of biomolecules. J Comput Phys 322:1–20. [Google Scholar]
- 23. Xie DX, Liu JL, Eisenberg B (2016) Nonlocal Poisson‐Fermi model for ionic solvent. Phys Rev E 94: [DOI] [PubMed] [Google Scholar]
- 24. Xie DX, Volkmer HW, Ying JY (2016) Analytical solutions of nonlocal Poisson dielectric models with multiple point charges inside a dielectric sphere. Phys Rev E93:043304 (1–11) [DOI] [PubMed] [Google Scholar]
- 25. Fischer N, Neumann P, Konevega AL, Bock LV, Ficner R, Rodnina MV, Stark H (2015) Structure of the E. coli ribosome‐EF‐Tu complex at <3 A resolution by Cs‐corrected cryo‐EM. Nature 520:567–570. [DOI] [PubMed] [Google Scholar]
- 26. Rosenthal PB, Henderson R (2003) Optimal determination of particle orientation, absolute hand, and contrast loss in single‐particle electron cryomicroscopy. J Mol Biol 333:721–745. [DOI] [PubMed] [Google Scholar]
- 27. Fernandez JJ, Luque D, Caston JR, Carrascosa JL (2008) Sharpening high resolution information in single particle electron cryomicroscopy. J Struct Biol 164:170–175. [DOI] [PubMed] [Google Scholar]
- 28. Kimanius D, Forsberg BO, Scheres SH, Lindahl E (2016) Accelerated cryo‐EM structure determination with parallelisation using GPUs in RELION‐2. Elife 5:e18722(1–25). [DOI] [PMC free article] [PubMed] [Google Scholar]
- 29. Bartesaghi A, Merk A, Banerjee S, Matthies D, Wu X, Milne JL, Subramaniam S (2015) 2.2 A resolution cryo‐EM structure of beta‐galactosidase in complex with a cell‐permeant inhibitor. Science 348:1147–1151. [DOI] [PMC free article] [PubMed] [Google Scholar]
- 30. Li X, Mooney P, Zheng S, Booth CR, Braunfeld MB, Gubbens S, Agard DA, Cheng Y (2013) Electron counting and beam‐induced motion correction enable near‐atomic‐resolution single‐particle cryo‐EM. Nat Methods 10:584–590. [DOI] [PMC free article] [PubMed] [Google Scholar]
- 31. Danev R, Tegunov D, Baumeister W (2017) Using the Volta phase plate with defocus for cryo‐EM single particle analysis. Elife 6:e23006(1–9). [DOI] [PMC free article] [PubMed] [Google Scholar]
- 32. Forster A, Masters EI, Whitby FG, Robinson H, Hill CP (2005) The 1.9 A structure of a proteasome‐11S activator complex and implications for proteasome‐PAN/PA700 interactions. Mol Cell 18:589–599. [DOI] [PubMed] [Google Scholar]
- 33. Duan Y, Wu C, Chowdhury S, Lee MC, Xiong GM, Zhang W, Yang R, Cieplak P, Luo R, Lee T, Caldwell J, Wang JM, Kollman P (2003) A point‐charge force field for molecular mechanics simulations of proteins based on condensed‐phase quantum mechanical calculations. J Comput Chem 24:1999–2012. [DOI] [PubMed] [Google Scholar]
- 34. Bethe HA (1928) Theorie der beugung von elektronen an krisallen. Ann Phys 87:55–129. [Google Scholar]
- 35. Prince E. 2004. International tables for crystallography. Volume C. London, UK: Kluwer Academic Publishers. [Google Scholar]
- 36. Peng LM, Dudarev SL, Whelan MJ (1998) Electron scattering factors of ions and dynamical RHEED from surfaces of ionic crystals. Phys Rev B 57:7259–7265. [Google Scholar]
- 37. Koritsanszky T, Flaig R, Zobel D, Krane H, Morgenroth W, Luger P (1998) Accurate experimental electronic properties of dl‐proline monohydrate obtained within 1 Day. Science 279:356–358. [DOI] [PubMed] [Google Scholar]
- 38. Emsley P, Cowtan K (2004) Coot: model‐building tools for molecular graphics. Acta Cryst D60:2126–2132. [DOI] [PubMed] [Google Scholar]
- 39. DeLano WL (2002) The PyMOL Molecular Graphics System. Version 1.8. Schrödinger, LLC.
- 40. Wang J (2017) On contribution of known atomic partial charges of protein backbone in electrostatic potential density maps. Protein Sci. DOI: 10.1002/PRO.3169. [Epub ahead of print]. [DOI] [PMC free article] [PubMed] [Google Scholar]
Associated Data
This section collects any data citations, data availability statements, or supplementary materials included in this article.
Supplementary Materials
Supporting Information


