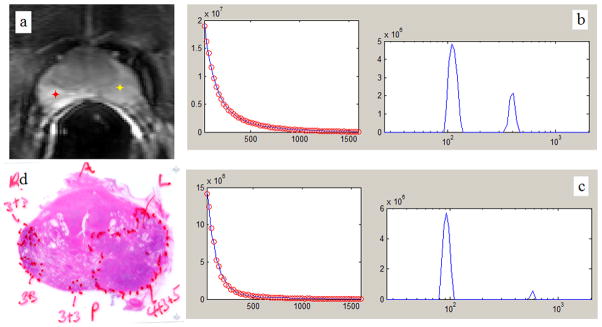
Figure 1.
a: 1st echo T2W image of an axial cross section from a middle level of a prostate gland. b: Non-Negative Least Squares (NNLS) fitting of the multi-exponential T2 decay curve (left-hand side) generated from the pixel in non-malignant PZ (red marker in a.), and its correspondent T2 distribution (right-hand side). c: NNLS fitting of the multi-exponential T2 decay curve (left-hand side) generated from the pixel in malignant PZ (yellow marker in a.), and its correspondent T2 distribution (right-hand side).d: histology whole-mount section of the same slice.

