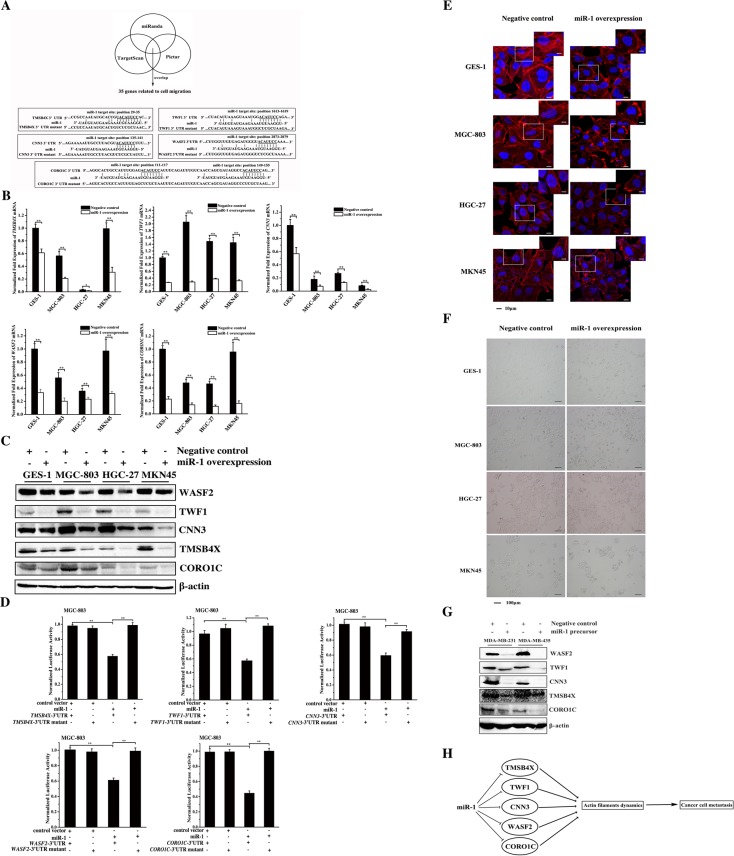
Figure 5. The miR-1-mediated pathway for cancer cell metastasis.
A. The prediction of genes targeted by miR-1. As predicted, 35 genes associated with cell migration were miR-1 targets. The genes (TMSB4X, TWF1, CNN3, WASF2 and CORO1C) targeted by miR-1 are indicated in the boxes. B. The interactions between miR-1 and its targets in vivo. The miR-1 precursor or the negative control miRNA was transfected into gastric cancer cells (MGC-803, HGC-27 and MKN45) and the normal cells (GES-1). At 24 h after transfection, the mRNAs of the 35 target genes of miR-1 were detected using quantitative real-time PCR. Among the 35 target genes, 5 genes (TMSB4X, TWF1, CNN3, WASF2 and CORO1C) were significantly downregulated in response to miR-1 overexpression. C. The influence of miR-1 on target gene expression. Cells were transfected with the miR-1 precursor or the negative control miRNA. At 24 h after transfection, the proteins encoded by the target genes were examined using Western blot analysis. The antibodies used are indicated at the right. D. The direct interactions between miR-1 and its target genes. The miR-1 precursor and the 3′ UTR of TMSB4X, TWF1, CNN3, WASF2 or CORO1C were co-transfected into MGC-803 cells. Luciferase activity was measured at 24 h after transfection. And the ratio of firefly luciferase activity to Renilla luciferase activity is shown. E. Effects of miR-1 on the actin filament formation. Cells treated with the miR-1 precursor or negative control miRNA for 48h were stained with rhodamine-phalloidin (red) and DAPI (blue) to label F-actin and nuclei, respectively. Then stained cells were subjected to confocal microscopy. Scale bar, 10 μm. F. The influence of miR-1 on cell morphology. The morphology of miR-1-overexpressing cells was examined with optical microscopy. Scale bar, 100 μm. G. Western blot analysis of WASF2, TWF1, CNN3, TMSB4X and CORO1C. Breast cancer cells were treated with 30 nM of the miR-1 precursor or the negative control miRNA and cultured for 48 h. The whole-cell lysates were subjected to Western blot analysis. β-actin was used as a control. H. Model for the miR-1-mediated inhibitory mechanism of cancer cell metastasis. All experiments were biologically repeated three times. The data are shown as the mean ± standard deviation (* p < 0.05, ** p < 0.01).

